
Virtual Reality for Pilot Training: Study of Cardiac Activity
Patrice Labedan
a
, Nicolas Darodes-de-Tailly, Fr
´
ed
´
eric Dehais
b
and Vsevolod Peysakhovich
c
ISAE-SUPAERO, Universit
´
e de Toulouse, France
Keywords:
Virtual Reality, Flight Simulation, Heart Rate, Heart Rate Variability, Piloting.
Abstract:
Flight training is provided through real flights with real aircraft and virtual flights using simulators. Nowadays
a third alternative way emerges which is the use of immersive virtual reality (VR) flight deck. However, the
effectiveness of this technology as a training tool for pilots has not yet been fully assessed. We, therefore,
conducted an experiment involving four pilots that had to perform the same traffic pattern scenario (take off,
downwind, and landing) in a VR simulator and real flight conditions. We collected subjective (perceived task
difficulty) and objective data (trajectory, cardiac activity). In this this preliminary study, the first descriptive
results disclosed that pilots had similar flying trajectories in both conditions. As one could expect, the pilots
reported higher task difficulty and exhibited higher heart rate and lower heart rate variability in the real flight
condition compared to the VR one. However, similar patterns of subjective rating and cardiac activation were
found across the different segments of the scenarios (landing > take off > downwind) for the two conditions.
These latter findings suggest that VR offer promising prospects for training purpose but that more experiments
have to be conducted following the proposed methodology.
1 INTRODUCTION
Today, air traffic is experiencing significant growth.
Statistics show that the number of passengers doubles
every 15 years. The International Air Transport As-
sociation (IATA) expects the number of passengers to
double again by 2037. The need for professional pi-
lots, therefore, remains high. However, there are two
main barriers to flight training to keep up to this trend:
the training cost and the availability of aircraft, simu-
lators, and flight instructors. Immersive virtual reality
(VR) seems to be an interesting alternative to reduce
costs and get around the lack of availability of re-
sources (aircraft, simulators, instructors). Moreover,
the recent development of this technology makes the
design of virtual environments such as flight simula-
tors much more flexible (Kozak et al., 1993). The VR
is already used professionally in various fields such as
UAV pilot training (Postal et al., 2016), phobia treat-
ment (Banos et al., 2002; Hodges et al., 1996), or fire
fighting (Cha et al., 2012). In 2020, Varjo announced
that the astronauts are preparing for the spaceflight
with Boeing Starliner using the VR headsets (Varjo,
2020).
a
https://orcid.org/0000-0001-5492-1153
b
https://orcid.org/0000-0003-0854-7919
c
https://orcid.org/0000-0002-9791-4460
The medical field is a forerunner in the field
of VR adoption, especially in surgery (Silverstein
et al., 2002). For example, VR has allowed trainee
surgeons to acquire skills without threatening the
lives of patients, especially in laparoscopic surgery
(Grantcharov et al., 2004), with positive results in
terms of feelings of presence and the ability to trans-
fer the training to the real operation. These promising
results in the field of surgery and its similarities to
flight, including high levels of stress, accuracy, and
risk-taking (S Galasko, 2000), make VR worthy of
consideration for pilot training.
However, the use of VR as an operational learn-
ing tool still presents challenges in terms of immer-
sion, sense of presence, fatigue, and motion sickness
(Labedan et al., 2018). Indeed, it is recognized that
simulators do not reproduce the level of engagement
that pilots may experience in real-world conditions
(Gateau et al., 2018). Studies comparing VR and sim-
ulator training (Lawrynczyk, 2018) or simulator and
real flight training (Hays et al., 1992), have already
been conducted. A recent study (Labedan et al., 2018)
with pilot instructors showed that the strong feeling
of immersion, combined with good controllability of
the aircraft, generates high presence levels. Another
recent study (Peysakhovich et al., 2020) showed that
VR is an efficient tool for learning checklists in the
Labedan, P., Darodes-de-Tailly, N., Dehais, F. and Peysakhovich, V.
Virtual Reality for Pilot Training: Study of Cardiac Activity.
DOI: 10.5220/0010296700810088
In Proceedings of the 16th International Joint Conference on Computer Vision, Imaging and Computer Graphics Theory and Applications (VISIGRAPP 2021) - Volume 2: HUCAPP, pages
81-88
ISBN: 978-989-758-488-6
Copyright
c
2021 by SCITEPRESS – Science and Technology Publications, Lda. All rights reserved
81

Figure 1: The flight phases considered: take-off, downwind
and landing, each lasting 60 seconds.
early stages of pilot training. However, to date, no
research has been found directly comparing VR and
real flights, which is our goal here.
Evaluating the effectiveness of virtual reality as
a solution for pilot training requires being able to
compare this type of learning to that carried out
in real flight. An interesting perspective for such
a comparison is to measure subjective and objec-
tive indicators of the mental effort of pilots in both
virtual and real flight situations. Cardiac activity,
in particular, is a possible indicator for cognitive
load (Meshkati, 1988), even in operational conditions
(Scannella et al., 2018). A similar approach had al-
ready been carried out to compare simulators to vir-
tual reality (Lawrynczyk, 2018). This study even
showed a slightly higher heart rate in virtual reality
than in a flight simulator.
The present study focuses mainly on the collection
and analysis of heart activity parameters, in reality,
and VR, with student pilots in training. Finally, we
confronted these objective results with subjective re-
sults concerning the difficulty perceived by the pilots
to perform the different flight phases of the chosen
scenario (Fig. 1).
2 MATERIALS AND METHODS
2.1 Participants
Four private pilot licence (PPL) student pilots from
ISAE-SUPAERO, Toulouse, France, took part in the
experiment (all males, 20-21-year-old, mean flight
hour experience: 15 hours). All reported normal vi-
sion and hearing as attested by their flight medical
certificate. No participants had a history of heart or
neurological disease and, as required by aviation reg-
ulations, no participants were taking any psychoactive
substances or medication. The pilots signed a consent
form before the experiment.
2.2 Flight Scenario
The experimental scenario consisted of several stan-
dard traffic patterns on runway 33 of Toulouse-
Lasbordes Aerodrome (France). This exercise has the
advantage of being particularly formalized in terms of
flight procedures and of being reproducible (Dehais
et al., 2019; Scannella et al., 2018).
In both environments (virtual reality and real
flights), the scenario was the same: the pilots made
three patterns without stopping the plane with a go-
around between each pattern, until the last one with
a complete stop of the aircraft on final landing. We
focus on three specific phases of the standard traffic
pattern:
• Take-off (from maximum power setting or touch-
and-go);
• Downwind (in the middle of the return path);
• Landing (before touchdown).
We cropped each phase recordings to 60 seconds to
directly compare the results to a previous study per-
formed in similar conditions (Scannella et al., 2018).
2.3 Measures
2.3.1 Electrocardiogram
The electrocardiograms (ECG) were acquired with a
Faros 360 eMotion device with three electrodes at a
sampling rate of 500 Hz. A conductive gel was ap-
plied to improve signal quality. The raw data were
recorded and stored via the LabRecorder software of
the LabStreamingLayer (LSL). In addition to the raw
ECG signal, the Faros system provided R-R intervals
data using a built-in R-detection algorithm.
2.3.2 Flight Parameters
During the virtual reality flights, the Aerofly FS2 sim-
ulator flight parameters were streamed, recorded, and
stored via the LSL LabRecorder. For the real flights,
an ILevil 2-10-AW acquisition unit was used to col-
lect the trajectory (via GPS), accelerations, altitude,
and speed (with available static and dynamic pres-
sure inputs). Similarly, these data were recorded and
stored via the LSL LabRecorder. This acquisition unit
had to be mounted in the aircraft’s cargo area at a
specific location that guaranteed the accuracy of the
attitude data (roll, pitch, and yaw). These parame-
ters were then used to automatically identify the three
flight phases of interest.
HUCAPP 2021 - 5th International Conference on Human Computer Interaction Theory and Applications
82
2.3.3 Questionnaire
The pilots filled out a subjective questionnaire to
evaluate the perceived difficulty during the different
phases (take-off, downwind, landing) in both environ-
ments (virtual reality and real flight). The question-
naire used a visual analog scale from 1 (very easy) to
7 (very difficult).
2.4 Environments
2.4.1 Virtual Reality
We used the VRtigo flight simulator at ISAE-
SUPAERO (Labedan et al., 2018). This simulator is
composed of the following elements:
• Aerofly FS2 flight simulation software (IPACS);
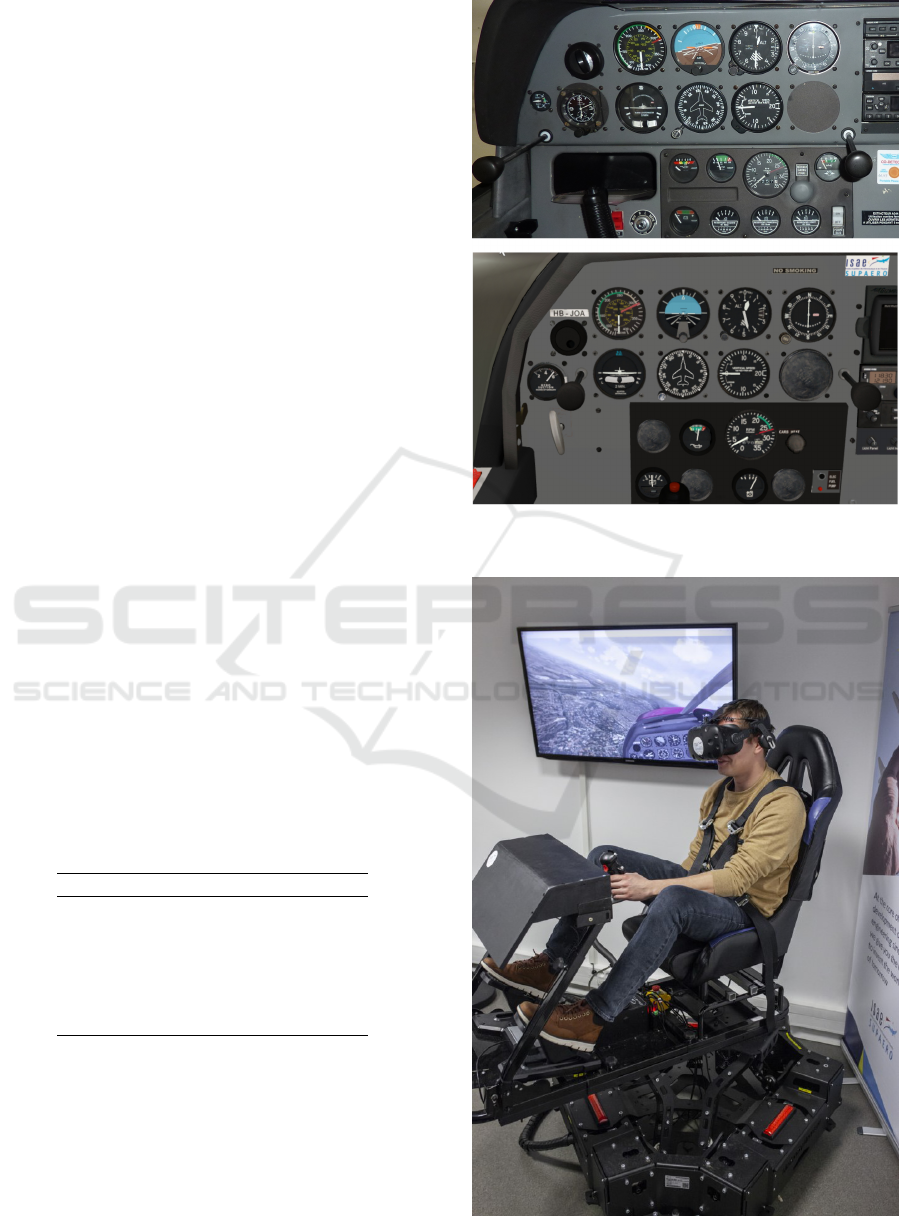
• An identically reproduced environment
(Toulouse-Lasbordes aerodrome, DR400 cockpit,
some buildings used by the pilots for visual cue,
etc.; Fig. 2);
• The 6-axis motion platform MotionSystems PS-
6TM-150 (features table 1);
• Conventional controls: stick, rudder, throttle, and
flap lever;
• A cockpit, including the controls and a pilot’s
seat;
• A virtual reality headset (HTC Vive);
• An Alienware ”VR ready” Laptop computer.
The interest of this platform is that the pilots
evolve in the same environment (real and virtual).
This homogeneity between environments was essen-
tial for the comparison.
Table 1: Features of the 6-axis moving platform.
Parameters Values
Heave -106.9mm +117.1mm
Pitch -25
◦
+25.6
◦
Roll +/-26
◦
Yaw +/-22.5
◦
Surge -100mm +121mm
Sway -99.5mm +121mm
2.4.2 Real Flights
The aircraft used during the experiments was an
ISAE-SUPAERO Robin DR400 with 160 HP. The
same aircraft is used by the students during their train-
ing at the PPL (Fig. 4).
Figure 2: DR400 cockpit reproduced identically; real (top)
and virtual (bottom).
Figure 3: VRtigo : the virtual flight simulator.
Virtual Reality for Pilot Training: Study of Cardiac Activity
83

Figure 4: DR400 used during the experiment.
2.5 Experimental Protocol
2.5.1 Real Flights
For each real flight, three people were present on the
plane: the participant in the front left seat, a flight in-
structor (FI) acting as a safety pilot on the right front
seat, the experimenter in the back seat. They first re-
ceived a briefing, then completed their pre-flight in-
spection, before finally receiving the ECG electrodes.
LSL’s Matlab Viewer application displayed ECG data
in real time, which was necessary to ensure data con-
sistency throughout the flight. The first data check
was performed between engine start and taxi. In a
nominal case, these checks lasted 20 seconds. The
data recordings began during the aircraft’s first take-
off and ended during the last landing. The experi-
menter in the rear seat monitored the ECG and flight
data throughout the flight to ensure that the data col-
lected was consistent. All four flights were conducted
on sunny days, in CAVOK (Ceiling and Visibility
OK) conditions (no obstructing cloud ceilings and
visibility greater than 10 km). There was sometimes
a strong crosswind (16 G 24 kt, 30
◦
off-axis, mean-
ing a wind at 16 knots, gusting to 24 knots, direc-
tion 30
◦
off the runway axis). Temperatures rose to
36
◦
C in the cockpit on the ground. The flight experi-
ence was approved by the European Aviation Safety
Agency (2403 2424 2487-EASA 0010011661).
2.5.2 Virtual Reality
The virtual reality flights were conducted in a
temperature-controlled room. Three people were in-
side the room:
• the participant (on the VRtigo platform),
• the experimenter monitoring ECG data and air-
craft configuration,
• the safety technician that controls the correct
functioning of the moving platform (ready to in-
terrupt the simulation at any time by pressing an
emergency stop button).
The weather conditions were CAVOK, and no
wind was programmed. The recordings were
switched on and off at the same time as the real flights.
2.6 Data Analyses
2.6.1 Electrocardiogram
The electrocardiogram (ECG) data were processed
both in terms of time period (HR: Heart Rate) and
heart variability (HRV: Heart Rate Variability). HR
and HRV are indicators generally used to report on the
mental workload and stress of the pilot (without, how-
ever, distinguishing between the two sources of vari-
ation) (Scannella et al., 2018; Togo and Takahashi,
2009). Usually, studies report an increase of HR and
a decrease of HRV (i.e. lower variability) as task de-
mand gets higher (Scannella et al., 2018; Togo and
Takahashi, 2009; Durantin et al., 2014).
Concerning the HRV, there are several metrics to
study it in the time domain. Some of these metrics,
for example the SDNN (Standard Deviation of the
Normal R-R intervals), are more suitable for long-
term analysis. The SDNN analysis would require sev-
eral hours of recording for a correct analysis (Ismail,
2012). Others metrics, like RMSSD (Root Mean
Square of the Successive Differences of the R-R inter-
vals) are meanly used for short-term analysis. In our
case (60 seconds flight phases), the RMSSD seemed
the most suitable as it requires only a few minutes of
recording (Ismail, 2012), and is the most commonly
used in this kind of analysis. The use of HR and HRV
requires only the recording of R-R intervals. From
a technical point of view, this is convenient because
the R peaks are the easiest to detect and almost in-
sensitive to noise. The R-R intervals of the raw ECG
signal were detected using the built-in QRS detection
algorithm of the KubiosHRV software. To eliminate
missed R peaks, false positives, and noise, the Ku-
biosHRV software’s strong filter was applied to the
acquired raw data set. We then plotted the average
HR (in beats per minute) and HRV (RMSSD, in ms)
values in the 60-second windows of each of the three
phases for each pattern.
3 RESULTS
The results were evaluated and displayed using Mi-
crosoft Excel and Matlab software. In the graphs that
will follow and that allow to compare the real flights
with the virtual reality, we have respected the follow-
ing color code for better readability: the real-world
HUCAPP 2021 - 5th International Conference on Human Computer Interaction Theory and Applications
84
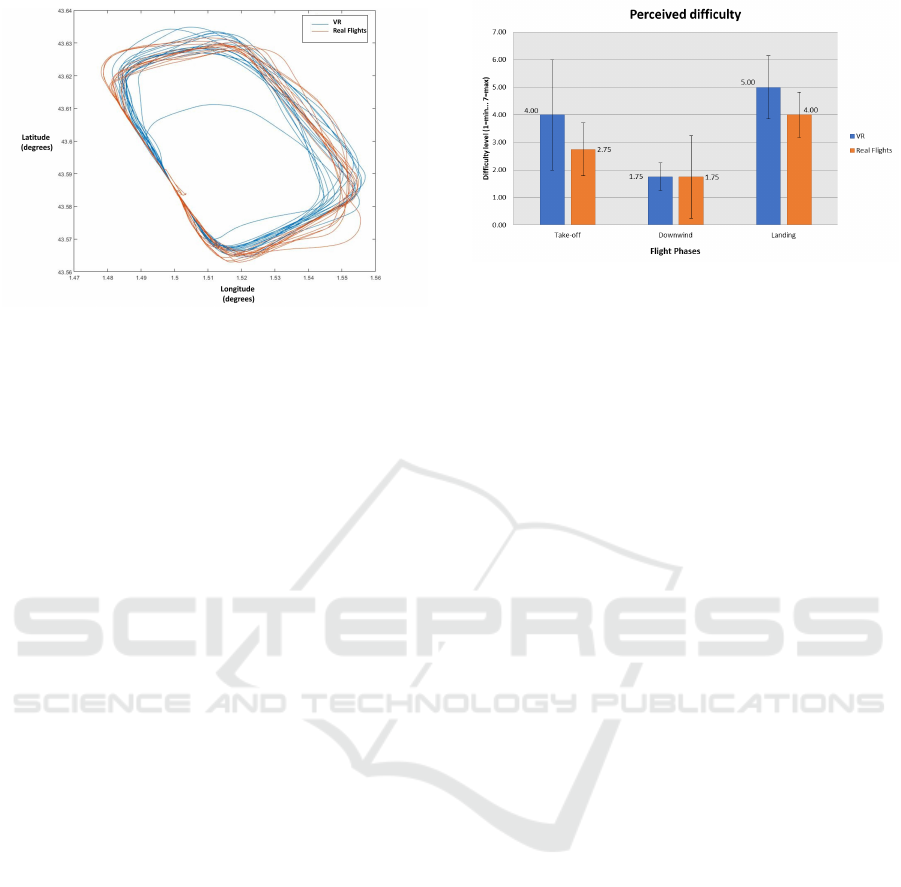
Figure 5: Cumulative trajectories in virtual reality (blue)
and real flights (orange).
results are depicted in orange, and the virtual reality
results are depicted in blue.
3.1 Flight Parameters
The flight parameters have not been fully exploited
for the moment. They were used in this study for
the extraction of the three flight phases by the anal-
ysis of the following parameters: longitude, latitude,
altitude, heading, and power. We then only visually
checked the trajectories to verify their coherence be-
tween real and virtual reality flights (Fig. 5).
3.2 Subjective Measures
The results of the questionnaire evaluating the diffi-
culty felt to carry out the three phases of flight (Take-
off, Downwind, Landing) can be found in Figure 6.
3.3 Cardiac Activity
The Figures 7 and 9 represent the comparative bal-
ance between the real world and virtual reality mea-
surements of average HR (heart rate) and average
HRV (heart rate variability). The abscissa corre-
sponds to the three phases of flight: Take-off, Down-
wind, Landing.
4 DISCUSSIONS
4.1 Subjective Measures
The answers to the questionnaire (fig. 6) disclosed
that in both environments (real and virtual), the pilot
students experienced, on average, a lower level of dif-
ficulty in carrying out the downwind phase. They thus
Figure 6: Difficulty felt for the realization of the flight
phases (1:very easy ... 7:very difficult).
found that the phases close to the ground (take-off and
landing) were the most difficult, with higher reported
difficulty for the landing. Such findings are consistent
with previous experiments (Scannella et al., 2018;
Dehais et al., 2008).
Looking now in more detail at the difference be-
tween real and virtual reality (Fig. 6), our participants
reported a similar level of difficulty in the downwind
leg. On the other hand, each of the phases close to the
ground (take-off and landing) was found to be more
difficult to achieve in virtual reality than in the real
condition. One reason could rely on a lower level of
experience when using the VR simulator than the real
airplane. Another reason could be related to some
limitation of the virtual reality simulator noted dur-
ing a previous study (Labedan et al., 2018). In par-
ticular, the low graphic resolution of the VR headset
negatively impacts pilots’ ability to read the value of
the speed. They also experienced difficulty to grasp
and interact with the throttle and flap lever. We also
noted, during post-flight discussions with the pilots,
that the sensations during the phases of flight close
to the ground, essentially the landing, were not com-
pletely realistic, even with the 6-axis moving plat-
form. The ground effects were not simulated realis-
tically enough, which may have disturbed the pilots
to flare the plane during landing.
4.2 Cardiac Activity
4.2.1 HR
As far as the real flights were concerned, the HR
analyses showed that the closer the plane was to the
ground, the higher the HR was, with a maximum for
landing (orange in figure 7). Indeed, the mean HR in
real flight was 6.3% higher (take-off) and 8.3% higher
(landing) than during the downwind phase. These re-
sults were consistent with previous findings reported
during a traffic pattern experiment in real flight con-
Virtual Reality for Pilot Training: Study of Cardiac Activity
85
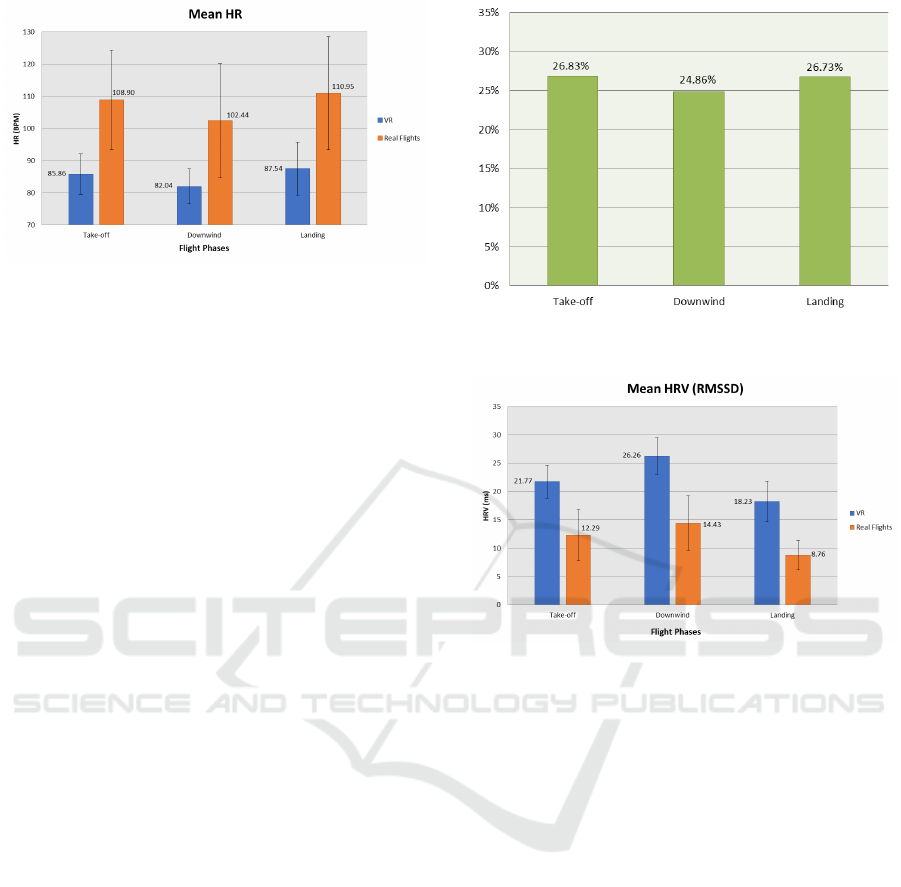
Figure 7: Mean HR (Real flights and VR).
ditions (Scannella et al., 2018). For virtual reality
flights, it was interesting to note that the comparison
of these three phases was of the same order of mag-
nitude as for real flights with respectively an increase
of 4.66% (take-off) and 6.71% (landing) compared to
the downwind phase, with a maximum for landing.
In both environments (virtual and real), the HR of the
downwind phase was, therefore, lower than that of the
other two phases and maximum for landing. We also
noted, both in VR and in real flight, that the evolution
of the HR following the three flight phases tended to
be similar.
The HR analysis also revealed a gap between vir-
tual reality and real flights (fig. 7). The HR was
higher in real flight by about 27%, 25%, and 27% re-
spectively for take-off, downwind, and landing com-
pared to virtual reality (fig. 8). This result could be
interpreted as a lack of feeling of immersion experi-
enced by participants in the VR condition. However,
it is important to mention that the real flights were
performed with crosswinds, especially for two of the
pilots (16 G 26 kt at 30
◦
from the runway axis). The
crosswind induced in return higher mental demand
(constant correction of trajectories). These aerolog-
ical differences conditions could thus explain this dif-
ference between VR and reality findings.
4.2.2 HRV: The RMSSD Parameter
The analysis of the mean RMSSD during the real fight
condition (orange bars in Figure 9) disclosed higher
values in downwind than during the take-off and land-
ing phases, with a minimum for landing. These re-
sults for real flights were again similar to (Scannella
et al., 2018). The results in virtual reality (Fig. 9, the
blue bars), followed a similar law than in real flight
but with higher average RMSSD in downwind than
during the take-off and landing phases, and a mini-
mum for landing. Again, these results seem to sug-
gest that the real flight condition induced higher men-
tal demand and psychological stress than in the simu-
lated condition.
Figure 8: Percentage increase in mean HR between virtual
and real flights, by flight phase.
Figure 9: Mean HRV (real flights and VR).
The analysis of the RMSSD (Fig. 9) also revealed
a gap between real flights and virtual reality. The
RMSSD values were on average 56%, 54%, and 48%
lower in reality than in VR. This is also in line with
the results of the HR analysis, but with a stronger (and
reversed) lag.
4.3 Motion Sickness
None of the pilots reported motion sickness after us-
ing the VRtigo platform during the experiments. Our
sample of pilots was too small, so this result will need
to be confirmed on larger samples in future experi-
ments.
4.4 Conclusions and Perspectives
This preliminary study provided encouraging results
for the use of virtual reality as a training tool for
pilots. Though we had only four participants, the
subjective and physiological findings were consistent
with previous real flights experiment (Scannella et al.,
2018; Dehais et al., 2008). Indeed, during the three
flight phases studied (take-off, downwind, landing),
HUCAPP 2021 - 5th International Conference on Human Computer Interaction Theory and Applications
86

the physiological parameters (HR and HRV) and the
subjective data (difficulty felt) evolved in the same
way. Then, similarly to (Gateau et al., 2018), higher
physiological responses were found in real flight com-
pared to simulated conditions. However, comparisons
between real and virtual reality flights disclosed that
these physiological responses followed a similar pat-
tern between the two conditions.
This study thus mainly contributed to the imple-
mentation of an experimental protocol and the acqui-
sition of experience for real flight and VR measure-
ments. The future experiments will also be conducted
with an eye tracker in both conditions to compare the
pilot’s scan pattern. Indeed, pilot’s attention is a key
issue for flight safety (Peysakhovich et al., 2018; De-
hais et al., 2008; Dehais et al., 2020) and there is a
need to measure to what extent VR can affect it. For
instance, we plan to use portable eye tracking sys-
tem both in the VR environment (Tobii eye tracking
VR system) and real flight environment (Tobii pro
glasses 2). Our goal is to perform basic eye move-
ment (fixation and saccades) as well area of interest
(AOIs) based analyses to compare pilot’s scanning in
the two conditions. Moreover, flight parameters will
also be studied more closely to provide other per-
formance metrics (eg. comparison of the moments
of action on flap management according to the flight
phases, maintaining speed and altitude, ...). Eventu-
ally, other subjective measures (stress, mental work-
load, fatigue) should be collected in the future to bet-
ter interpret the findings.
In order to achieve an almost perfect simulation,
the problem of the hard-to-read anemometer will have
to be solved. This can be a modification of the flight
simulator or a higher resolution helmet (expensive).
The ground texture will have to be richer if future re-
search requires flying under VFR navigation.
ACKNOWLEDGEMENTS
The authors would like to thank Sebastien Scan-
nella, Research Engineer in neuroergonomics at the
DCAS Department of ISAE-SUPAERO, for his pre-
cious help in the analysis of cardiac activity. Many
thanks to St
´
ephane Juaneda, the safety pilot, for his
availability to perform flights and his precious know-
how in flight experimentation. Special thanks to Fab-
rice Bazelot, Franck Yvars and Beno
ˆ
ıt Momier, all
LFCL mechanics, for their help during the configura-
tion of the experiments. A special thanks to all the pi-
lots who accepted to fly under very hot temperatures.
REFERENCES
Banos, R., Botella, C., Perpina, C., Alcaniz, M., Lozano,
J., Osma, J., and Gallardo, M. (2002). Virtual reality
treatment of flying phobia. IEEE Transactions on In-
formation Technology in Biomedicine, 6(3):206–212.
Cha, M., Han, S., Lee, J., and Choi, B. (2012). A virtual
reality based fire training simulator integrated with fire
dynamics data. Fire Safety Journal, 50:12 – 24.
Dehais, F., Causse, M., and Pastor, J. (2008). Embedded
eye tracker in a real aircraft: new perspectives on
pilot/aircraft interaction monitoring. In Proceedings
from The 3rd International Conference on Research
in Air Transportation. Fairfax, USA: Federal Aviation
Administration.
Dehais, F., Dupr
`
es, A., Blum, S., Drougard, N., Scannella,
S., Roy, R. N., and Lotte, F. (2019). Monitoring pilot’s
mental workload using erps and spectral power with a
six-dry-electrode eeg system in real flight conditions.
Sensors, 19(6):1324.
Dehais, F., Juaneda, S., and Peysakhovich, V. (2020). Mon-
itoring eye movements in real flight conditions for
flight training purpose. In 1st International Workshop
on Eye-Tracking in Aviation.
Durantin, G., Gagnon, J.-F., Tremblay, S., and Dehais, F.
(2014). Using near infrared spectroscopy and heart
rate variability to detect mental overload. Behavioural
brain research, 259:16–23.
Gateau, T., Ayaz, H., and Dehais, F. (2018). In silico vs.
over the clouds: on-the-fly mental state estimation of
aircraft pilots, using a functional near infrared spec-
troscopy based passive-bci. Frontiers in human neu-
roscience, 12:187.
Grantcharov, T. P., Kristiansen, V. B., Bendix, J., Bardram,
L., Rosenberg, J., and Funch-Jensen, P. (2004). Ran-
domized clinical trial of virtual reality simulation
for laparoscopic skills training. British Journal of
Surgery, 91(2):146–150.
Hays, R. T., Jacobs, J. W., Prince, C., and Salas, E.
(1992). Flight simulator training effectiveness: A
meta-analysis. Military Psychology, 4(2):63–74.
Hodges, L., Watson, B., Kessler, G., Rothbaum, B., and
Opdyke, D. (1996). Virtually conquering fear of
flying. IEEE Computer Graphics and Applications,
16(6):42–49.
Ismail, A. (2012). Int
´
er
ˆ
et de la variabilit
´
e du rythme car-
diaque comme marqueur de risque. PhD thesis.
Kozak, J. J., Hancock, P. A., Arthur, E. J., and Chrysler,
S. T. (1993). Transfer of training from virtual reality.
Ergonomics, 36(7):777–784.
Labedan, P., Dehais, F., and Peysakhovich, V. (2018). Eval-
uation de l’exp
´
erience de pilotage d’un avion l
´
eger en
r
´
ealit
´
e virtuelle. In ERGO’IA.
Lawrynczyk, A. (2018). Exploring Virtual Reality Flight
Training as a Viable Alternative to Traditional Simu-
lator Flight Training. PhD thesis, Carleton University.
Meshkati, N. (1988). Heart rate variability and men-
tal workload assessment. In Hancock, P. A. and
Meshkati, N., editors, Human Mental Workload, vol-
Virtual Reality for Pilot Training: Study of Cardiac Activity
87

ume 52 of Advances in Psychology, pages 101 – 115.
North-Holland.
Peysakhovich, V., Lefranc¸ois, O., Dehais, F., and Causse,
M. (2018). The neuroergonomics of aircraft cockpits:
the four stages of eye-tracking integration to enhance
flight safety. Safety, 4(1):8.
Peysakhovich, V., Monnier, L., Gornet, M., and Juaneda,
S. (2020). Virtual reality versus real-life training to
learn checklists for light aircraft. In 1st International
Workshop on Eye-Tracking in Aviation.
Postal, G. R., Pavan, W., and Rieder, R. (2016). A vir-
tual environment for drone pilot training using VR de-
vices. In 2016 XVIII Symposium on Virtual and Aug-
mented Reality (SVR). IEEE.
S Galasko, C. (2000). Competencies required to be a com-
petent surgeon. Annals of the Royal College of Sur-
geons of England, 82:89–90.
Scannella, S., Peysakhovich, V., Ehrig, F., Lepron, E., and
Dehais, F. (2018). Assessment of ocular and physi-
ological metrics to discriminate flight phases in real
light aircraft. Human Factors: The Journal of the Hu-
man Factors and Ergonomics Society, 60(7):922–935.
Silverstein, J. C., Dech, F., Edison, M., Jurek, P., Helton,
W., and Espat, N. (2002). Virtual reality: Immersive
hepatic surgery educational environment. Surgery,
132(2):274 – 277.
Togo, F. and Takahashi, M. (2009). Heart rate variability in
occupational health a systematic review. Industrial
Health, 47(6):589–602.
Varjo (2020). A new era in astronaut training.
https://varjo.com/boeing-starliner. Accessed: 2020-
10-22.
HUCAPP 2021 - 5th International Conference on Human Computer Interaction Theory and Applications
88
