
Automated Detection of COVID-19 from CT Scans using Convolutional
Neural Networks
Rohit Lokwani, Ashrika Gaikwad, Viraj Kulkarni, Anirudha Pant and Amit Kharat
DeepTek Inc., Pune, India
Keywords:
Artificial Intelligence, Machine Learning, Neural Networks, Deep Learning, Medical Imaging Analysis,
COVID-19, Radiology.
Abstract:
COVID-19 is an infectious disease that causes respiratory problems similar to those caused by SARS-CoV
(2003). In this paper, we propose a prospective screening tool wherein we use chest CT scans to diagnose the
patients for COVID-19 pneumonia. We use a set of open-source images, available as individual CT slices,
and full CT scans from a private Indian Hospital to train our model. We build a 2D segmentation model using
the U-Net architecture, which gives the output by marking out the region of infection. Our model achieves a
sensitivity of 0.96 (95% CI: 0.88-1.00) and a specificity of 0.88 (95% CI: 0.82-0.94). Additionally, we derive
a logic for converting our slice-level predictions to scan-level, which helps us reduce the false positives.
1 INTRODUCTION
Coronaviruses are a large family of RNA viruses that
are usually known to cause respiratory tract illnesses
like the common cold. They appear crown-like due to
their spiked surface and are categorized into 4 ma-
jor groups: alpha, beta, gamma, and delta. Most
coronaviruses affect animals and can be transmit-
ted between animals and humans (Kong and Agar-
wal, 2020). COVID-19 is the latest addition to the
list of animal-to-human transmissions, preceded by
SARS and MERS. COVID-19 is an infectious dis-
ease that has affected more than 6.8 million people
in the world as of June 8, 2020. The most com-
mon clinical manifestations include fever (83% of
patients), cough (82% of patients), and shortness of
breath (31% of patients) (Chen et al., 2020b). The
hallmarks of COVID-19 include bilateral distribution
of minute patchy shadows and ground-glass opacity
in the nascent stages. The progression of this dis-
ease is marked by the spread of these opacities and
infiltrates to both the lungs (Wang et al., 2020b).
The World Health Organization has published sev-
eral testing protocols for detecting the disease (Wang
et al., 2020a). The most commonly used reference
test for the diagnosis of COVID-19 is the real-time
reverse transcription-polymerase chain reaction (RT-
PCR) (Gundlapally et al., ).
Reverse Transcription Polymerase Chain Reaction
(RT-PCR) test is the key approach used for diagnos-
ing COVID-19. However, it has some limitations;
their shortcomings include the complex process used
for specimen collection, the amount of time required
for the analysis, and variability in the accuracy of the
tests (Bullock et al., 2020). Apart from this, a ma-
jor hurdle in controlling the spread of the disease is
the accuracy and shortage of testing kits (Zhao et al.,
2020a). Hence, computer-based detection assisted by
an expert in the loop with minimal infrastructure is
proposed as an alternative to testing kits and vaccines.
Computer-aided detection has helped in detecting, lo-
calizing, and segmenting out a varied set of diseases
using medical imaging analysis. In particular, ma-
chine learning is being used for medical imaging anal-
ysis by developing deep-learning systems that extract
the spatio-temporal representative features from an
image, analyze them, and decide the diagnostic out-
comes (Wang et al., 2020b).
The most common, economical, and easy-to-use
medical imaging and diagnostic technique is chest ra-
diography or chest X-rays. This technique plays an
important role in the diagnosis of lung diseases. Ex-
pert radiologists use chest X-ray images (CXRs) to
detect pathologies like pneumonia, tuberculosis, at-
electasis, infiltrates, and early lung cancer (Qin et al.,
2018). But, detecting COVID-19 using CXRs is
challenging due to the less evident visual features in
CXRs caused by the overlapping of ribs and soft tis-
sues and low contrast (Zhang et al., 2020). The lim-
ited availability of annotated images adds to the dif-
ficulty. The RT-PCR test is very specific but has a
lower sensitivity of 65-95%, which means that the
test can be negative even when the patient is infected
(Fang et al., 2020)(Ai et al., 2020). These short-
Lokwani, R., Gaikwad, A., Kulkarni, V., Pant, A. and Kharat, A.
Automated Detection of COVID-19 from CT Scans using Convolutional Neural Networks.
DOI: 10.5220/0010293605650570
In Proceedings of the 10th International Conference on Pattern Recognition Applications and Methods (ICPRAM 2021), pages 565-570
ISBN: 978-989-758-486-2
Copyright
c
2021 by SCITEPRESS – Science and Technology Publications, Lda. All rights reserved
565

comings can be resolved by using chest CT scans,
a cross-sectional imaging modality with high accu-
racy and speed, instead of CXRs. A recent study of
the coronavirus infection on the cruise ship “Diamond
Princess” showed evidence of the lung parenchymal
pattern (classic for COVID-19) on CT studies of the
chest in 54% of the asymptomatic cases (Inui et al.,
2020).
Most of the recent literature reported that COVID-
19-positive patients had characteristic features highly
evident in the CT scan images (Xie et al., 2020).
These features included different degrees of ground-
glass opacities with or without crazy-paving sign,
multifocal organizing pneumonia, and architectural
distortion in a peripheral distribution (Ai et al., 2020).
COVID-19 eventually develops into chronic pneumo-
nia, and thus the visual symptoms it has are similar to
those of bacterial and viral pneumonia. In CT scans,
the ground-glass opacities are more similar to con-
solidation (Wang et al., 2020b). Studies have proven
that chest CT has a higher sensitivity for the diagnosis
of COVID-19 as compared with RT-PCR tests taken
from swab samples (Ai et al., 2020). To curb human-
to-human transmission and isolate the affected from
the healthy, it is essential to detect the presence of
COVID-19 at an early stage. This is where CT assists
in the detection of minor infections (Anthimopoulos
et al., 2016).
In this paper, we propose a prospective technique
based on artificial neural networks wherein our model
predicts the CT scan as COVID-19 positive or nega-
tive. This screening tool can help prioritize the treat-
ment for patients with COVID-19 visual manifesta-
tions in their CT scans.
2 RELATED WORK
In the past few years, deep learning has evolved
as a technique with its capabilities extending from
classification and object detection to segmentation
in medical image analysis. Some studies showed
better results than expert radiologists. Rajpurkar
et al. (Rajpurkar et al., 2017) proposed and pre-
sented a DenseNET-121 model for pneumonia detec-
tion which performed binary classification on CXRs
using CNNs. This paper used F-1 score as the primary
metric but failed to specify the prevalence of the set.
Qin et al. (Qin et al., 2018) proposed pneumonia and
pulmonary edema classification by extracting textural
features. Parveen et al. (Parveen and Sathik, 2011)
used an FCM clustering algorithm to detect pneumo-
nia, where they showed that the lung area of the chest
appeared like a black or dark gray shaded region when
it became infected with pneumonia.
Recently, there have been many developments
in detecting COVID-19 from CXRs and CTs. Xu
et al. (Xu et al., ) proposed a 3D deep learning
model that categorized CT scans as either COVID-
19 pneumonia-positive or viral pneumonia-positive.
They trained a location-attention classification model
and used the predicted probabilities to give a predic-
tion calculated by a Bayesian function. Their best
model gave a recall of 86.7% and it needed further
validation on multi-clinical studies. Chen et al. (Chen
et al., 2020a) built a model using UNet++ (Zhou
et al., 2018), a powerful architecture for medical im-
age segmentation, and used a 3-consecutive slice and
quadrant-based post-processing approach to mark a
scan as positive or negative. This post-processing
approach helped them reduce the number of false
positives. Several studies have addressed diagnosis
as a binary classification problem, i.e., healthy vs.
COVID-19-positive (Bullock et al., 2020). For exam-
ple, Wang et al. (Wang et al., 2020b) used a mod-
ified Inception neural network architecture and at-
tained an accuracy of 79.3%. This model was trained
on the CTs having severe pathological infections and
it hence needs to be tested for all pathological stages
to validate this in real-world scenarios. Shan et al.
(Shan et al., 2020) developed a deep learning system
that automatically quantified infection regions of in-
terest (ROIs) and their volumetric ratios with respect
to the lung. Li et al. (Li et al., 2020) put forth a 3D
deep learning model, where they combined the 2D lo-
cal and 3D global features using a max-pooling opera-
tion and predicted the class using the probability score
from the softmax activation. One of the significant
limitations of this paper is that the model seems to
give 90% sensitivity on their test set, but hasn’t been
tested on the out-of-sample test set. In our paper, we
overcome this limitation. Jianpeng et al. (Zhang et al.,
2020) proposed a deep-learning architecture to differ-
entiate COVID-19 cases from non-COVID-19 cases
from CXRs. Their model is composed of three com-
ponents: a backbone network, a classification head,
and an anomaly detection head. The backbone net-
work extracts the high-level features and feeds them
to the rest of the heads. Zhou et al. (Zhou et al., 2020)
use a U-Net with attention mechanism to utilize rich
contextual features from the U-Net encoder, they train
their model using focal tversky loss for small lesion
segmentation. The model has been trained and eval-
uated on a small dataset of around 829 slices. Yan
et al. (Yan et al., 2020) propose a Feature Varia-
tion block which enhances the global intensity of the
pixels around the lung region and uses Progressive
Atrous Spatial Pyramid Pooling to handle manifes-
ICPRAM 2021 - 10th International Conference on Pattern Recognition Applications and Methods
566
tations at various scales. This model achieves state-
of-the-art performance on 3D U-Net models attaining
dice coefficient of 0.726 on datasets from China and
Germany.
Several other approaches used a 3-category classi-
fication method, differentiating healthy patients from
pneumonia and COVID-19. Xu et al. (Xu et al.,
) used classical ResNet architectures, adding fully-
connected layers at the end, and took the classifica-
tion approach to solve the problem. He et al. (He
et al., 2016) used ResNets for feature extraction, and
Song et al. (Song et al., 2020) used the Feature Pyra-
mid Networks (Lin et al., 2017), which are the back-
bone in U-Nets, for learning fine-grained features in
the images.
Gurujit et al. (Randhawa et al., 2020) identified
an intrinsic COVID-19 genomic signature and used
it together with a machine learning-based alignment-
free approach for an ultra-fast, scalable, and highly
accurate classification of whole COVID-19 genomes.
3 DATA
We used COVID-19-positive and non-COVID data
from GitHub (Zhao et al., 2020b) and consolidation
and healthy CT scans from a private Indian hospital.
The data obtained contained 275 CT scans labeled as
COVID-19-positive. The ground truth in these im-
ages was decided on the basis of their RT-PCR test
results. These CT images had different sizes from
143 patient cases (Zhao et al., 2020a). The scans
differed in voxel sizes but had the same aspect ra-
tio. In total, the data contained 5212 slices and was
split at patient-level into training, validation, and test
sets. Each set had a prevalence of 20% of positive
cases. As the available open-source data had resolu-
tions varying from 256x256 to 768x768, we resize the
input to 512x512 pixels. This input size was the me-
dian size of the images in the dataset and sufficed our
computational requirements. This model was trained
using a GPU with 16GB RAM. The original images
were in the unsigned int8 format, in the range of [0,
255]. We converted these images to floating-point 16,
in the range of [0, 1]. The output masks were in the
binary form [0, 1] at pixel-level, where 1s indicated
the region of interest. Table 1 shows the detailed dis-
tribution of data.
Qualified radiologists inspected the CT slices one-
by-one and classified each slice into one of two
classes: COVID and NON-COVID. The COVID class
contained slices where typical findings including bi-
lateral pulmonary parenchymal ground-glass and con-
solidative pulmonary opacities, sometimes with a
Table 1: Slice-Level Dataset splits.
Dataset COVID-
19
NON-
COVID
Total
slices
Training 657 2628 3285
Validation 120 477 597
Test 266 1064 1330
rounded morphology and a peripheral lung distribu-
tion (Chung et al., 2020) were observed. Ground-
glass opacification was defined as hazy increased lung
attenuation with preservation of bronchial and vascu-
lar margins, and consolidation was defined as opacifi-
cation with obscuration of margins of vessels and air-
way walls (Hansell et al., 2008). Notably, lung cavita-
tion, discrete pulmonary nodules, and lymphadenopa-
thy were marked as negative. Other slices where
above manifestations were not seen were marked as
NON-COVID. For COVID slices, the radiologists
also highlighted the region of interest where the man-
ifestations were observed using polygon masks.
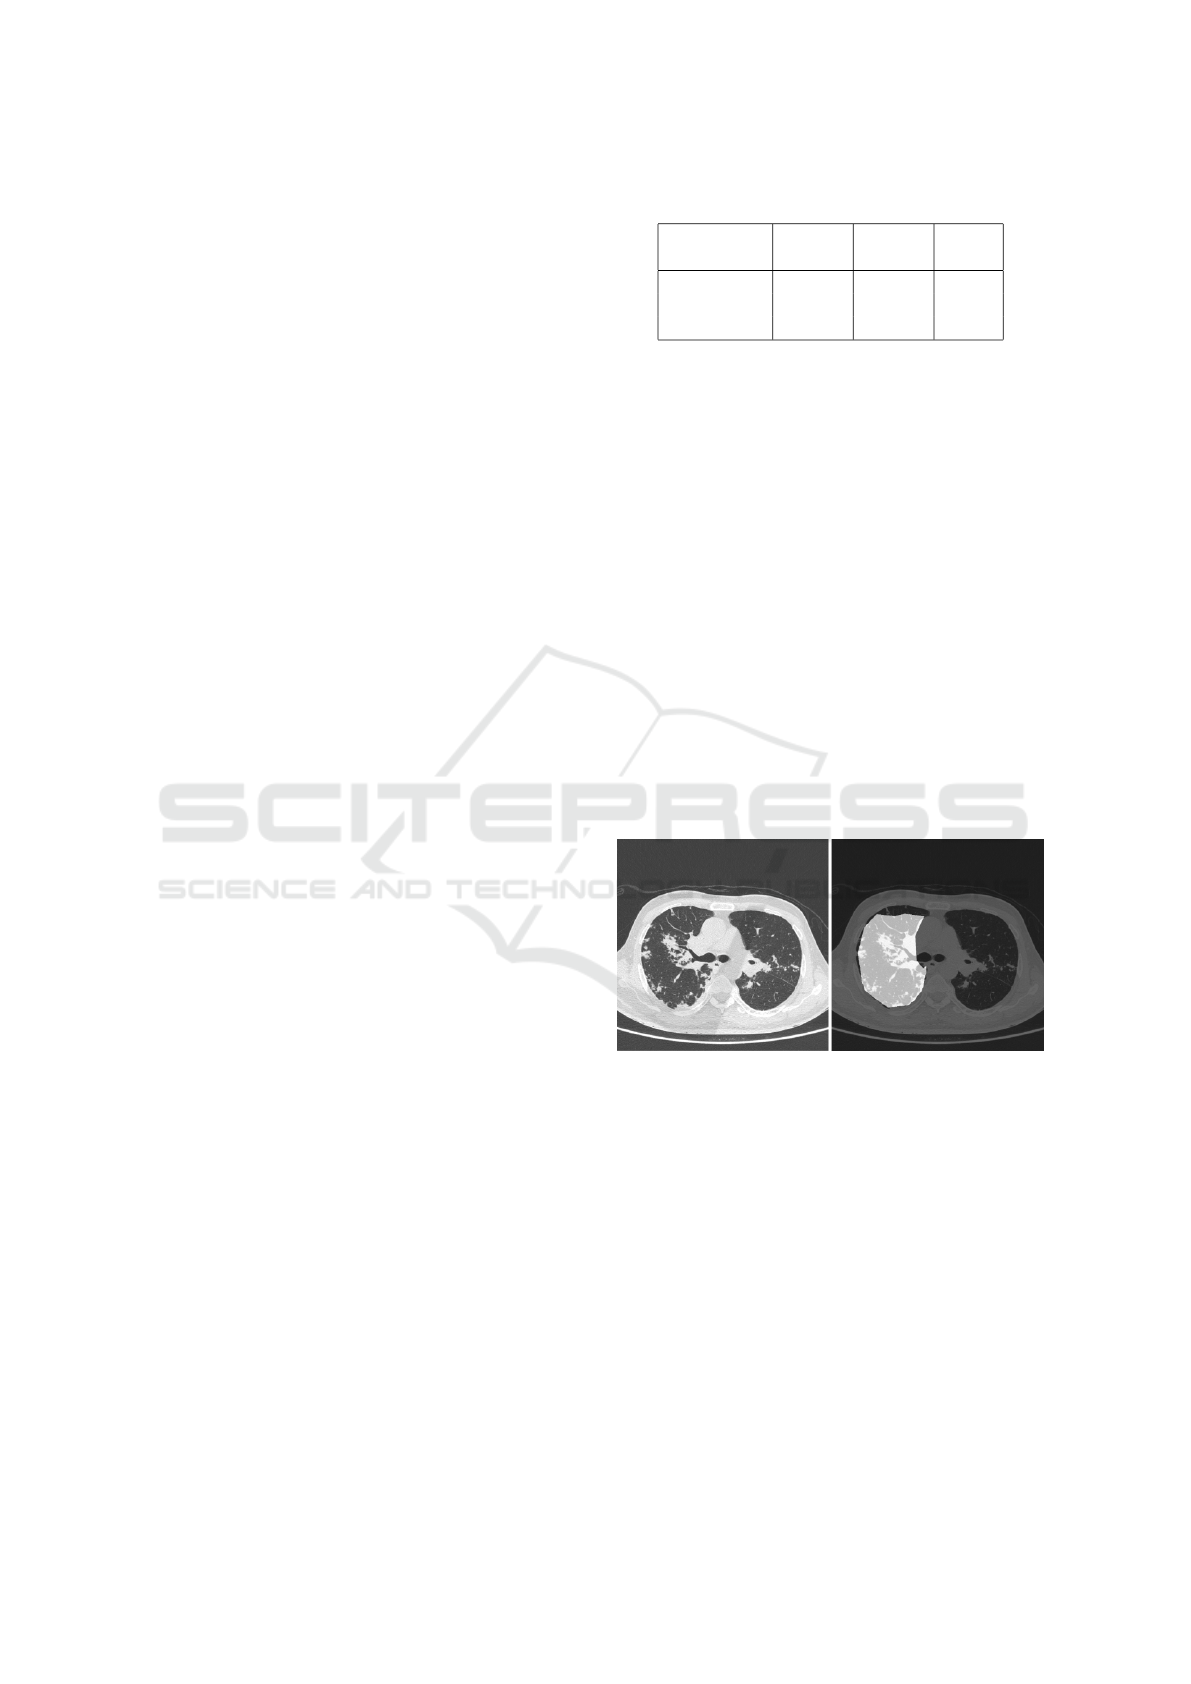
Figure 1 shows an example of the annotation. We
used positive slices from COVID positive CTs and
negative slices from healthy scans for training our
model, this helped us overcome the challenge of using
any false negatives to train the model. All the images
in Table 1. were annotated by the radiologists, con-
verted to masks and used as ground truth for training
and evaluating the model.
Figure 1: (Left) original image and (right) annotated ROI.
4 METHODOLOGY
In this section, we give a brief overview of our train-
ing and the inference algorithms.
We used U-Net (Ronneberger et al., 2015) for
medical image segmentation, which uses the concept
of deconvolution (Zeiler and Fergus, 2014). U-Nets
are built on the architecture of fully convolutional net-
works. The most important property of U-Net is the
shortcut connections between the layers of equal reso-
lution in the encoder path and the decoder path. These
connections provide essential high-resolution features
to the deconvolution layers (Hesamian et al., 2019).
Automated Detection of COVID-19 from CT Scans using Convolutional Neural Networks
567
Here, we used Xception (Chollet, 2017) as the en-
coder for U-Net. Xception with its depthwise separa-
ble convolutions and residual connections, has proven
to give better performance as compared to other mod-
els with similar parameters (Chollet, 2017).
Initially, we used ImageNet weights to train the
model, but the model predicted a cluster of pixels
instead of coherent masks. As we did not have a
CT model for the same architecture, we used trans-
fer learning by fine-tuning a network pre-trained on
CXRs for the same problem but a different task (Shin
et al., 2016). Transfer learning tends to give bet-
ter performance when the tasks of source and target
network are more similar; yet even transferring the
weights of far and distant tasks has been proved to
be better than random initialization (Yosinski et al.,
2014).
Here, we have tried to solve the problem of dis-
tinguishing COVID-19 cases from non-COVID-19 by
using weights from our COVID-19 vs healthy model,
as pre-trained weights for this model already gave a
sensitivity of 0.9 with a specificity of 0.8. We then
built a CT model for consolidation vs healthy and
later fine-tuned our model for COVID-19 vs non-
COVID-19.
In the training stage, we use binary cross entropy
as the loss function and the standard Adaptive Adam
Optimizer with a batch size of 4. We set the maxi-
mum epochs to 50 and set the learning rate to 10
−4
,
which is decayed on the plateau after patience of 4
epochs. We resize each training image to a fixed size
of 512× 512 pixels. To alleviate the overfitting of our
model on the training data from a particular source,
we try to include data from varied sources. One of
the drawbacks of having a 2D CT model is that the
inference tends to be slow. Since our model has a
sensitivity of 0.964, we plan to use specific slices for
inference.
5 RESULTS
We tested our model using varied sets of data from
different sources. We initially evaluated the model
on our test set, consisting of 1330 images, in which
COVID-19-positive samples had a prevalence of
20%. Our model gave a sensitivity of 0.963 (95% CI:
0.94-0.98) and a specificity of 0.936 (95% CI: 0.92-
0.95). The dice coefficient on positive samples was
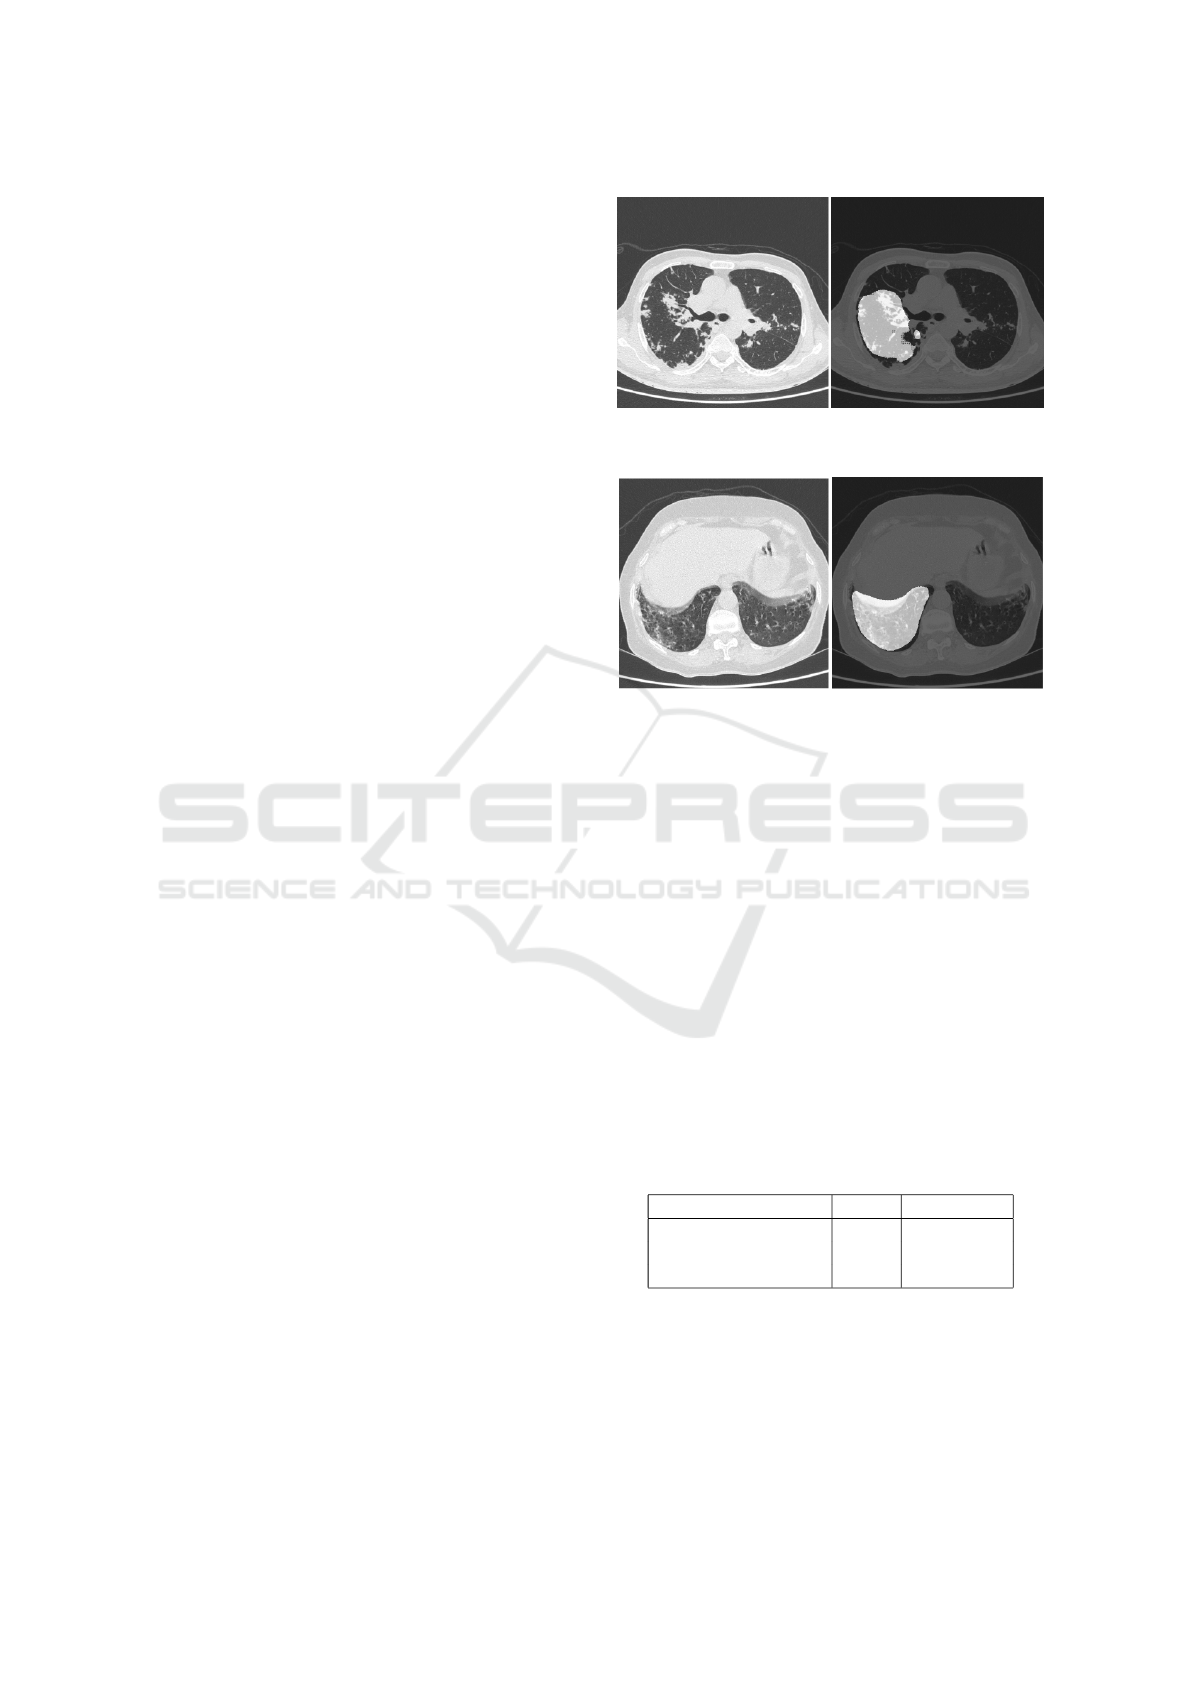
0.561. Figures 2 and 3 show the superimposed masks
on one of the slices.
Apart from this, we evaluated the model on a to-
tal of 140 scans with a prevalence of 20% for positive
cases. These scans were tested on data from three
Figure 2: (Left) original image and (right) corresponding
predicted mask.
Figure 3: (Left) original image and (right) corresponding
predicted mask.
sources. One source contained scans from Italy and
China, while the remaining came from two separate
private Indian hospitals. After passing these images
through our model, we sorted the slices as per the
position of the slice in the CT scan. We observed a
pattern wherein the consecutive slices had the same
predictions, which is expected from a radiology per-
spective. Figure 4 provides an example of the predic-
tions for a positive CT scan. Here we see the expected
pattern of consecutive slices, predicted as positive by
the model.
Hence, we convert the slice-level prediction to
scan-level prediction using the logic that if 15 consec-
utive slices in a scan are marked as positive, then we
mark the scan as positive (Chen et al., 2020a). Table
2 shows the results obtained at scan-level.
Table 2: Scan-Level performance of the model on the test
set.
Performance Metric Value 95% C.I.
Sensitivity 0.964 (0.88,1)
Specificity 0.884 (0.82,0.94)
F1-score 0.794 (0.68,0.89)
6 DISCUSSION
The diagnosis of COVID-19 using CXRs and CT
scans has gained significance since the ubiquitous
ICPRAM 2021 - 10th International Conference on Pattern Recognition Applications and Methods
568
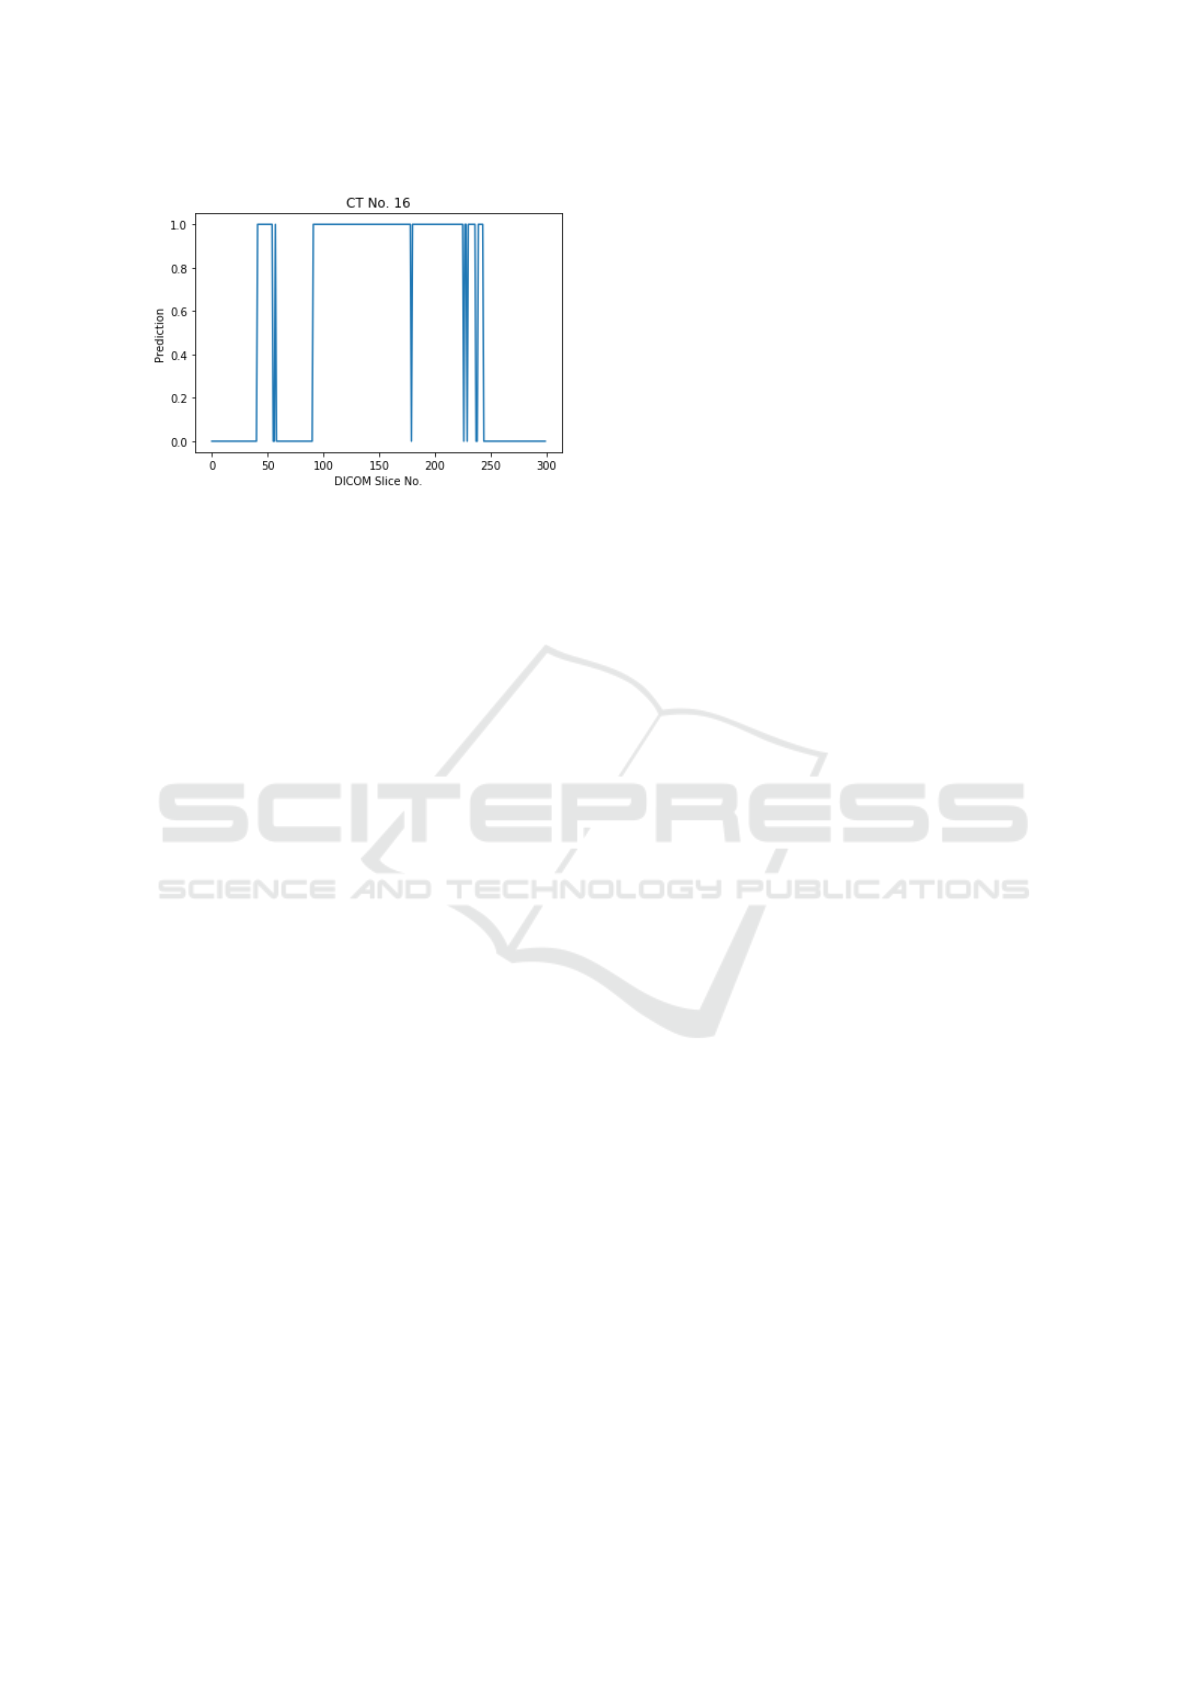
Figure 4: (Left) original image and (right) corresponding
predicted mask.
spread of this disease. But, chest CT scans usually
tend to show the region of infection more clearly than
CXRs (Kong and Agarwal, 2020). A limitation of
this study is that the patterns considered for COVID-
19 were few in number– notably consolidation and
ground glass opacity. These patterns might vary re-
gionally where pleural effusion could be observed in
COVID-19 infected patients. These patterns can even
overlap with other pathology manifestations.
Another limitation is we have not considered the
clinical history of the patient. The real-world util-
ity of this tool can be enhanced once it considers the
radiological and clinical parameters to determine the
ultimate outcome. Our current implementation is a
2D model built at slice-level. Since a CT study could
have the number of slices running into thousands, this
2D model certainly adds to the time complexity of
processing the whole scan. Although we are satis-
fied with the performance our model currently shows
on the data from diverse distributions, deploying the
model in production is a challenge, given the time
complexity.
In the future, we plan to implement a 3D model
that will take the whole CT scan as input and give out
masks for the infected areas. The primary challenge
with this approach will be the requirement of a lot
of annotated data to give an equivalent performance.
Additionally, we propose a model that differentiates
between COVID-19 and chronic and viral pneumo-
nia and address the challenges associated with it, like
fine-grained, accurate annotations and large amounts
of data for all the specified categories. In conclu-
sion, chest CT has proved to have a higher sensitiv-
ity than RT-PCR tests (Ai et al., 2020). Our analysis
suggests that chest CT can be a potential alternative
for COVID-19 screening and evaluation, especially
in epidemic situations where the spread is uncontrol-
lable, and diagnosis needs to be done with celerity.
REFERENCES
Ai, T., Yang, Z., Hou, H., Zhan, C., Chen, C., Lv, W., Tao,
Q., Sun, Z., and Xia, L. (2020). Correlation of chest ct
and rt-pcr testing in coronavirus disease 2019 (covid-
19) in china: a report of 1014 cases. Radiology, page
200642.
Anthimopoulos, M., Christodoulidis, S., Ebner, L., Christe,
A., and Mougiakakou, S. (2016). Lung pattern classi-
fication for interstitial lung diseases using a deep con-
volutional neural network. IEEE transactions on med-
ical imaging, 35(5):1207–1216.
Bullock, J., Pham, K. H., Lam, C. S. N., Luengo-Oroz, M.,
et al. (2020). Mapping the landscape of artificial intel-
ligence applications against covid-19. arXiv preprint
arXiv:2003.11336.
Chen, J., Wu, L., Zhang, J., Zhang, L., Gong, D., Zhao, Y.,
Hu, S., Wang, Y., Hu, X., Zheng, B., et al. (2020a).
Deep learning-based model for detecting 2019 novel
coronavirus pneumonia on high-resolution computed
tomography: a prospective study. medRxiv.
Chen, N., Zhou, M., Dong, X., Qu, J., Gong, F., Han, Y.,
Qiu, Y., Wang, J., Liu, Y., Wei, Y., et al. (2020b). Epi-
demiological and clinical characteristics of 99 cases of
2019 novel coronavirus pneumonia in wuhan, china: a
descriptive study. The Lancet, 395(10223):507–513.
Chollet, F. (2017). Xception: Deep learning with depthwise
separable convolutions. In Proceedings of the IEEE
conference on computer vision and pattern recogni-
tion, pages 1251–1258.
Chung, M., Bernheim, A., Mei, X., Zhang, N., Huang, M.,
Zeng, X., Cui, J., Xu, W., Yang, Y., Fayad, Z. A., et al.
(2020). Ct imaging features of 2019 novel coronavirus
(2019-ncov). Radiology, 295(1):202–207.
Fang, Y., Zhang, H., Xie, J., Lin, M., Ying, L., Pang, P.,
and Ji, W. (2020). Sensitivity of chest ct for covid-19:
comparison to rt-pcr. Radiology, page 200432.
Gundlapally, P., Pingili, S., and Doragolla, B. A novel coro-
navirus disease (covid-19) outbreak as a pandemic cri-
sis.
Hansell, D. M., Bankier, A. A., MacMahon, H., McLoud,
T. C., Muller, N. L., and Remy, J. (2008). Fleischner
society: glossary of terms for thoracic imaging. Radi-
ology, 246(3):697–722.
He, K., Zhang, X., Ren, S., and Sun, J. (2016). Deep resid-
ual learning for image recognition. In Proceedings of
the IEEE conference on computer vision and pattern
recognition, pages 770–778.
Hesamian, M. H., Jia, W., He, X., and Kennedy, P. (2019).
Deep learning techniques for medical image segmen-
tation: Achievements and challenges. Journal of dig-
ital imaging, 32(4):582–596.
Inui, S., Fujikawa, A., Jitsu, M., Kunishima, N., Watan-
abe, S., Suzuki, Y., Umeda, S., and Uwabe, Y.
(2020). Chest ct findings in cases from the cruise
ship “diamond princess” with coronavirus disease
2019 (covid-19). Radiology: Cardiothoracic Imag-
ing, 2(2):e200110.
Kong, W. and Agarwal, P. P. (2020). Chest imaging ap-
pearance of covid-19 infection. Radiology: Cardio-
thoracic Imaging, 2(1):e200028.
Automated Detection of COVID-19 from CT Scans using Convolutional Neural Networks
569

Li, L., Qin, L., Xu, Z., Yin, Y., Wang, X., Kong, B., Bai,
J., Lu, Y., Fang, Z., Song, Q., et al. (2020). Artifi-
cial intelligence distinguishes covid-19 from commu-
nity acquired pneumonia on chest ct. Radiology, page
200905.
Lin, T.-Y., Doll
´
ar, P., Girshick, R., He, K., Hariharan, B.,
and Belongie, S. (2017). Feature pyramid networks
for object detection. In Proceedings of the IEEE con-
ference on computer vision and pattern recognition,
pages 2117–2125.
Parveen, N. and Sathik, M. M. (2011). Detection of pneu-
monia in chest x-ray images. Journal of X-ray Science
and Technology, 19(4):423–428.
Qin, C., Yao, D., Shi, Y., and Song, Z. (2018). Computer-
aided detection in chest radiography based on artificial
intelligence: a survey. Biomedical engineering online,
17(1):113.
Rajpurkar, P., Irvin, J., Zhu, K., Yang, B., Mehta, H., Duan,
T., Ding, D., Bagul, A., Langlotz, C., Shpanskaya, K.,
et al. (2017). Chexnet: Radiologist-level pneumonia
detection on chest x-rays with deep learning. arXiv
preprint arXiv:1711.05225.
Randhawa, G. S., Soltysiak, M. P., El Roz, H., de Souza,
C. P., Hill, K. A., and Kari, L. (2020). Machine learn-
ing using intrinsic genomic signatures for rapid classi-
fication of novel pathogens: Covid-19 case study. Plos
one, 15(4):e0232391.
Ronneberger, O., Fischer, P., and Brox, T. (2015). U-net:
Convolutional networks for biomedical image seg-
mentation. In International Conference on Medical
image computing and computer-assisted intervention,
pages 234–241. Springer.
Shan, F., Gao, Y., Wang, J., Shi, W., Shi, N., Han, M., Xue,
Z., and Shi, Y. (2020). Lung infection quantification
of covid-19 in ct images with deep learning. arXiv
preprint arXiv:2003.04655.
Shin, H.-C., Roth, H. R., Gao, M., Lu, L., Xu, Z., Nogues,
I., Yao, J., Mollura, D., and Summers, R. M. (2016).
Deep convolutional neural networks for computer-
aided detection: Cnn architectures, dataset charac-
teristics and transfer learning. IEEE transactions on
medical imaging, 35(5):1285–1298.
Song, Y., Zheng, S., Li, L., Zhang, X., Zhang, X., Huang,
Z., Chen, J., Zhao, H., Jie, Y., Wang, R., et al. (2020).
Deep learning enables accurate diagnosis of novel
coronavirus (covid-19) with ct images. medRxiv.
Wang, M., Zhou, Y., Zong, Z., Liang, Z., Cao, Y., Tang,
H., Song, B., Huang, Z., Kang, Y., Feng, P., et al.
(2020a). A precision medicine approach to managing
2019 novel coronavirus pneumonia. Precision Clini-
cal Medicine, 3(1):14–21.
Wang, S., Kang, B., Ma, J., Zeng, X., Xiao, M., Guo, J.,
Cai, M., Yang, J., Li, Y., Meng, X., et al. (2020b). A
deep learning algorithm using ct images to screen for
corona virus disease (covid-19). MedRxiv.
Xie, X., Zhong, Z., Zhao, W., Zheng, C., Wang, F., and Liu,
J. (2020). Chest ct for typical 2019-ncov pneumonia:
relationship to negative rt-pcr testing. Radiology, page
200343.
Xu, X., Jiang, X., Ma, C., Du, P., Li, X., Lv, S., Yu, L.,
Chen, Y., Su, J., Lang, G., et al. Deep learning system
to screen coronavirus disease 2019 pneumonia. arxiv
2020. arXiv preprint arXiv:2002.09334.
Yan, Q., Wang, B., Gong, D., Luo, C., Zhao, W., Shen,
J., Shi, Q., Jin, S., Zhang, L., and You, Z. (2020).
Covid-19 chest ct image segmentation–a deep con-
volutional neural network solution. arXiv preprint
arXiv:2004.10987.
Yosinski, J., Clune, J., Bengio, Y., and Lipson, H. (2014).
How transferable are features in deep neural net-
works? In Advances in neural information processing
systems, pages 3320–3328.
Zeiler, M. D. and Fergus, R. (2014). Visualizing and under-
standing convolutional networks. In European confer-
ence on computer vision, pages 818–833. Springer.
Zhang, J., Xie, Y., Li, Y., Shen, C., and Xia, Y. (2020).
Covid-19 screening on chest x-ray images using deep
learning based anomaly detection. arXiv preprint
arXiv:2003.12338.
Zhao, J., Zhang, Y., He, X., and Xie, P. (2020a). Covid-
ct-dataset: a ct scan dataset about covid-19. arXiv
preprint arXiv:2003.13865.
Zhao, J., Zhang, Y., He, X., and Xie, P. (2020b). Covid-
ct-dataset: a ct scan dataset about covid-19. arXiv
preprint arXiv:2003.13865.
Zhou, T., Canu, S., and Ruan, S. (2020). An automatic
covid-19 ct segmentation based on u-net with atten-
tion mechanism. arXiv preprint arXiv:2004.06673.
Zhou, Z., Siddiquee, M. M. R., Tajbakhsh, N., and Liang, J.
(2018). Unet++: A nested u-net architecture for medi-
cal image segmentation. In Deep Learning in Medical
Image Analysis and Multimodal Learning for Clinical
Decision Support, pages 3–11. Springer.
ICPRAM 2021 - 10th International Conference on Pattern Recognition Applications and Methods
570
