
Building Information Monitoring via Gamification
Peter K
´
an
1
, Peter Ferschin
2 a
, Meliha Honic
3 b
and Iva Kovacic
3 c
1
Institute of Visual Computing and Human-Centered Technology, TU Wien, Vienna, Austria
2
Institute of Architectural Sciences, TU Wien, Vienna, Austria
3
Institute of Interdisciplinary Construction Process Management, TU Wien, Vienna, Austria
Keywords:
Gamification, Building Monitoring, Building Information Modeling, Spatial Localization, 3D Visualization,
Mobile Applications, Crowdsourcing.
Abstract:
For efficient facility management it is of high importance to monitor building information, such as energy con-
sumption, indoor temperature, occupancy as well as changes in building structure. In this paper we present a
novel methodology for monitoring information about building via gamification. In our approach, the employ-
ees of a facility record the states of building elements by playing a competitive mobile game. Traditionally,
external sensors are used to automatically collect information about the building usage. In contrast to that, our
methodology utilizes personal mobile phones of employees as sensors to identify objects of interest and report
their state. Moreover, we propose to use crowdsourcing as a tool for data collection. This way the users of the
mobile game are collecting points and compete with each other. At the end of the game the winning team gets
the reward. We utilized various gamification strategies to increase motivation of users to collect building data.
We extended the traditional 3D BIM model with temporal domain to enable tracking of building changes over
time. Finally, we run an experiment with real use case building in which the employees used our system for the
duration of three months. We studied our approach and our motivation strategies in a post-experiment study.
Our results suggest that gamification can be a viable tool for building information monitoring. Additionally,
we note that motivation plays a critical role in the data acquisition by gamification.
1 INTRODUCTION
Efficient management of buildings is a challenging
task because of big amount of required information.
This building information may contain data about the
usage of a building such as rooms occupancy, uti-
lization of natural ventilation, usage of air condition,
heating preferences, direct sun exposure, load of com-
puting hardware, and many other factors. Automatic
heating systems, ventilation, power systems, building
insulation, shading systems and network infrastruc-
ture should be set up in a way to fulfill the needs of
the facility users (employees) and at the same time to
optimize the energy usage. Therefore, the acquisition
and monitoring of the building information, includ-
ing its usage by employees, is necessary for efficient
facility management.
Typical problems in facility management are over-
heated offices, big energy loss due to the opened
a
https://orcid.org/0000-0002-2197-2760
b
https://orcid.org/0000-0002-8466-7122
c
https://orcid.org/0000-0002-0303-3284
windows with enabled heating at the same time, im-
proper lighting of the working area and others. In
order to tackle these problems the information about
the building elements and their properties is neces-
sary. The most common methodology for building
data acquisition is the installation of monitoring de-
vices which can automatically monitor electric power
usage, heating status, temperature, air quality, and
other metrics (Amaxilatis et al., 2017; M
¨
a
¨
att
¨
a et al.,
2017; Sayed and Gabbar, 2018). Many new build-
ings already have these devices installed during con-
struction. However, numerous old buildings would
require additional installation of these devices. The
installation of monitoring devices to existing building
sometimes require invasive operation on walls, elec-
tric cables and other appliances. Additionally, these
devices are not always well accepted by the employ-
ees of a facility. Therefore, traditional data acquisi-
tion by monitoring devices is often not a feasible so-
lution. The alternative methodologies for building in-
formation acquisition include estimation from materi-
als, equipment, or occupancy data (Edirisinghe et al.,
Kán, P., Ferschin, P., Honic, M. and Kovacic, I.
Building Information Monitoring via Gamification.
DOI: 10.5220/0010288902610270
In Proceedings of the 16th International Joint Conference on Computer Vision, Imaging and Computer Graphics Theory and Applications (VISIGRAPP 2021) - Volume 1: GRAPP, pages
261-270
ISBN: 978-989-758-488-6
Copyright
c
2021 by SCITEPRESS – Science and Technology Publications, Lda. All rights reserved
261
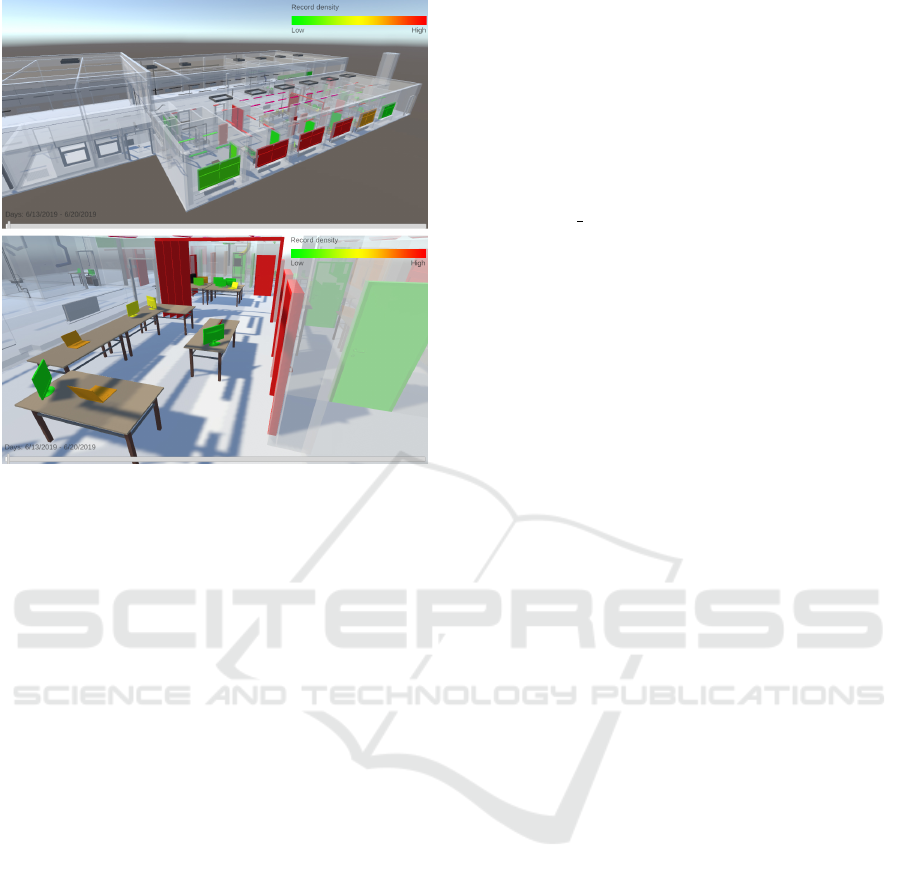
Figure 1: WebGL visualization of collected building infor-
mation. Data, collected by our mobile game, can be inter-
actively mapped to 3D BIM model and visualized. Various
properties can be mapped to color coded visualization for
facility management to provide a clear overview of building
behaviour over time.
2017) and interviews with facility staff. A drawback
of these alternative methods is that they provide lim-
ited or subjective information.
In order to address the above mentioned problems
we propose a novel approach for building informa-
tion monitoring based on gamification. In our ap-
proach the employees in the building play a competi-
tive mobile game in which they collect points by scan-
ning building elements and reporting their status. At
the end of the game period the team with the high-
est score wins valuable prizes. The critical factor in
data acquisition by humans is motivation. We hypoth-
esize that the gamification approach may increase the
motivation of facility employees to provide informa-
tion about the building via their mobile devices. Ad-
ditionally, we introduced advanced challenges in the
game to boost the motivation of users. Our approach
can serve as an alternative methodology for monitor-
ing buildings, energy usage tracking, maintenance re-
porting, construction process tracking, or communi-
cation with users about building changes, problems
and requirements. Moreover, our method is based on
the Building Information Modeling (BIM) and the ac-
quired information is coupled with BIM objects in the
3D model of the building. By this way the changes
in the building and the behaviour data can be tracked
and stored in relation to the 3D positions of respective
building elements and their representations in BIM.
The relation of 3D objects in BIM model and the
collected building information over time can be used
for efficient 3D visualization. We demonstrate an ex-
ample of such visualization on the web where the data
can be quickly and efficiently visualized by color cod-
ing on 3D objects (Figure 1). Such a visualization can
be especially useful for overview of building perfor-
mance and for decision making process.
In this paper the results of the ongoing research
project “SCI BIM: Scanning and data capturing for
Integrated Resources and Energy Assessment using
Building Information Modelling” are presented. The
overall aim of the project is to increase resources as
well as energy efficiency of buildings by coupling
of various digital technologies and methods. By us-
ing laser scanning and Ground Penetrating Technol-
ogy, a digital twin (BIM model) of an existing build-
ing is generated. Through gamification, the users of
the building are integrated into the process of collect-
ing data about the building and the user behavior is
tracked.
Information about building usage and about its
thermal properties over time can lead to lower costs,
efficient utilization of resources and lower ecological
footprint. Therefore, the methods for building infor-
mation acquisition and monitoring are of high impor-
tance. The presented research provides an alterna-
tive methodology to obtain information about exist-
ing building without installation of additional sensors
and therefore can contribute to increasing efficiency
of facility management. An additional benefit of our
methodology is increased awareness of users about
energy efficiency in their working place. Moreover,
the proposed method can be extended in future to en-
gage users into energy saving by influencing their be-
havior.
2 RELATED WORK
2.1 Building Monitoring
Several methodologies have been presented in past re-
search to address the problem of building information
monitoring. The most common approach is to install
monitoring devices into the building (Sayed and Gab-
bar, 2018; Zhao et al., 2013; Amaxilatis et al., 2017;
M
¨
a
¨
att
¨
a et al., 2017; Coates et al., 2017; Chen Yong-
pan et al., 2010). These methods can record vast va-
riety of data including air quality (Chen et al., 2014),
electric power usage, heating, ventilation, and air con-
ditioning (HVAC) operation, temperature, occupancy
and many others. Occupancy monitoring received
a special attention in previous research because the
GRAPP 2021 - 16th International Conference on Computer Graphics Theory and Applications
262

utilization of building and its equipment can be di-
rectly related to the presence of people. Akkaya et
al. (Akkaya et al., 2015) surveyed monitoring systems
based on internet of things (IoT) devices. Occupancy
can be also estimated in a non-intrusive way from
HVAC systems (Yang et al., 2012) or from utiliza-
tion of computer network infrastructure (Melfi et al.,
2011). Alternative methodologies for building infor-
mation monitoring include estimation from materials,
equipment data or maintenance data and interviews
with facility staff (Edirisinghe et al., 2017).
2.2 Building Information Modeling
Defined by National Institute of Building Sci-
ences (of Building Sciences, 2020), BIM is a digital
representation of physical and functional characteris-
tics of a facility. As such it serves as a shared knowl-
edge resource for information about a facility forming
a reliable basis for decisions during its lifecycle from
inception onward. Moreover BIM is “a shared dig-
ital representation of physical and functional char-
acteristics of any built object. . . ” which is created
with object-oriented software, consisting of paramet-
ric objects that represent building components (Volk
et al., 2014; ISO Central Secretariat, 2016). BIM
can stand for the model itself – Building Information
Model or for the process - Building Information Mod-
eling (L
´
evy, 2011).
2.3 BIM with Temporal Data
BIM models play an important role in the facility
management. Therefore, building monitoring data
can be coupled with BIM representation to achieve
well defined organization of data and its understand-
able visual representation. A framework for build-
ing information management based on BIM was pre-
sented by McArthur (McArthur, 2015) and Demian
and Walters (Demian and Walters, 2014). BIM with
monitoring data can be also utilized to detect failures
in the facility management (Motamedi et al., 2014).
The extension of BIM with structural sensors and col-
lected data was proposed by Rio et al. (Rio et al.,
2013). Visual programming approach for processing
big BIM data, including temporal information, was
presented by Preidel et al. (Preidel et al., 2017).
2.4 Gamification
A gamification approach for energy conservation in
buildings was proposed by Papaioannou et al. (Pa-
paioannou et al., 2017). The authors created a sys-
tem which monitors the energy utilization by spe-
cific users and provides personalized recommenda-
tions how to improve energy efficiency. Their ap-
proach also utilizes IoT devices. An augmented re-
ality game for educating children how to save energy
was proposed by Osello et al. (Osello et al., 2015).
Similarly to our research the authors used QR codes
to identify the objects. Augmented reality can also be
used as an intuitive interface to building management
systems (Jang et al., 2019). The surveys of gamifi-
cation were presented by Seaborn and Fels (Seaborn
and Fels, 2015), Hamari et al. (Hamari et al., 2014)
and Deterding et al. (Deterding et al., 2011).
3 BUILDING MONITORING BY
CROWDSOURCING
Our methodology utilizes a competitive mobile game
to monitor information about building elements. In
this game the employees of a facility compete with
each other to collect points and win the final prize.
All data about building elements need to be coupled
with BIM model of the building to ensure continuous
update. Therefore, the crucial part of the game is the
identification of objects in relation to their BIM repre-
sentations. For this purpose we use QR codes which
are printed on a paper and sticked to the elements of
the building. For the target use case in our experiment
we generated 184 QR codes. We developed an auto-
mated approach for QR code generation from BIM
model. This automated QR code generation approach
works as follows: For each element of BIM model
which should be monitored we generate an individual
QR code. The QR code is generated from json repre-
sentation which includes the identifier of object, the
type of object and verification string. The verification
string serves as a checksum of the other data to verify
authenticity of the QR code. By this way our mobile
application can identify if the QR code was generated
by our software or if it was faked. The example of
QR codes installation in a target room can be seen in
Figure 2.
Once the BIM objects can be identified in the real
building we need to monitor their states. This is done
by users who are playing our game. We used three
gamification strategies in this game:
1. Collections of points
2. Competition with colleagues
3. Advanced challenges
Collection of points motivates users to monitor
building elements by giving them certain amount of
points for each scanned element. Our system allows
a facility manager to set up various point amounts for
Building Information Monitoring via Gamification
263
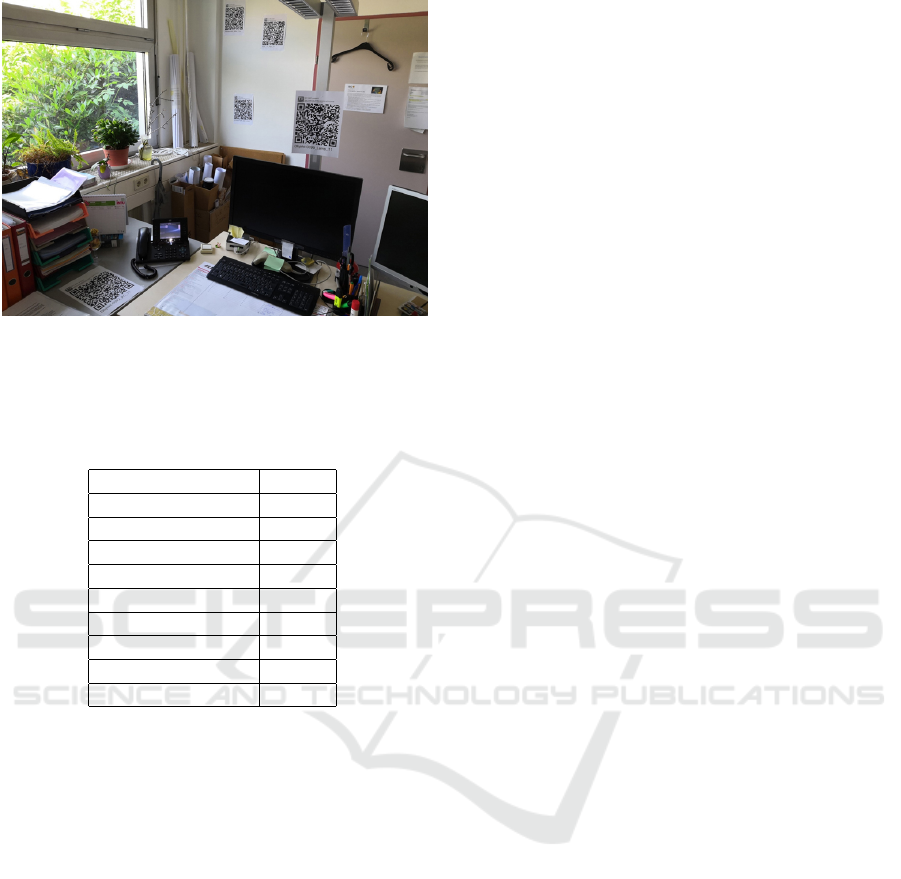
Figure 2: An office with installed QR codes for identifica-
tion of objects.
Table 1: Types of target building elements which were mon-
itored during our experiment. The right column indicates
the amount of points which a user earns when reporting the
state of the element.
Building element Points
Window 3
Door 2
Light 1
Desktop computer 1
Laptop 2
Fan 1
Air Condition 1
Printer 1
Window shade 2
different elements (Table 1). This setting can be done
on the server side and it changes the game behavior
in real time. Variable point rewards for different ele-
ments enables on-demand increase of monitoring pri-
ority for specific building elements. For example if a
heating data is of importance for facility management,
the points for scanning heater can be higher than for
scanning other elements.
Our second gamification strategy enables users to
compete with their colleagues. Additional motivation
in this strategy is the final prize which the winning
team receives. The users are grouped in the teams of
size three. Assignment to a specific team is chosen by
each user at the first login screen (Figure 3).
The third gamification strategy, advanced chal-
lenges, was added in the middle of experiment to ex-
plicitly increase the motivation of users. With ad-
vanced challenges, the users can collect additional
points by scanning multiple items in a given period.
Challenges require scanning of items of specific type
(e.g. 3 windows, 2 doors etc.) or exactly specific
items (e.g. door number 3. QR codes also contain
names and IDs of elements). Challenges can be time
limited (e.g. 3 windows in 2 minutes) or time unlim-
ited (in the whole day). Each day a user gets four
daily challenges randomly selected from the pool. In
our experiments we designed 15 challenges in total.
Every time a user reports the state of building el-
ement, the data is sent to the server. Due to the cou-
pling of QR codes with BIM object identifiers, the
BIM model can be continuously updated. As all the
data is collected on the server, the building can be
monitored in real time via web interface (Figure 1).
An important aspect of the data collection is privacy
of users. To ensure the maximum privacy the sys-
tem only collects the minimum necessary data. This
includes the ID, type and status of building element,
time stamp and nickname of the user who scanned
the element. The nickname of the user is required
to count her points on the server side. For privacy
reasons our mobile game does not store any photos,
device identifiers, location or personal information.
3.1 Temporal BIM Model
In our methodology we enhanced traditional BIM
model of the building with temporal data to enable
coupling of collected monitoring information with 3D
representation of the building. We store temporal data
in a separate file. The binding of records from this
file with building elements in BIM model and with
real objects (tagged by QR codes) is achieved by us-
ing unified building element identifiers. These identi-
fiers were created manually during the reconstruction
of BIM model. Then, they were propagated into the
QR codes generation and event reporting. The cre-
ation of our temporal BIM model, coupled with real
building, was done in three steps:
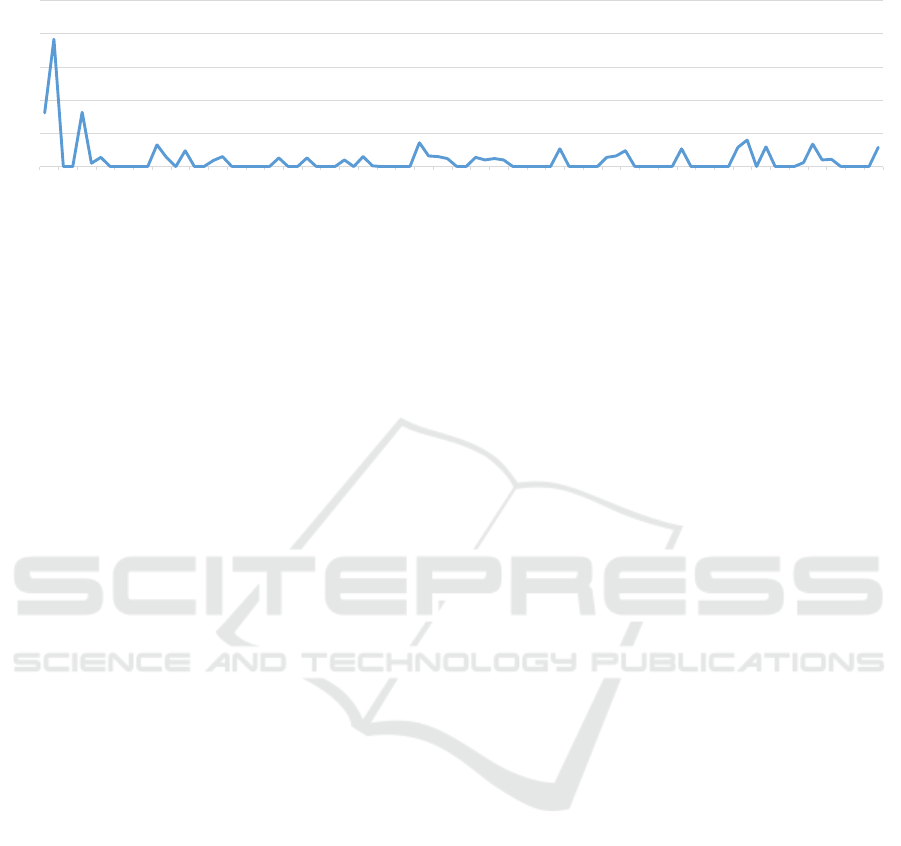
1. Manual Remodeling from Point Cloud. We ob-
tained a point cloud model of the building by laser
scanning and photogrammetry methods. Then,
the model was manually remodeled from point
cloud to create its BIM representation (Figure 4).
2. Automatic Generation of QR Codes and Their
Installation in Real Building. QR codes encode
the building element identifiers from manual re-
modeling. This way they guarantee the coupling
of real objects with BIM model.
3. Storing Temporal Events Referenced by Build-
ing Element Identifiers into External File. Each
record is stored as a separate row in this file. In
our implementation we read the object identifier
from QR code. Nevertheless, the connection be-
tween temporal data and BIM model can work
also without QR codes and even the traditional
monitoring devices can be used. Example of our
temporal data storage is show in Figure (Figure 4).
GRAPP 2021 - 16th International Conference on Computer Graphics Theory and Applications
264
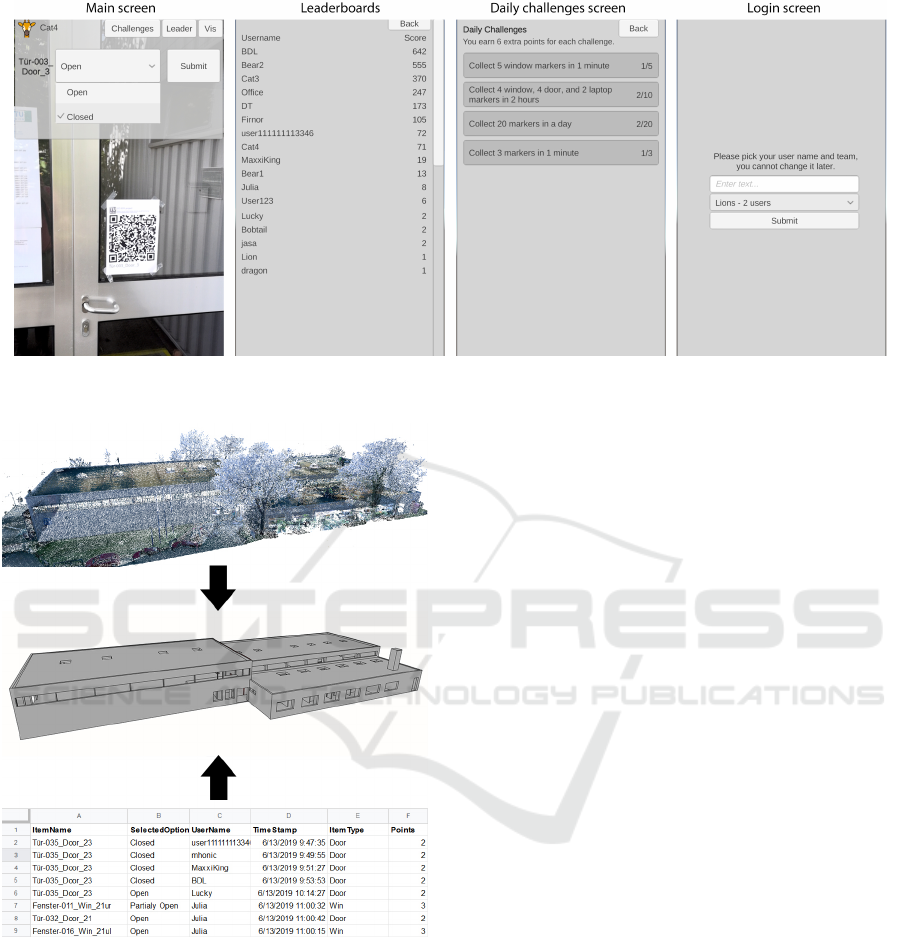
Figure 3: The screens of our mobile application for building information monitoring. Login screen is shown to the users only
once at the first run of the application. After they pick a user name, it stays the same for the rest of the game.
Figure 4: From top to bottom: Scanned point cloud from
our target use case building, BIM model which was manu-
ally remodeled from point cloud, and temporal data stored
in a spreadsheet and linked to the BIM representation. Item-
Name is the unified identifier which links the temporal data
to specific BIM objects.
3.2 Mobile Game
We developed a competitive mobile game to inves-
tigate our methodology for information monitoring.
The main screen of the game shows camera image in
real time to allow user to scan a QR code (Figure 3).
Once the QR code is decoded the mobile application
allows user to select the state of the scanned building
element. The states of various types of objects can
differ. Therefore, we store the object types and their
possible states on the server and load them each time
the application starts or resumes. Every object type
can have its own states. For example the heater can
have the values from 1 to 6 and the window can have
the states open, partially open and closed. When a
user selects the state of scanned object she can press
the submit button and send the data to the server. By
this action the user earns points for given object type.
We used Unity3D to implement our mobile game
and we built it for iOS and Android platforms. The
server side utilizes Google Sheets to store the in-
formation about building elements. The information
is transferred via Google API. Storing information
in Google Sheets enables fast processing by any 3
rd
party software, human readability and interactive vi-
sualization of data.
3.3 Visualization of Crowdsourcing
Data
In order to visualize the collected building informa-
tion we developed a web application which utilizes
WebGL. As the data is coupled with BIM representa-
tion of the building, we can visualize it in 3D. The vi-
sualization shows color coded values on the 3D BIM
model directly to the facility manager. Additionally,
the visualization is interactive and a facility manager
can see various properties mapped on the model. The
web application also contains time axis by which a
manager can control the time period of data to be vi-
sualized. In our implementation data from one week
window (starting with a selected date) are aggregated
Building Information Monitoring via Gamification
265

for visualization but this window can be set to arbi-
trary length. The web visualization always works on
the real-time data stored on the server so even new
events can be observed in real time. The screenshot
from our WebGL visualization can be seen in Fig-
ure 1.
4 USE CASE EXPERIMENT
4.1 Experiment Design
The experiment was designed to study the user per-
ception of our gamification methodology. Our main
research question was whether our gamification ap-
proach is seen by the users as equivalent or better than
traditional building monitoring with sensors in certain
aspects. We used six metrics to compare our method-
ology with traditional sensor-based approach: gen-
eral user preference, practicality, enjoyability, time
demand, privacy, and cost. These metrics were sub-
jectively reported in a final post-experiment question-
naire using two-alternative, forced-choice approach.
In this approach the users were instructed to indi-
cate their preferred method of information monitoring
amongst two options: (1) Gamification approach and
(2) monitoring sensors. After the general preference
question the users were asked to explain their choice
in an open question. In addition to the general prefer-
ence, the users indicated which method do they con-
sider more practical, more enjoyable, less time con-
suming, better in terms of privacy and better in terms
of costs. If the frequencies of user preferences for our
method are better or comparable to the preferences
for monitoring sensors from certain aspects, we might
consider our approach successful.
Additionally, we studied the motivation factor
for building information monitoring by facility users.
For this purpose we used a four-alternative, forced-
choice approach. The users were asked to indicate
which strategy was the main source of their moti-
vation amongst the following options: Collection of
points, competition with colleagues, advanced chal-
lenges, and other. Finally, we studied the usabil-
ity of our mobile application using system usability
score (SUS) (Brooke, 1996) and we also analyzed the
rate of reported states over time. The user preference
questions, motivation questions and system usability
questions were assembled into final post-experiment
questionnaire. The employees of the building who
participated in our game were asked to fill in this
questionnaire at the end of the experiment.
1
3
3
4
4
5
2
5
2
1
User preference
Practicality
More enjoyable
Less time consuming
Better privacy
Lower costs
Gamification Monitoring sensors
Figure 5: Frequencies of user answers to the preference
questions. Each row indicates the number of users who pre-
ferred our gamification approach (dark blue) and the num-
ber of users who preferred monitoring sensors (light blue)
from specific aspect.
4.2 Target Building
The target use case for our study was a university fa-
cility. The working group had 26 employees in the
time of study. 11 of them participated in our experi-
ment using their personal mobile devices. The users
monitored building information in 13 offices of the
target building. The types of monitored building el-
ements can be seen in Table 1. We did not monitor
the status of heating because the experiment was con-
ducted in summer.
4.3 Procedure
We studied the proposed gamification methodology
in a target use case building in the duration of three
months. In the preparation phase we attached our gen-
erated QR codes to the building elements. During our
experiment, traditional monitoring devices were also
installed in the building so the users could directly
compare using of these devices and our gamification
strategy. The employees, working in the use case
building, installed our mobile game on their devices.
We conducted an initial briefing workshop where we
explained how the game works, how is the data col-
lected, which traditional monitoring devices are in-
stalled and what is the purpose of the study. Then,
the competition started. At the end of the study the
users were asked to fill in the post-experiment ques-
tionnaire. The three user groups with the most col-
lected points won the final prizes in form of goodies.
5 RESULTS
Eleven participants were playing our game during the
experiment. As the participation in the experiment
was voluntary, only 5 out of 11 participants answered
GRAPP 2021 - 16th International Conference on Computer Graphics Theory and Applications
266
192
82
14
33
24
15
13 13
10
15
36
14
27
24
27
40
30
34
29
0
50
100
150
200
250
13.6.2019
15.6.2019
17.6.2019
19.6.2019
21.6.2019
23.6.2019
25.6.2019
27.6.2019
29.6.2019
1.7.2019
3.7.2019
5.7.2019
7.7.2019
9.7.2019
11.7.2019
13.7.2019
15.7.2019
17.7.2019
19.7.2019
21.7.2019
23.7.2019
25.7.2019
27.7.2019
29.7.2019
31.7.2019
2.8.2019
4.8.2019
6.8.2019
8.8.2019
10.8.2019
12.8.2019
14.8.2019
16.8.2019
18.8.2019
20.8.2019
22.8.2019
24.8.2019
26.8.2019
28.8.2019
30.8.2019
1.9.2019
3.9.2019
5.9.2019
7.9.2019
9.9.2019
Number of records per day
Figure 6: Frequencies of data reporting by our mobile application per day during the experiment. Measured values on the y
axis indicate the amount of scanned QR codes (i.e. reported items). The data labels are only show on the peak days for clarity.
the post-experiment questionnaire (2 females and 3
males, in age from 25 to 31). The users were asked
about their preference between gamification and mon-
itoring devices in terms of general judgment, practi-
cality, which one is more enjoyable, less time con-
suming, better in terms of privacy and better in terms
of costs. The resulting frequencies of user preferences
can be seen in Figure 5. In terms of general pref-
erence, the users preferred monitoring devices more
than our gamification strategy. As we analyze the spe-
cific aspects of user preferences we can see that this
preference was based on the users seeing monitoring
sensors more practical and less time consuming than
using gamification method. On the other hand, the
participants preferred our gamification strategy before
monitoring sensors in terms of enjoyability, privacy
and lower costs.
Our second research aim was to investigate which
of the used gamification strategies was the main
source of motivation. Collection of points and com-
petition with colleagues was each chosen by two dis-
tinct users as the main source of their motivation. Sur-
prisingly, the advanced challenges were not stated as
the main source of motivation by any user. Neverthe-
less, it might have motivated users but it was not per-
ceived as more motivating than collections of points
and competition with colleagues.
In order to evaluate usability of our mobile ap-
plication, we utilized SUS questionnaire (Brooke,
1996). The average system usability score, calculated
according to Brooke, was 75.5 in a range from 0 to
100 where 100 means the highest usability score.
The answers to the open question support the pref-
erence votes of participants. The users who pre-
ferred electronic sensors commented that they have
less work to do. One user, who preferred gamification
approach, explained his preference by better privacy
because the monitoring sensors allow certain level of
surveillance.
In order to further analyze the motivation of users
and usage of our mobile application, we plotted the
frequencies of data reporting onto a time axis (Fig-
ure 6). This plot shows the amount of QR codes
scanned by users per each day during the 3 months
period of experiment.
6 DISCUSSION
The main goal of our experiment was to validate the
proposed gamification strategy for building monitor-
ing in a real scenario. Eleven people used our ap-
plication during 3 months on a voluntary basis. 943
records about states of building elements were gath-
ered during this period. The distribution of report-
ing activity can be seen in Figure 6. As we can ob-
serve in this figure, some days were populated by high
activity while some others report no scanning at all.
During our experiment as well as after data analysis
we found that motivation plays a critical point in our
gamification strategy. The initial motivation was very
high, leading to the peak of 192 records per day, be-
cause all users were interested in the application and
they were eager to compete with each other. How-
ever, after one week, the number of records per day
dropped rapidly. The second version of the applica-
tion, containing advanced challenges, was released on
22.7.2019. The activity was again partially increased
after this release. There were also additional unre-
lated peaks of activity during the whole period of ex-
periment. We should note that the experiment was
conducted during the summer time while some of the
users might have been on holidays for part of the time.
Moreover, the data reporting by our mobile applica-
tion was not part of the work duties of employees. We
hypothesize that the motivation could be higher if data
collection was done by facility staff, like security and
cleaning personal, as part of their work responsibili-
ties. As our application was accepted and regularly
used by our participants, our experiment suggests that
Building Information Monitoring via Gamification
267

gamification strategy can be a valid tool for building
monitoring. However, the motivation plays an impor-
tant role in this process and the results are highly de-
pendent on human factor. During the experiment, we
also motivated participants extrinsically by the reward
for the three best user groups with the highest number
of collected points. At the end of the experiment the
winners obtained the prizes in form of goodies.
We used the post-experiment questionnaire to
compare our method with monitoring devices in terms
of user preference and to study the main source of
motivation for data collection by users. In terms of
general preference monitoring devices were preferred
more by users. The main reason for this preference
was that with monitoring devices, the users had no
additional workload for collecting the building infor-
mation. On the other hand, the gamification approach
was judged by the users as more enjoyable, with bet-
ter privacy and lower costs. From the answers to open
question and from personal discussions with users we
saw that people would like to secure their privacy.
They felt uncomfortable with having installed mon-
itoring sensors because they were afraid of unwanted
surveillance. On the other hand they trusted our mo-
bile application because we informed them during
bootstrapping meeting that we do not collect any per-
sonal data, any location information or any occupancy
information.
Based on the results from the study and frequen-
cies of data records we hypothesize that gamification
approach could serve as a complementary approach to
traditional building monitoring, especially in places
where the motivation of users could be extrinsically
increased. It could be particularly utilized in buildings
where installation of sensors is not practical, where
the amount of users is high and where the rate of data
capturing is not of highest importance.
We did not evaluate the statistical significance of
our findings because the sample size was too small to
infer any general conclusions. Instead, we see our re-
sults as user-based indications about acceptance, va-
lidity and usage of our gamification approach.
Finally, an interesting option to note is the data
collection by manual user reporting to Excel sheet or
paper. Two employees, working in the target use case,
explicitly asked for this option because they did not
have appropriate mobile device, they wanted to par-
ticipate in the data collection and they considered the
option of direct data entering as more efficient. We al-
lowed them to collect data this way during the time of
experiment. However, in contrast to their assumption
of higher efficiency, they entered only 21 records and
they reported states of building elements only three
days out of total duration of the experiment. The sam-
ple size is too small to draw any conclusions in this
case, however we hypothesize that efficiency of using
mobile application is higher than with manual report-
ing.
6.1 Limitations and Future Work
Despite the acceptance of our gamification strategy
by participants, our investigation had several limita-
tions. One of the main constraints and critical point of
the proposed methodology is the motivation of users.
As we can observe in frequencies of data reporting
per day (Figure 6), some days are not covered by
data. Therefore, the motivation would need to be in-
creased to increase frequency of scanning and thus
cover the required data rate. Both extrinsic and intrin-
sic principles can be used to increase motivation in
this case. Moreover, an important point in bootstrap-
ping the data collection is to motivate more people
to install the application and join the data collection.
In our experiment 11 out of 26 employees agreed to
participate. If this number was higher, the data rate
coverage might have been higher too. The resulting
guideline for future experiments with gamification in
building information acquisition is to invoke a strong
extrinsic motivation at the bootstrapping of the data
collection to increase the amount of participants. Ad-
ditionally, other gamification aspects can be added to
the application in the future to increase motivation.
These strategies may include levels, personalized pro-
files, special skills or new measurement features (e.g.
sound loudness measurement, illumination measure-
ment, etc.).
The main limitation of our post-experiment evalu-
ation was small amount of participants who filled the
questionnaire. Our sample size for this questionnaire
was only five people. For this reason conclusions
about statistical significance of our results could not
be drawn. In future work we aim at repeating this
study with improved version of our mobile applica-
tion, bigger user group and stronger emphasis on mo-
tivation of participants.
In this paper we did not evaluate the quality of
gathered monitoring data. In the future we plan to
compare the frequency and quality of our collected
data to sensor data. We expect this comparison to
reveal additional insights on practicality of our ap-
proach for building monitoring. We hypothesize that
more users would help to increase monitoring fre-
quency and data quality.
One of the avenues for prospective future work is
the usage of mobile application to not only collect in-
formation about the building but to also actively af-
fect the energy efficiency of the building by actions
GRAPP 2021 - 16th International Conference on Computer Graphics Theory and Applications
268

of users. For this purpose gamification can be again
used in form of collection of points for actions which
positively affect energy status (e.g. closing windows
while air condition is on). In this case the application
can provide the users with hints how their behavior
can efficiently improve their working environments.
7 CONCLUSION
In this paper we have presented a novel approach for
building information monitoring via crowdsourcing
and gamification. The core of our methodology is
the mobile application which allows employees of the
building to use their mobile devices as sensors and re-
port the information about building elements in time.
The users can then collect points for information re-
porting and compete with each other to win the prize.
We enhanced the 3D BIM model of a building with
temporal data to store the gathered monitoring infor-
mation. On top of data model in our method we built a
webGL application to visualize collected data in real
time on the 3D model. We conducted a three-months
experiment in the use case building and we evalu-
ated our gamification approach using post-experiment
questionnaire.
The findings from our experiment indicate that
while monitoring devices are preferred way for build-
ing information collection, our gamification approach
can be also accepted and valid methodology for this
task. The main benefits of our method in compari-
son to monitoring devices is higher privacy and en-
joyment factor. One of our main findings is that mo-
tivation is a critical aspect in user-oriented data col-
lection and it needs to be specifically addressed from
the very beginning of the project. A vital future uti-
lization of gamification in facility management could
be to not only passively monitor data but to actively
influence energy efficiency by user actions. As future
outlook, the proposed concept will enable the main-
tenance of digital twins throughout the life cycle of
buildings (the structural changes of building elements
are automatically adopted in the BIM model). We be-
lieve that continuation of research on this topic will
allow alternative building monitoring approaches, like
gamification, to be more practical and closer to the de-
ployment in real-world scenario.
ACKNOWLEDGEMENTS
We would like to thank the participants of our study
for their dedication in using our mobile application
for data collection and for their patience with imper-
fections in our implementation. This research was
funded by Austrian Ministry for Transport, Innova-
tion and Technology through the Austrian research
promotion agency FFG under grant no. 867314.
REFERENCES
Akkaya, K., Guvenc, I., Aygun, R., Pala, N., and Kadri,
A. (2015). Iot-based occupancy monitoring tech-
niques for energy-efficient smart buildings. In 2015
IEEE Wireless Communications and Networking Con-
ference Workshops (WCNCW), pages 58–63.
Amaxilatis, D., Akrivopoulos, O., Mylonas, G., and Chatzi-
giannakis, I. (2017). An iot-based solution for moni-
toring a fleet of educational buildings focusing on en-
ergy efficiency. Sensors, 17:2296.
Brooke, J. (1996). SUS-A quick and dirty usability scale.
Usability evaluation in industry, 189(194).
Chen, X., Zheng, Y., Chen, Y., Jin, Q., Sun, W., Chang,
E., and Ma, W.-Y. (2014). Indoor air quality monitor-
ing system for smart buildings. In Proceedings of the
2014 ACM International Joint Conference on Perva-
sive and Ubiquitous Computing, UbiComp ’14, page
471–475, New York, NY, USA. Association for Com-
puting Machinery.
Chen Yongpan, Zhang Jili, Mu Xianmin, and Ma Jinxing
(2010). Study on the theoretical framework of the in-
ternet of building energy systems. In 5th International
Conference on Computer Sciences and Convergence
Information Technology, pages 973–976.
Coates, A., Hammoudeh, M., and Holmes, K. G. (2017). In-
ternet of things for buildings monitoring: Experiences
and challenges. In Proceedings of the International
Conference on Future Networks and Distributed Sys-
tems, ICFNDS ’17, New York, NY, USA. Association
for Computing Machinery.
Demian, P. and Walters, D. (2014). The advantages of
information management through building informa-
tion modelling. Construction Management and Eco-
nomics, 32(12):1153–1165.
Deterding, S., Dixon, D., Khaled, R., and Nacke, L. (2011).
From game design elements to gamefulness: Defin-
ing “gamification”. In Proceedings of the 15th Inter-
national Academic MindTrek Conference: Envision-
ing Future Media Environments, MindTrek ’11, page
9–15, New York, NY, USA. Association for Comput-
ing Machinery.
Edirisinghe, R., London, K., Kalutara, P., and Aranda-
Mena, G. (2017). Building information modelling for
facility management: Are we there yet? Engineering,
Construction and Architectural Management, 24:00–
00.
Hamari, J., Koivisto, J., and Sarsa, H. (2014). Does gami-
fication work? – a literature review of empirical stud-
ies on gamification. In Proceedings of the 2014 47th
Hawaii International Conference on System Sciences,
HICSS ’14, page 3025–3034, USA. IEEE Computer
Society.
Building Information Monitoring via Gamification
269

ISO Central Secretariat (2016). Building information
models — Information delivery manual — Part 1:
Methodology and format. Standard ISO 29481-
1:2016, International Organization for Standardiza-
tion, Geneva, CH.
Jang, H., Choi, M., Lee, S., Lee, J., and Park, S. (2019).
Building energy management system based on mixed
reality for intuitive interface. In 2019 IEEE 2nd
International Conference on Electronics Technology
(ICET), pages 483–486.
L
´
evy, F. (2011). BIM in Small-Scale Sustainable Design.
Wiley.
McArthur, J. (2015). A building information management
(bim) framework and supporting case study for exist-
ing building operations, maintenance and sustainabil-
ity. volume 118.
Melfi, R., Rosenblum, B., Nordman, B., and Christensen,
K. (2011). Measuring building occupancy using ex-
isting network infrastructure. In 2011 International
Green Computing Conference and Workshops, pages
1–8.
Motamedi, A., Hammad, A., and Asen, Y. (2014).
Knowledge-assisted bim-based visual analytics for
failure root cause detection in facilities management.
Automation in Construction, 43:73 – 83.
M
¨
a
¨
att
¨
a, K., Rehu, J., Tanner, H., and K
¨
ans
¨
al
¨
a, K. (2017).
Building intelligence — home operating system for
smart monitoring and control. In 2017 IEEE Interna-
tional Conference on Electro Information Technology
(EIT), pages 245–248.
of Building Sciences, N. I. (2020). Nbims.
Osello, A., Del Giudice, M., Marcos Guinea, A., Rapetti,
N., Ronzino, A., Ugliotti, F., and Migliarino, L.
(2015). Augmented reality and gamification approach
within the dimmer project. In INTED2015 Proceed-
ings, 9th International Technology, Education and De-
velopment Conference, pages 2707–2714. IATED.
Papaioannou, T., Kotsopoulos, D., Bardaki, C., Lounis,
S., Dimitriou, N., Boultadakis, G., Garbi, A., and
Schoofs, A. (2017). Iot-enabled gamification for en-
ergy conservation in public buildings.
Preidel, C., Daum, S., and Borrmann, A. (2017). Data re-
trieval from building information models based on vi-
sual programming. Visualization in Engineering, 5:1–
14.
Rio, J., Ferreira, B., and Martins, J. (2013). Expansion
of IFC model with structural sensors. Informes de la
Construcci
´
on, 65:219–228.
Sayed, K. and Gabbar, H. A. (2018). Building Energy Man-
agement Systems (BEMS), chapter 2, pages 15–81.
John Wiley & Sons, Ltd.
Seaborn, K. and Fels, D. I. (2015). Gamification in the-
ory and action: A survey. International Journal of
Human-Computer Studies, 74:14 – 31.
Volk, R., Stengel, J., and Schultmann, F. (2014). Building
information modeling (BIM) for existing buildings —
literature review and future needs. Automation in Con-
struction, 38:109 – 127.
Yang, Z., Li, N., and Becerik-Gerber, B. (2012). A non-
intrusive occupancy monitoring system for demand
driven hvac operations.
Zhao, L., li Zhang, J., and bing Liang, R. (2013). Develop-
ment of an energy monitoring system for large public
buildings. Energy and Buildings, 66:41 – 48.
GRAPP 2021 - 16th International Conference on Computer Graphics Theory and Applications
270
