
Extracting Accurate Long-term Behavior Changes
from a Large Pig Dataset
Luca Bergamini
1
, Stefano Pini
1
, Alessandro Simoni
1
, Roberto Vezzani
1
, Simone Calderara
1
,
Rick B. D’Eath
2
and Robert B. Fisher
3
1
University of Modena and Reggio Emilia, Italy
2
SRUC, Edinburgh, U.K.
3
University of Edinburgh, U.K.
Keywords:
Pig Detection, Pig Tracking, Behavior Classification, Pig Farming, Long-term Temporal Analysis.
Abstract:
Visual observation of uncontrolled real-world behavior leads to noisy observations, complicated by occlu-
sions, ambiguity, variable motion rates, detection and tracking errors, slow transitions between behaviors, etc.
We show in this paper that reliable estimates of long-term trends can be extracted given enough data, even
though estimates from individual frames may be noisy. We validate this concept using a new public dataset of
approximately 20+ million daytime pig observations over 6 weeks of their main growth stage, and we provide
annotations for various tasks including 5 individual behaviors. Our pipeline chains detection, tracking and
behavior classification combining deep and shallow computer vision techniques. While individual detections
may be noisy, we show that long-term behavior changes can still be extracted reliably, and we validate these
results qualitatively on the full dataset. Eventually, starting from raw RGB video data we are able to both tell
what pigs main daily activities are, and how these change through time.
1 INTRODUCTION
Pork is the second most consumed meat (Trans-
parency Research, 2019) across the world behind
poultry, and more than 700 million (Shahbandeh,
2020) pigs were raised in 2019 alone.
Modern intensive pig farming is highly mecha-
nized, with automation of the environmental tempera-
ture and airflow, supply of feed, water and the removal
of wastes. Driven by efficiencies of scale, farms have
also grown larger, and there has been a reduction in
staff time per pig (Swan, 2020). As an example, in
the EU more than half of the pork production comes
from large intensive farms (Pol Marquer, 2020).
Behavior analysis could be used by farm staff, vets
and scientists to reveal the pigs’ state of health and
welfare, but on most farms, a typical weaner-grower-
finishing pig may only be briefly inspected once or
twice a day as part of a large group. There is an in-
creasing interest in using automated methods to moni-
tor pigs’ behavior on farm settings (Wurtz et al., 2019;
Nasirahmadi et al., 2017). Aspects of behavior such
as gait, use of different areas and resources in the pen,
social clustering, activity can all be valuable informa-
tion. Changes in behavior from the expected norm can
be used as an early warning sign for behavior prob-
lems such as tail biting (D’Eath et al., 2018), social
aggression (Chen et al., 2017), diseases (Fern
´
andez-
Carri
´
on et al., 2017), or for production issues such as
thermal comfort (Costa et al., 2014). The use of cam-
eras and various other sensor technologies in animal
agriculture – to gather useful real-time data to guide
management decisions – is often referred to as ‘pre-
cision livestock farming’ (Vranken and Berckmans,
2017).
In this work, we present a behavior analysis
pipeline built on automatic pig detection and tracking,
capable of providing a report of the changes in a set
of 5 fundamental individual behaviors (lying, moving,
eating, drinking and standing) through time.
While the same topics are of great interest in
the scientific community when applied to humans
((Spinello and Arras, 2011; Stewart et al., 2016; Ur-
tasun et al., 2006; Fleuret et al., 2007; Andriluka
et al., 2008) among many others), less research ex-
ists addressing the same tasks in the animal domain.
This may sound counter-intuitive at first, given that
for some applications, like identification and track-
ing, working with animals completely avoids any pri-
vacy and security concerns. However, there is often a
524
Bergamini, L., Pini, S., Simoni, A., Vezzani, R., Calderara, S., D’Eath, R. and Fisher, R.
Extracting Accurate Long-term Behavior Changes from a Large Pig Dataset.
DOI: 10.5220/0010288405240533
In Proceedings of the 16th International Joint Conference on Computer Vision, Imaging and Computer Graphics Theory and Applications (VISIGRAPP 2021) - Volume 5: VISAPP, pages
524-533
ISBN: 978-989-758-488-6
Copyright
c
2021 by SCITEPRESS – Science and Technology Publications, Lda. All rights reserved

Table 1: A comparison of datasets on pigs.
# Annotated Publicly
Paper # Frames frames Annotation types # Pens Acquisition time # Pigs available
(Seo et al., 2020),(Sa et al., 2019) - 3,904 boxes 1 1 day 9 7
(Br
¨
unger et al., 2020) - 1,000 ellipses 2 4 months - 7
(Zhang et al., 2019) - 22,200 boxes, IDs 1 3 days 9 7
(Mittek et al., 2017) 2,100,000 - pen boundaries, feeder, waterer 1 5 days 15 7
(Cowton et al., 2019) - 1,646 boxes, IDs 1 - 20 7
(Li et al., 2019) - 1,500 pigs’ contours 1 7 days 4 7
(Zhang et al., 2020; Li et al., 2020) 156,900 1000 (videos) 5 behaviors 3 80 days 9 7
(Psota et al., 2019) 2,000 2,000 4 body parts locations 17 multiple weeks variable 4
(Psota et al., 2020) 135,000 135,000 3 body parts locations, IDs 9 multiple weeks 7-16 4
Ours 3,429,000 7,200 boxes, IDs, 5 behaviors 1 23 days over 6 weeks 8 4
wide gap between the expertise of people working on
the techniques (computer vision and machine learn-
ing scientists mainly) and those working directly with
livestock (veterinary and biology researchers).
Recently, thanks to the democratization of com-
puter vision and deep learning, numerous works
have been presented for livestock and wildlife detec-
tion (Spampinato et al., 2008; Norouzzadeh et al.,
2018; Seo et al., 2020; Sa et al., 2019; Psota et al.,
2019), tracking (Underwood et al., 2013; Zhang et al.,
2019; Mittek et al., 2017), identification (Bergamini
et al., 2018; Liu et al., 2019a; Liu et al., 2019b), lesion
analysis (Bergamini et al., 2019; Trachtman et al.,
2020) and also behavior analysis (Tscharke and Ban-
hazi, 2016; Cowton et al., 2019; Li et al., 2019; Zhang
et al., 2020; Li et al., 2020). Although techniques are
now available, the increasing usage of deep convolu-
tional neural networks has seen the demand for high
quality annotated data soaring.
To this end, a contribution of this paper is also an
unrestricted public pigs dataset, providing both man-
ual and automatic annotation for multiple tasks, in-
cluding detection, tracking, identification and behav-
ior analysis.
In summary, the main contributions of our work
are:
• A behavior analysis pipeline that focuses on indi-
vidual pig behaviors to infer statistics about 5 dif-
ferent individual behaviors and how these change
through time;
• Evidence that the behavior statistics at the aggre-
gated week level are reliable and robust to error in
the various steps of the pipeline;
• A public available dataset comprising 7200 fully
annotated frames.
In the following, we present an overview of re-
lated works in Sec 2, with emphasis on public avail-
able swine solutions, and a description of the pig
dataset in Sec 3. We then describe the detection-
tracking-behavior pipeline in Sec 4 and we employ it
to output statistical information about the pig behav-
iors over the full dataset that we discuss in Sec 5.
2 RELATED WORK
We present here an overview of the swine literature.
We purposely decide not to categorize related works
by their specific processes (e.g. tracking) because of-
ten tasks are approached in a sequential fashion by
the same work (e.g. both detection and tracking can
be performed for individual pig behavior analysis).
In (Seo et al., 2020) a TinyYOLO (Redmon et al.,
2016) architecture is employed to detect pigs from
infrared videos. Much focus is placed on execu-
tion speed, as the target platform is an embedded
device. Images are acquired from a single pen and
the training set includes 2904 images, while the test
comprises 1000 images. The authors also approach
the same task using traditional computer vision algo-
rithms in (Sa et al., 2019). They propose a method to
detect pigs under various illumination conditions by
combining information from depth and infrared im-
ages, using spatio-temporal interpolation.
(Psota et al., 2019) take another approach and cast
detection as a segmentation task. The targets are not
bounding boxes anymore but instead 4 semantic parts
of the animal (ears, shoulder and tail) which are de-
tected using a Fully Convolutional Network. The
Hungarian algorithm is then employed to link those
parts for each individual pig. A dataset with 2000 im-
ages from multiple pens is publicly available online.
The authors extend their work in (Psota et al., 2020),
where they focus on tracking by leveraging the fixed
cardinality of the targets. Their tracker achieves real-
time performance and is based on features extracted
from a CNN. Also the dataset of this work is publicly
available.
Similarly, in (Br
¨
unger et al., 2020) the bounding
boxes are replaced with ellipses, which are detected
Extracting Accurate Long-term Behavior Changes from a Large Pig Dataset
525
through a segmentation network. The intuition is that
pigs are much closer to an ellipse in terms of shape
when images are acquired from above. The dataset
includes 1000 images recorded over a period of 20
days. 13 pigs from a single pen were recorded. An
encoder-decoder architecture is trained with multiple
losses to segment individual instances, using the no-
tion of outer and inner edge of the animal.
In (Zhang et al., 2019) a Single Shot Detector (Liu
et al., 2016) architecture is used to perform detec-
tion. A tag-box is then extracted from each detected
animal to perform tracking using a variation of the
MOSSE (Bolme et al., 2010) tracking algorithm. The
dataset includes multiple pens and has been acquired
over a period of 3 days. In total, 18000 images have
been collected and annotated for the training set and
4200 for the test set.
(Mittek et al., 2017) leverage the depth signal
from a Microsoft Kinect to fit 3D ellipses in an un-
supervised fashion. The pen boundaries need to be
annotated only once to define the working area of the
following algorithm. Information from surface nor-
mals is employed to detect the boundaries between
the pigs when these are very close. The dataset in-
cludes 2.1M frames from 5 consecutive days of a pen
with 15 pigs.
In (Cowton et al., 2019) detection, tracking and
behavior analysis of individual pigs is performed.
First, R-CNN (Girshick et al., 2014) is used to de-
tect bounding boxes, that are then input into two real-
time tracker algorithms. Transfer learning is required
to accommodate the covariate shift from a traditional
deep learning dataset. Then, idle and moving behav-
iors are detected from tracklets. The dataset includes
1646 annotated images, which are split with 0.5 ratio
between the training and test sets.
(Li et al., 2019) focus their attention on the mount-
ing behavior only, which is identified as a cause
of epidermal wounds and fractures. They collect a
dataset from a week of acquisitions of a single pen
with 4 young male pigs. 1500 frames are annotated
with segmentation masks and mounting/no-mounting
behavior flag. Then, a Mask R-CNN (He et al., 2017)
is employed to detect and segment individual pigs. Fi-
nally, a multi-dimensional eigenvector is computed
from the detected bounding-box and segmentation
and classified into the two possible behaviors.
Differently, in (Zhang et al., 2020; Li et al., 2020)
the behavior analysis is rephrased as an end-to-end
video classification task. A dataset (PBVD-5) of 1000
short clips is collected and annotated with one out
of five different behaviors (feeding, lying, walking,
scratching and mounting), with 200 videos for each
behavior. Data comes from 4 pens with up to 3 pigs in
each. Then, in (Zhang et al., 2020) a two streams ar-
chitecture employs both RGB and optical flow infor-
mation to classify snippets and individual frames, and
the results are fused using a consensus function. The
authors compare the performance of various architec-
ture, including ResNet (He et al., 2016) and Incep-
tion (Szegedy et al., 2015) networks, as backbones.
To summarize, multiple works that tackle detec-
tion, tracking and behavior analysis of pigs exist.
However, their focus is on the techniques only, while
a thorough analysis of the application of those tech-
niques on a wide dataset and the reliability of the
computed statistics is still missing. In the following,
we show that a combination of well established algo-
rithms for the above mentioned tasks, even with their
intrinsic limits due to the challenging setting, can be
reliably employed to draw accurate long-term behav-
ior changes statistics.
3 DATASET
The dataset was collected between 5 Nov and 11 Dec
(2019, 6 weeks) in a single pigpen (5.8m x 1.9m)
with 8 growing pigs at SRUC’s research pig unit (near
Edinburgh, UK). The pigs were mixed intact males
and females weighing around 30kg at the start of the
study. They were given a 3-space feeder with ad li-
bitum commercial pig feed, two nipple water drinkers
and a plastic enrichment device (Porcichew, East Rid-
ing Farm Services Ltd, Yorkshire, UK) suspended at
pig height from a chain. Pigs were also given straw
and shredded paper on a part-slatted floor. Color im-
age and depth data was collected using an Intel Re-
alSense D435i camera positioned at 2.5 meters from
the ground. Both RGB and depth information were
acquired at 6fps with a resolution of 1280 × 720, and
the acquisition was limited to daytime (from 7AM
to 7PM), due to the absence of artificial light during
nighttime.
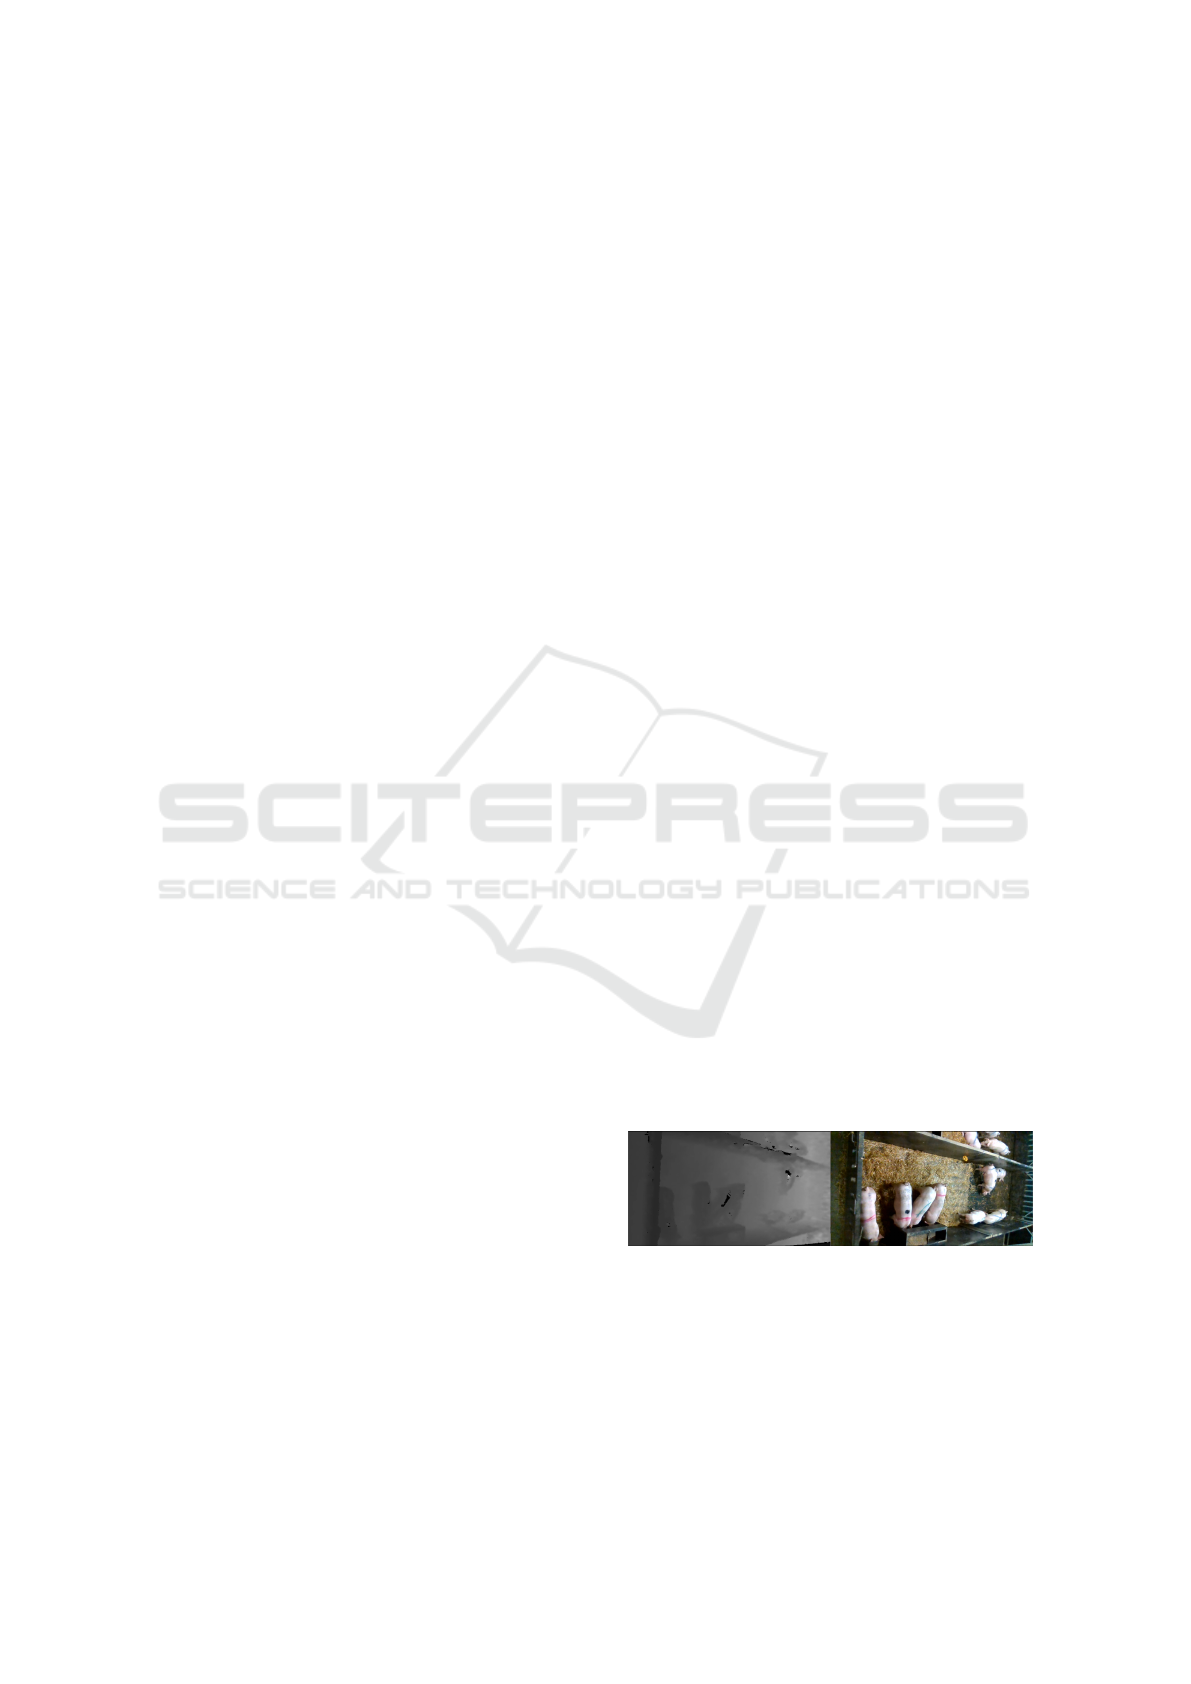
Figure 1: An example of depth and RGB data for the same
frame. The depth data has several artifacts. One of the pigs
in front of the feeder has a wide (black) spot with value zero,
while one in the rear has both zero and out of distribution
(white patch) areas.
The acquired frames were appended into video se-
quences of fixed size (1800 frames each correspond-
ing to 5 minutes) for both compression efficiency and
VISAPP 2021 - 16th International Conference on Computer Vision Theory and Applications
526

logical organization of the data. Figure 1 shows an
example of RGB and depth information for the same
frame. It is worth noting how the depth signal proved
to be almost completely unreliable due to the presence
of heavy non-white noise. Using it as an additional
signal in our algorithms not only did not increase per-
formance, but it even hinders it in several trials.
We acquired a total of 3,429,000 frames. To-
gether with the raw data, we also provide manual
annotations for different tasks for a subset (12 se-
quence corresponding to 7200 frames spread over the
6 weeks) of the dataset. These annotations were man-
ually generated by 4 different people using a cus-
tom version of VaticJS (Bolkensteyn, 2016) avail-
able at https://github.com/stefanopini/vatic.js. In each
frame, the annotator:
• Draws a rectangular bounding box around each
visible pig;
• Associates each bounding box with one of the 8
pigs using a numeric identifier;
• Selects a behavior among a list of 5 options (lie,
move, eat, drink and stand).
The 12 sequences were annotated and split be-
tween training and validation to cover the entire time
window of the acquisition process. This guaran-
tees that the quality of the supervised algorithms em-
ployed in the rest of this work is representative of the
full dataset.
Table 1 reports statistics for our dataset and com-
pares it with others already published by the scien-
tific community (both publicly and not). Although a
bigger dataset (Psota et al., 2020) is publicly avail-
able, it only includes 3 key-points and IDs annota-
tions. Contrarily, ours provides annotations for de-
tection, tracking and behavior analysis. The dataset
can be accessed at https://aimagelab.ing.unimore.it/
go/pigs-behaviours.
4 BEHAVIOR ANALYSIS
PIPELINE
Although the main focus of this work is understand-
ing individual pig behaviors, several steps are re-
quired to fill the gap between raw data and behav-
iors. First, pigs need to be individually detected in
each frame. The position information alone is already
enough to identify behaviors that do not require tem-
poral knowledge, such as eating or drinking. How-
ever, as other behaviors require multiple detections of
the same pig in consecutive frames (e.g. moving or
standing), we use tracking to associate the bounding
boxes from consecutive frames into tracklets. A sum-
mary of the employed techniques for detection and
tracking is given before focusing on behavior analy-
sis. For both tasks we report supervised metrics on
the annotated evaluation set.
4.1 Detection
Pig detection is treated as a supervised computer vi-
sion task, powered by the ground truth annotations.
A state-of-the-art deep convolutional neural network
is used for multiple object detection, namely YOLO
v3 (Redmon and Farhadi, 2018). We pre-train it on
the ImageNet dataset (Deng et al., 2009) and fine tune
it for pig detection by replacing the classification grid
layer to predict only 2 classes (background and pig).
Because the original dataset contains chiefly portrait
pictures, we replaced the network anchors with a new
set computed on our training set bounding boxes. Fur-
thermore, since the camera depicts also parts of other
pigs’ pens, we apply a mask on the video frames with
the shape of the pen area containing the 8 pigs that
we want to track. We set a threshold on the network’s
confidence scores and we also apply non-maximum
suppression using a threshold on the IoU between pre-
dicted boxes. We experimented with those two hyper-
parameters but found that the default values (0.9 and
0.4 respectively) in practice worked well for the task.
However, we include the a-priori knowledge of hav-
ing a limited known number of entities we want to
detect. As such, we always take up to 8 bounding
boxes.
Table 2: Metrics from the detector on the validation set. We
report results for individual sequences as well as those from
the whole validation set.
Validation
sequence AP (%) TP (%) FP (%) Missed (%)
A 84.63% 89.18% 10.82% 1.16%
B 97.28% 99.59% 0.41% 2.24%
C 100.00% 100.00% 0.00% 0.00%
D 95.75% 96.97% 3.03% 0.85%
E 98.38% 99.45% 0.55% 1.03%
Whole set 95.21% 97.04% 2.96% 1.06%
Table 2 shows results in terms of Average Preci-
sion (AP), number of true positives (TP), false posi-
tives (FP) and missed detections on the validation set.
We report statistics for the individual sequences and
the average on the full validation set.
The reported detection metrics are satisfactory.
Figure 2 shows some detection failure cases from the
validation set. Failures are mainly due to two reasons.
First, differently from humans, pigs stay extremely
close together most of the time, either while sleeping
Extracting Accurate Long-term Behavior Changes from a Large Pig Dataset
527
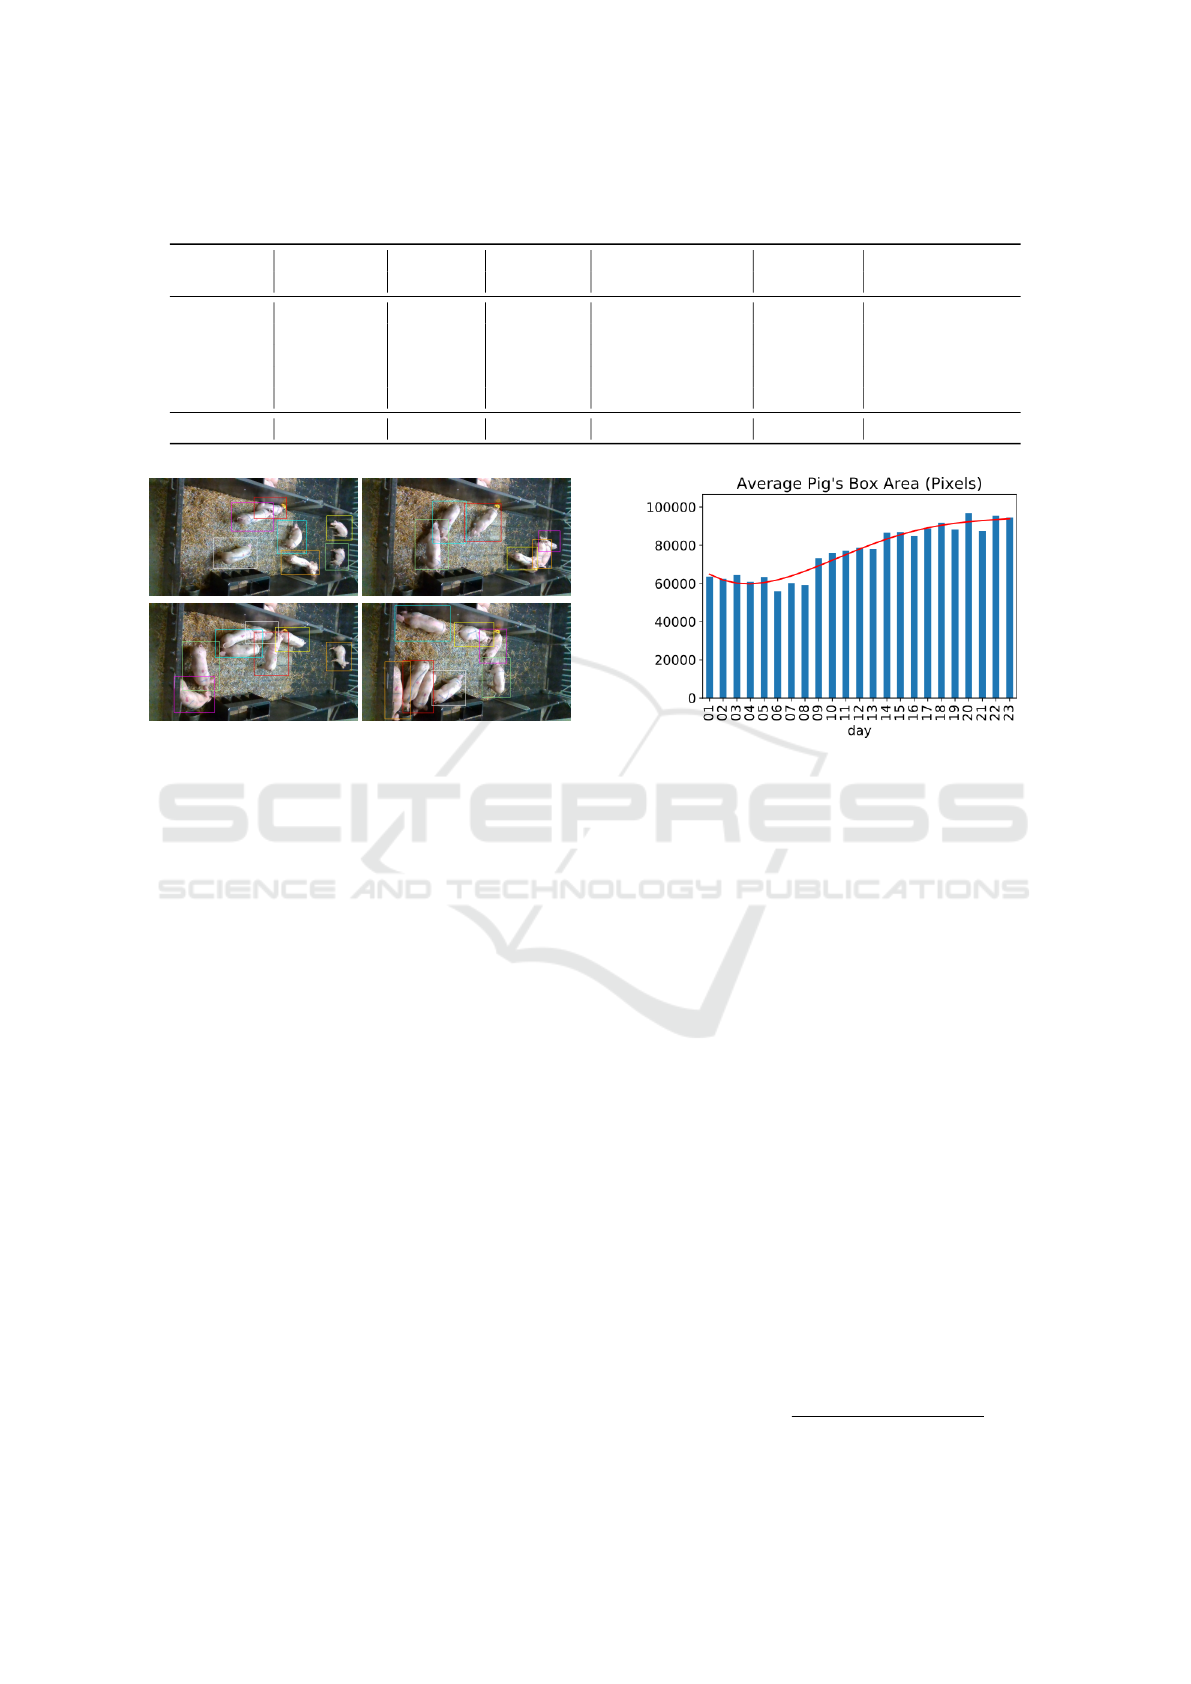
Table 3: Metrics from the tracker on the validation set. We report results for individual sequences as well as those from the
whole validation set.
Validation Avg. tracklet
sequence MOTA (%) IDF
1
(%) # Switches # Fragmentations # Tracklets length (# frames)
A 76.78% 55.10% 23 187 24 597
B 97.35% 88.39% 12 13 17 834
C 100% 100.00% 0 0 8 1800
D 92.97% 88.46% 9 43 24 597
E 97.92% 78.29% 12 18 13 1104
Whole set 93.00% 82.05% 11.2 52.2 17.2 986.4
Figure 2: Examples of detection failures. A bounding box
contains more than a single pig when the pigs are too close
(e.g. red bounding box in bottom-right figure). Moreover,
even when two separate bounding boxes are successfully
generated for close pigs, they sometimes include portions of
the other animal (e.g cyan bounding box in top-right figure).
(usually on top of each other), fighting or just stand-
ing. In these conditions, it becomes extremely likely
to have more than one pig per cell in the classification
layer. Second, bounding box annotations become less
reliable when pigs cannot be contained individually
by an axis-aligned rectangle.
These two factors pose a great challenge to algo-
rithms designed for detecting humans. While other
works use better fitting annotations that partially solve
these issues (like ellipses in (Br
¨
unger et al., 2020)),
these require custom algorithms to be handled and
are more expensive to annotate compared to bound-
ing boxes.
Although detection of single instances may be
noisy, the amount of available data greatly reduces
the noise influence. For example, we report in Fig. 3
the detected bounding box area on the full unlabeled
dataset averaged by day and pig. It can be observed
how the area increases monotonically (by around 45%
throughout the entire acquisition window) which is
expected when ad libitum food is available and only
reduced activity can be performed due to space con-
straints. The 45% correlates well with the predicted
increase in observed area of 67% based on (W
a fter
=
Figure 3: Changes of the estimated bounding box mean area
on the full dataset through the acquisition days.
65kgs/W
be f ore
= 30kgs)
2/3
, assuming that weight is
proportional to volume.
4.2 Tracking
For tracking the pigs, we employ a simple yet effec-
tive tracking-by-detection algorithm (Pini et al., 2019)
that groups into tracklets consecutive detections of the
same pig. In practice, for each new detection a new
tracker is created and initialized. In the following
frames, updated trackers and single-frame detections
are matched together comparing the Intersection over
Union and their appearance and finding the best as-
signments with the Kuhn-Munkres algorithm (Kuhn,
1955). If a detection is not matched to any tracker, a
new one is initialized while, if a tracker is not matched
to a detection for 8 frames, the tracker is removed. As
tracker, we employ the MOSSE (Bolme et al., 2010)
algorithm.
We evaluate the quality of the tracking algorithm
using the following metrics:
• Multiple Object Tracking Accuracy (MOTA)
(Bernardin and Stiefelhagen, 2008; Milan et al.,
2016) combining three sources of errors as:
MOTA = 1 −
∑
t
(FN
t
+ FP
t
+ IDSW
t
)
∑
t
GT
t
(1)
VISAPP 2021 - 16th International Conference on Computer Vision Theory and Applications
528

Figure 4: Confusion matrix for the 5 behaviors on the validation set (left). Distributions of the GT and predicted behaviors on
the validation set (right).
where FN is a tracker hypothesis which is
wrongly not generated, FP is a tracker hypothesis
generated where there is none in the ground truth,
IDSW is a mismatch between the current and pre-
vious association and GT is the number of ground
truth objects;
• Identification F
1
(IDF
1
) score (Ristani et al.,
2016) representing the ratio of correctly identi-
fied detections over the average number of ground
truth and computed detections:
IDF
1
=
2IDTP
2IDTP + IDFP +IDFN
(2)
which differs from the MOTA as it performs a
1-to-1 mapping between IDs, without consider-
ing identity switches or fragmentations of the pre-
dicted trajectories;
• Number of identity switches, occurring when the
tracker jumps from one identity to another;
• Number of fragmentations, accounting for track-
let switches between missed and not missed
states.
• Average tracklet length, which summarizes the
tracker effectiveness in following the pigs through
the sequence (a perfect result would be 8 tracks,
each with 1800 frames).
Table 3 reports the results on the validation set.
While there is some variance between sequences,
most of the pigs are tracked for long periods, they
are rarely swapped and few false positives occur. In
particular, the average tracklet length is more than
half a sequence (i.e. more than 2.5 minutes) and the
per-sequence number of switches between two pigs is
only 11 (i.e. on average, each pig track switches about
1.5 times).
4.3 Behavior Analysis
Behavior analysis uses the detections and tracklets
identified by the algorithms from Sec 4.1 and Sec 4.2
to predict a behavior class for each pig in every frame.
While it is possible to directly predict the behavior
along with the pig detection, a single-frame approach
like the one employed in Sec 4.1 would struggle to
correctly identify behaviors that depend on multiple
frames, such as moving or standing. Here, a combina-
tion of deep learning based and traditional techniques
is used to better fit the different natures of the behav-
iors of interest.
The first step computes the average movement of
the pig, as the movement of bounding box centroid
locations in a given time-frame. The average depth
inside the bounding box is used to predict the aver-
age pig movement in centimeters and compared to a
fixed threshold in the same unit. In this way a single
threshold can be applied to pigs in any part of the pen.
We use a threshold of 2.5 cm over the center of mass
movement in a 2 seconds window and show that it is
enough to sufficiently discriminate between unmov-
ing and moving behaviors.
When the initial decision yields unmoving, we
identify whether a pig is feeding or drinking by its dis-
tance and orientation from the feeder or the drinkers.
Because we have collected our data from a single pen,
the positions of those items is known. However, be-
cause the annotated bounding boxes do not hold any
orientation information, identifying the pig orienta-
tion is not trivial. In practice, we compute the gray-
scale image moments (Ming-Kuei Hu, 1962) on each
bounding box and extract the pig center of mass and
angle from a combination of the first and second or-
der central moments, under the hypothesis of having
ellipse-shaped entities, which is a good assumption
for pigs (Br
¨
unger et al., 2020). It is worth noting how
this approach cannot disambiguate between 2 angles
Extracting Accurate Long-term Behavior Changes from a Large Pig Dataset
529
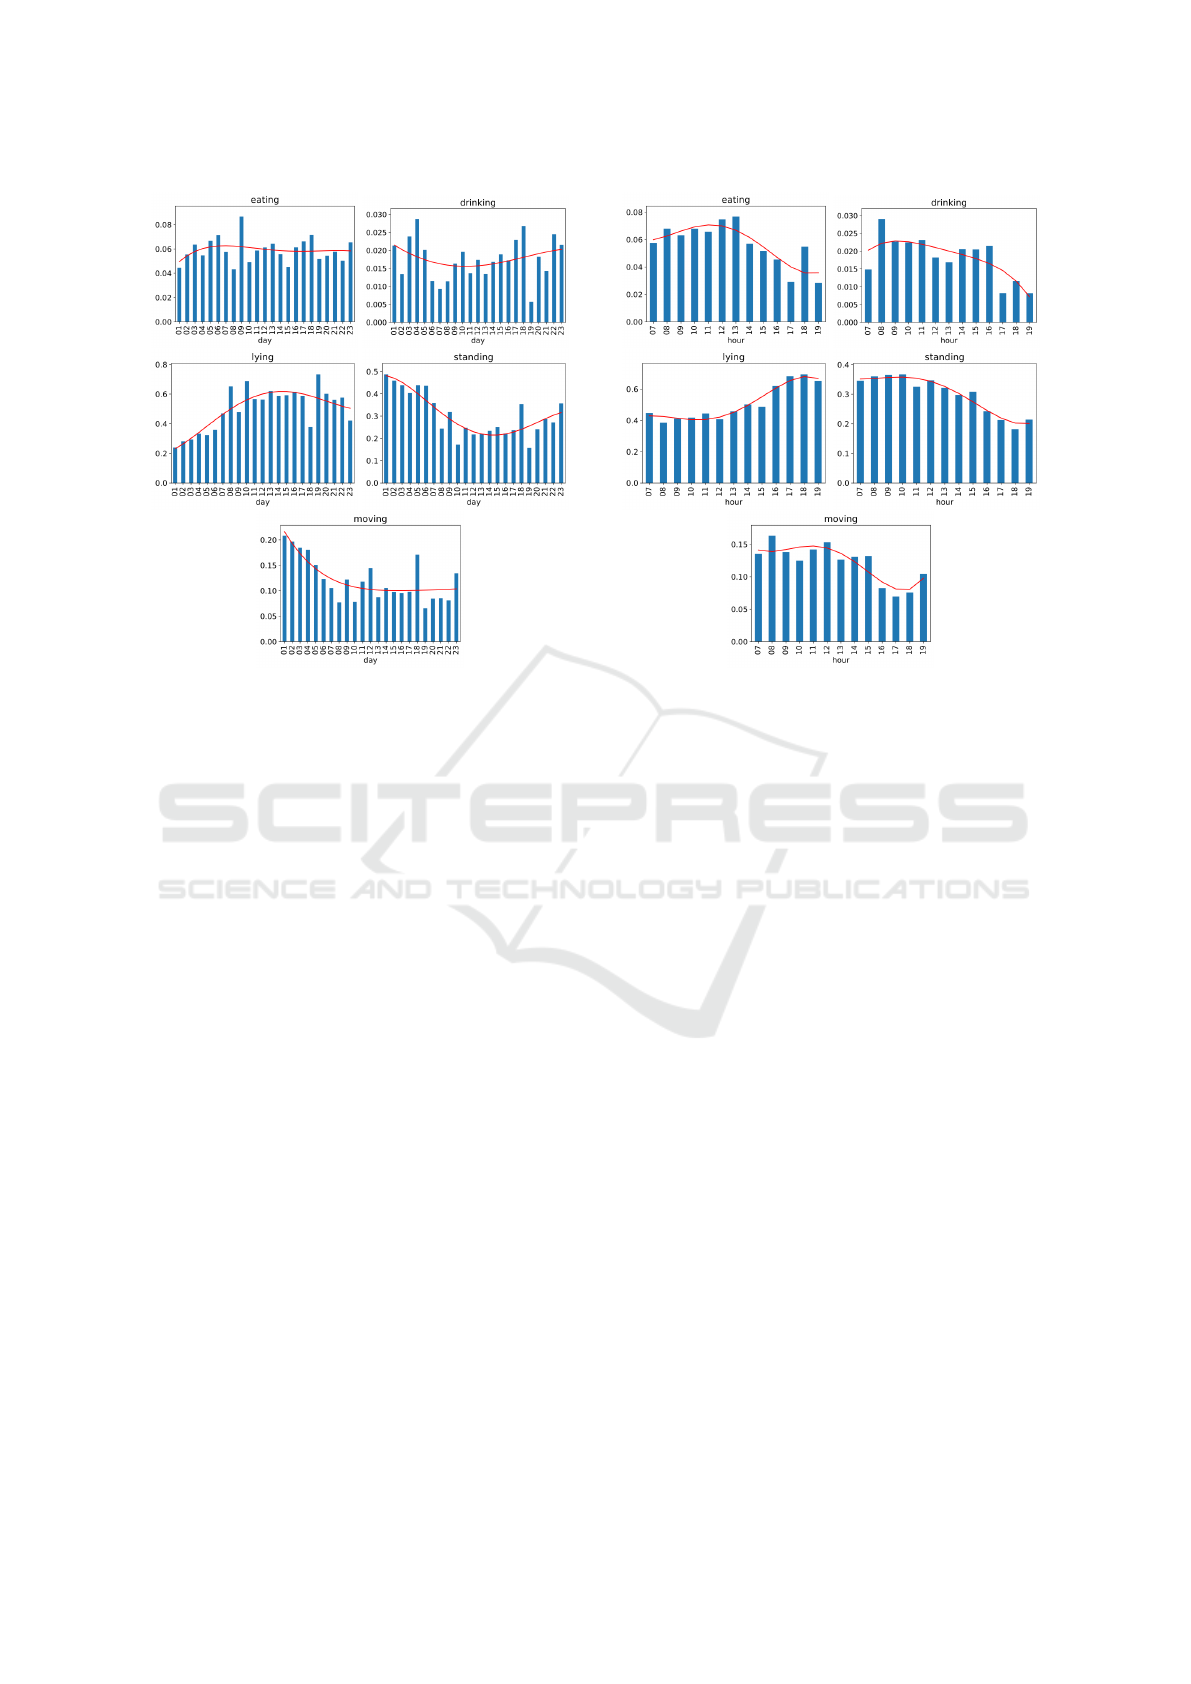
Figure 5: Temporal graphs of the behavior changes aggre-
gated by day on the full dataset. The red solid line shows an
interpolation of the data.
spanned by π like a pig facing or giving its back to
the feeder. In practice, we notice the latter happens
very rarely, as other pigs are likely to step in to feed
frequently.
The remaining behaviors consist of lying and
standing. These actions do not depend on specific
locations in the pen, and the appearance of the pig
must be taken into consideration for choosing be-
tween them. Our first approach made use of the depth
information but proved unreliable (see Sec 3). There-
fore, a deep-learning method based on ResNet18 (He
et al., 2016) is used to classify the bounding box into
one of the classes of interest. The network is trained
on the training split from Sec 4.1 and validated on
the validation split. We compensate for class imbal-
ance by inverse weighting during training (i.e. sam-
ples from the most common classes are weighted less
than samples from the uncommon classes).
We report results in terms of accuracy on the val-
idation set for the five behaviors in Fig. 4 (left). It is
likely that more sophisticated, generic, and accurate
behavior classification methods exist, but we reiter-
ate one claim of the paper: the collective behavior
statistics are accurate, even though individual frame-
level labels may not always be as accurate (about
73% accurate on average over the unbalanced vali-
dation set, of which about 75% of the frames were
either standing or lying). To support this claim, we re-
port in Fig. 4 (right) two distribution histograms (for
Figure 6: Temporal graphs of the behavior changes aggre-
gated by hour on the full dataset. The red solid line shows
an interpolation of the data.
the ground-truth and the predicted behaviors, again
on the validation set). It can be observed that these
two distributions are very similar, with a KL diver-
gence value of 0.014. As another measure of qual-
ity, we compute the average global prediction error
∑
i
| GT
i
− Pred
i
| /
∑
i
GT
i
= 0.14, which shows that
the individual errors tend to cancel out to give more
accurate collective statistics.
5 DISCUSSION
We report in this section our observations on the full
unlabeled dataset, after applying our pipeline for be-
havior understanding. We aggregate the results for the
predicted behaviors by days (Fig. 5) and by daytime
hours (Fig. 6). The statistics are computed over ap-
proximately 27 million pig detections, which means
approximately 1 million detections per day in Fig. 5
and 2 million detections per time of day in Fig. 6.
From the former we draw the following conclusions:
• Eating and drinking behaviors do not vary drasti-
cally during the observation period. This matches
the ad libitum availability of food and water that
the animals were provided with. These two ac-
tions are performed for a total of around 10% of
the whole time. For drinking, the indoor venti-
lated setting reduces the need of water;
VISAPP 2021 - 16th International Conference on Computer Vision Theory and Applications
530

Figure 7: Heatmaps for 3 out of the 5 behaviors, computed from the bounding boxes detected on the full dataset. We omit
eating and drinking as those behaviors are directly identified using the bounding box location. Best viewed in color.
• Moving, standing and lying follow a mirrored
pattern. While the first two decrease through time,
the latter drastically increases. This matches the
expected behavioral pattern of growing pigs in a
new environment. The first days are character-
ized by high levels of activity. This is due to var-
ious factors, including the pigs’ youth, being in a
new environment, the presence of other pigs and
not being used to daily inspections among others.
After these first days, they rapidly adapt to the
new situation while at the same time they begin
to grow more quickly (see Fig. 3). This eventu-
ally results in pigs spending most of the time lying
and/or sleeping.
On the other hand, the analysis over the daytime
highlights how pigs in these conditions (indoor, arti-
ficial light only) are mainly diurnal, where activities
(moving, eating and drinking) are performed inten-
sively during the morning and early afternoon and the
animals are less active during the late afternoon.
We also visualize the heatmaps for 3 of the 5 be-
haviors in Fig. 7. These are computed by plotting the
centroid of the detected bounding boxes for a single
behavior over the 6 weeks period. It is worth noting:
• Lying rarely occurs in front of the feeder. This is
because pigs keep alternating to eat, making the
area crowded. The areas where lying occurs more
often are in fact those along the edges, but not at
the very far right end where much toilet behavior
occurs due to the slated floor.
• Standing is more spread around, with a prefer-
ence for the left part of the pen;
• Moving is focused in two areas mainly. The first
one is the right section of the pen. This is where
pigs usually run when operators move along the
aisle near the left edge of the pen and it’s also
the area deemed as toilet. The second area is in
front of the feeder, as pigs move here to access
and leave the feeder itself.
6 CONCLUSIONS
We presented here a detection-tracking-behavior
pipeline for long-term behavior changes of individ-
ual pigs in an indoor pen. This analysis is powered
by our new large pig dataset which includes annota-
tions for various tasks, and which we will publicly
release with no restrictions. The conclusions drawn
from the aggregated data match the expectations of
experts, and justify our claim that collective behavior
statistics are accurate, even though individual frame-
level labels may not always be as accurate. This is
valid not only for actions performed frequently (e.g.
lying), but also for those occurring less often (e.g. eat-
ing or drinking).
Future improvements can be envisioned for this
challenging task. On the one hand, single components
(e.g. the detection algorithm) could be specialized for
the setting. On the other hand, given that the errors in
the different stages of the pipeline compound, a single
end-to-end method for detection-tracking-behavior is
also a possible future outcome. The detection ground-
truth could be refined to use ellipses instead of axis-
aligned bounding boxes. Another direction for exten-
sions is increasing the number or breakdown of the
behavior classifications.
ACKNOWLEDGEMENTS
Our thanks are due to SRUC technician Mhairi Jack,
and farm staff Peter Finnie and Phil O’Neill. SRUC’s
contribution to this work was funded by the Rural and
Environment Science and Analytical Services Divi-
sion of the Scottish Government.
REFERENCES
Andriluka, M., Roth, S., and Schiele, B. (2008).
People-tracking-by-detection and people-detection-
Extracting Accurate Long-term Behavior Changes from a Large Pig Dataset
531

by-tracking. In 2008 IEEE Conference on computer
vision and pattern recognition, pages 1–8. IEEE.
Bergamini, L., Porrello, A., Dondona, A. C., Del Negro, E.,
Mattioli, M., D’alterio, N., and Calderara, S. (2018).
Multi-views embedding for cattle re-identification. In
2018 14th International Conference on Signal-Image
Technology & Internet-Based Systems (SITIS), pages
184–191. IEEE.
Bergamini, L., Trachtman, A. R., Palazzi, A., Negro,
E. D., Capobianco Dondona, A., Marruchella, G., and
Calderara, S. (2019). Segmentation guided scoring
of pathological lesions in swine through cnns. In
New Trends in Image Analysis and Processing - ICIAP
2019 - ICIAP International Workshops, pages 352–
360. Springer.
Bernardin, K. and Stiefelhagen, R. (2008). Evaluating mul-
tiple object tracking performance: the clear mot met-
rics. EURASIP Journal on Image and Video Process-
ing, 2008:1–10.
Bolkensteyn, D. (2016). Vaticjs. https://github.com/
dbolkensteyn/vatic.js.
Bolme, D. S., Beveridge, J. R., Draper, B. A., and Lui, Y. M.
(2010). Visual object tracking using adaptive corre-
lation filters. In 2010 IEEE computer society con-
ference on computer vision and pattern recognition,
pages 2544–2550. IEEE.
Br
¨
unger, J., Gentz, M., Traulsen, I., and Koch, R. (2020).
Panoptic instance segmentation on pigs. arXiv
preprint arXiv:2005.10499.
Chen, C., Zhu, W., Ma, C., Guo, Y., Huang, W., and
Ruan, C. (2017). Image motion feature extraction
for recognition of aggressive behaviors among group-
housed pigs. Computers and Electronics in Agricul-
ture, 142:380–387.
Costa, A., Ismayilova, G., Borgonovo, F., Viazzi, S., Berck-
mans, D., and Guarino, M. (2014). Image-processing
technique to measure pig activity in response to cli-
matic variation in a pig barn. Animal Production Sci-
ence, 54(8):1075–1083.
Cowton, J., Kyriazakis, I., and Bacardit, J. (2019). Au-
tomated individual pig localisation, tracking and be-
haviour metric extraction using deep learning. IEEE
Access, 7:108049–108060.
D’Eath, R. B., Jack, M., Futro, A., Talbot, D., Zhu, Q., Bar-
clay, D., and Baxter, E. M. (2018). Automatic early
warning of tail biting in pigs: 3d cameras can detect
lowered tail posture before an outbreak. PloS one,
13(4):e0194524.
Deng, J., Dong, W., Socher, R., Li, L.-J., Li, K., and Fei-
Fei, L. (2009). Imagenet: A large-scale hierarchical
image database. In 2009 IEEE conference on com-
puter vision and pattern recognition, pages 248–255.
Ieee.
Fern
´
andez-Carri
´
on, E., Mart
´
ınez-Avil
´
es, M., Ivorra, B.,
Mart
´
ınez-L
´
opez, B., Ramos,
´
A. M., and S
´
anchez-
Vizca
´
ıno, J. M. (2017). Motion-based video monitor-
ing for early detection of livestock diseases: The case
of african swine fever. PloS one, 12(9):e0183793.
Fleuret, F., Berclaz, J., Lengagne, R., and Fua, P. (2007).
Multicamera people tracking with a probabilistic oc-
cupancy map. IEEE transactions on pattern analysis
and machine intelligence, 30(2):267–282.
Girshick, R., Donahue, J., Darrell, T., and Malik, J. (2014).
Rich feature hierarchies for accurate object detec-
tion and semantic segmentation. In Proceedings of
the IEEE conference on computer vision and pattern
recognition, pages 580–587.
He, K., Gkioxari, G., Doll
´
ar, P., and Girshick, R. (2017).
Mask r-cnn. In Proceedings of the IEEE international
conference on computer vision, pages 2961–2969.
He, K., Zhang, X., Ren, S., and Sun, J. (2016). Deep resid-
ual learning for image recognition. In Proceedings of
the IEEE conference on computer vision and pattern
recognition, pages 770–778.
Kuhn, H. W. (1955). The hungarian method for the as-
signment problem. Naval research logistics quarterly,
2(1-2):83–97.
Li, D., Chen, Y., Zhang, K., and Li, Z. (2019). Mounting
behaviour recognition for pigs based on deep learning.
Sensors, 19(22):4924.
Li, D., Zhang, K., Li, Z., and Chen, Y. (2020). A spatiotem-
poral convolutional network for multi-behavior recog-
nition of pigs. Sensors, 20(8):2381.
Liu, C., Zhang, R., and Guo, L. (2019a). Part-pose guided
amur tiger re-identification. In iccvw.
Liu, N., Zhao, Q., Zhang, N., Cheng, X., and Zhu, J.
(2019b). Pose-guided complementary features learn-
ing for amur tiger re-identification. In iccvw.
Liu, W., Anguelov, D., Erhan, D., Szegedy, C., Reed, S.,
Fu, C.-Y., and Berg, A. C. (2016). Ssd: Single shot
multibox detector. In European conference on com-
puter vision, pages 21–37. Springer.
Milan, A., Leal-Taix
´
e, L., Reid, I., Roth, S., and Schindler,
K. (2016). Mot16: A benchmark for multi-object
tracking. arXiv preprint arXiv:1603.00831.
Ming-Kuei Hu (1962). Visual pattern recognition by mo-
ment invariants. IRE Transactions on Information
Theory, 8(2):179–187.
Mittek, M., Psota, E. T., Carlson, J. D., P
´
erez, L. C.,
Schmidt, T., and Mote, B. (2017). Tracking of group-
housed pigs using multi-ellipsoid expectation max-
imisation. IET Computer Vision, 12(2):121–128.
Nasirahmadi, A., Edwards, S. A., and Sturm, B. (2017).
Implementation of machine vision for detecting be-
haviour of cattle and pigs. Livestock Science, 202:25–
38.
Norouzzadeh, M. S., Nguyen, A., Kosmala, M., Swanson,
A., Palmer, M. S., Packer, C., and Clune, J. (2018).
Automatically identifying, counting, and describing
wild animals in camera-trap images with deep learn-
ing. Proceedings of the National Academy of Sciences,
page 201719367.
Pini, S., Cornia, M., Bolelli, F., Baraldi, L., and Cucchiara,
R. (2019). M-VAD Names: a Dataset for Video Cap-
tioning with Naming. Multimedia Tools and Applica-
tions, 78(10):14007–14027.
Pol Marquer, Teresa Rabade, R. F. (2020). Pig farming
in the European Union: considerable variations from
one Member State to another. https://ec.europa.eu/
eurostat/statistics-explained/pdfscache/3688.pdf.
VISAPP 2021 - 16th International Conference on Computer Vision Theory and Applications
532

Psota, E. T., Mittek, M., P
´
erez, L. C., Schmidt, T., and
Mote, B. (2019). Multi-pig part detection and asso-
ciation with a fully-convolutional network. Sensors,
19(4):852.
Psota, E. T., Schmidt, T., Mote, B., and C P
´
erez, L. (2020).
Long-term tracking of group-housed livestock using
keypoint detection and map estimation for individual
animal identification. Sensors, 20(13):3670.
Redmon, J., Divvala, S., Girshick, R., and Farhadi, A.
(2016). You only look once: Unified, real-time object
detection. In Proceedings of the IEEE conference on
computer vision and pattern recognition, pages 779–
788.
Redmon, J. and Farhadi, A. (2018). Yolov3: An incremental
improvement. arXiv preprint arXiv:1804.02767.
Ristani, E., Solera, F., Zou, R., Cucchiara, R., and Tomasi,
C. (2016). Performance measures and a data set
for multi-target, multi-camera tracking. In Euro-
pean Conference on Computer Vision, pages 17–35.
Springer.
Sa, J., Choi, Y., Lee, H., Chung, Y., Park, D., and Cho,
J. (2019). Fast pig detection with a top-view cam-
era under various illumination conditions. Symmetry,
11(2):266.
Seo, J., Ahn, H., Kim, D., Lee, S., Chung, Y., and Park, D.
(2020). Embeddedpigdet—fast and accurate pig de-
tection for embedded board implementations. Applied
Sciences, 10(8):2878.
Shahbandeh, M. (2020). Number of pigs worldwide from
2012 to 2020. https://www.statista.com/statistics/
263963/number-of-pigs-worldwide-since-1990.
Spampinato, C., Chen-Burger, Y.-H., Nadarajan, G., and
Fisher, R. B. (2008). Detecting, tracking and counting
fish in low quality unconstrained underwater videos.
VISAPP (2), 2008(514-519):1.
Spinello, L. and Arras, K. O. (2011). People detection in
rgb-d data. In 2011 IEEE/RSJ International Confer-
ence on Intelligent Robots and Systems, pages 3838–
3843. IEEE.
Stewart, R., Andriluka, M., and Ng, A. Y. (2016). End-to-
end people detection in crowded scenes. In Proceed-
ings of the IEEE conference on computer vision and
pattern recognition, pages 2325–2333.
Swan, M. K. (2020). Swine Human Resources:
Managing Employees. https://swine.extension.org/
swine-human-resources-managing-employees.
Szegedy, C., Liu, W., Jia, Y., Sermanet, P., Reed, S.,
Anguelov, D., Erhan, D., Vanhoucke, V., and Rabi-
novich, A. (2015). Going deeper with convolutions.
In Proceedings of the IEEE conference on computer
vision and pattern recognition, pages 1–9.
Trachtman, A. R., Bergamini, L., Palazzi, A., Porrello,
A., Capobianco Dondona, A., Del Negro, E., Paolini,
A., Vignola, G., Calderara, S., and Marruchella, G.
(2020). Scoring pleurisy in slaughtered pigs using
convolutional neural networks. Veterinary Research,
51:1–9.
Transparency Research (2019). Hog Production and Pork
Market. https://www.transparencymarketresearch.
com/hog-production-pork-market.html.
Tscharke, M. and Banhazi, T. M. (2016). A brief review
of the application of machine vision in livestock be-
haviour analysis. Agr
´
arinformatika/Journal of Agri-
cultural Informatics, 7(1):23–42.
Underwood, J. P., Calleija, M., Nieto, J., Sukkarieh,
S., Clark, C. E., Garcia, S. C., Kerrisk, K. L.,
and Cronin, G. M. (2013). A robot amongst
the herd: Remote detection and tracking of cows.
In NEW ZEALAND SPATIALLY ENABLED LIVE-
STOCK MANAGEMENT SYMPOSIUM, page 45.
Urtasun, R., Fleet, D. J., and Fua, P. (2006). 3d people track-
ing with gaussian process dynamical models. In 2006
IEEE Computer Society Conference on Computer Vi-
sion and Pattern Recognition (CVPR’06), volume 1,
pages 238–245. IEEE.
Vranken, E. and Berckmans, D. (2017). Precision livestock
farming for pigs. Animal Frontiers, 7(1):32–37.
Wurtz, K., Camerlink, I., D’Eath, R. B., Fern
´
andez,
A. P., Norton, T., Steibel, J., and Siegford, J. (2019).
Recording behaviour of indoor-housed farm animals
automatically using machine vision technology: A
systematic review. PloS one, 14(12):e0226669.
Zhang, K., Li, D., Huang, J., and Chen, Y. (2020). Auto-
mated video behavior recognition of pigs using two-
stream convolutional networks. Sensors, 20(4):1085.
Zhang, L., Gray, H., Ye, X., Collins, L., and Allinson, N.
(2019). Automatic individual pig detection and track-
ing in pig farms. Sensors, 19(5):1188.
Extracting Accurate Long-term Behavior Changes from a Large Pig Dataset
533
