
Automatic Classification of Sleep Apnea Type and Severity using
EEG Signals
Maryam Alimardani
a
and Guido de Moor
Department of Cognitive Science and Artificial Intelligence, Tilburg University, Warandelaan 2, Tilburg, The Netherlands
Keywords: Sleep Apnea Disorder, Apnea Severity, Apnea Type, Automatic Diagnosis, Artificial Intelligence, Machine
Learning, EEG, Brain-Computer Interface (BCI).
Abstract: Sleep apnea is a potentially fatal disorder that causes frequent breathing pauses during sleep. Prior research
has shown that monitoring of EEG signals during sleep can contribute to automatic detection of apnea events.
However, a more comprehensive classification of specific apnea types and their severity is required for
accurate clinical diagnosis and real-time detection of critical apnea episodes. In this study, we employed
annotated EEG signals from 25 apnea patients and constructed two distinct classifiers using EEG frequency
domain and non-linear features for binary classification of apnea severity and multiclass classification of
apnea types. In both classification problems, three models i.e. Support Vector Machine (SVM), Linear
Discriminant analysis (LDA) and Naive Bayes (NB) were evaluated and compared. Results showed that SVM
model performed the best in both classification problems reaching accuracy higher than the baseline level.
The SVM performance in the binary classification of apnea severity was acceptable (76% mean accuracy)
however in the case of multiclass classification of apnea types, the SVM classifier did not reach acceptable
performance for all apnea types (48% mean accuracy). Our findings illustrate that in addition to the detection
of apnea episodes, EEG signals can be used in classification of apnea severity, which could lead to
development of accurate diagnostic systems for automatic assessment and management of sleep disorders.
1 INTRODUCTION
A major proportion of our day is devoted to sleep and
hence it is fundamental to our wellbeing and health.
Sleep Apnea is a respiratory sleep disorder
characterized by shallow breaths or intermittent stops
of the breathing process, which manifests clinically
with snoring, gasping or chocking during sleep and
hence results in poor sleep quality (Altevogt &
Colten, 2006). According to American Sleep Apnea
Association
1
, it is estimated that in the US alone, 22
million people suffer from sleep apnea, with majority
of the moderate and severe cases undiagnosed.
Research shows that prevalence of sleep apnea has
increased in the past two decades in part due to
increasing rates of obesity (Senaratna et al., 2017).
This has created a concern for undiagnosed apnea
patients as cessation of breathing during sleep can
lead to severe respiratory and cardiovascular
a
https://orcid.org/0000-0003-3077-7657
1
https://www.sleepapnea.org/learn/sleep-apnea-
information-clinicians/
disorders as well as cognitive impairment (Fonseca et
al., 2015; Senaratna et al., 2017).
Given that apnea episodes occur during sleep
when patients have no control over events, the most
frequently used tool for diagnosis of sleep apnea is
through polysomnography, in which multiple
physiological measurements, such as heart rhythm
(measured by ECG), brain activity (measured by
EEG), muscle activation (measured by EMG) and
respiratory flow are collected during sleep and
analyzed by sleep physicians (Tan et al., 2014).
Although this method provides reliable results, it is
complicated and requires extensive time and labour
from sleep specialists to conduct visual inspection
and manual labelling of the patients’ data collected at
sleep labs. Therefore, there is an eminent demand for
AI-supported techniques that automatically process
long durations of physiological signals and detect
Alimardani, M. and de Moor, G.
Automatic Classification of Sleep Apnea Type and Severity using EEG Signals.
DOI: 10.5220/0010288301210128
In Proceedings of the 14th International Joint Conference on Biomedical Engineering Systems and Technologies (BIOSTEC 2021) - Volume 1: BIODEVICES, pages 121-128
ISBN: 978-989-758-490-9
Copyright
c
2021 by SCITEPRESS – Science and Technology Publications, Lda. All rights reserved
121
sleep apnea at an early stage of the disorder (Zhou et
al., 2015).
Several past studies have conducted research on
detection of sleep apnea using EEG signals and
obtained promising results (Almuhammadi et al.,
2015; Goshvarpour et al., 2013; Hassan & Bhuiyan,
2017; Kumari et al., 2020; Vimala et al., 2019; Zhou
et al., 2015). However, almost the entire scope of
previous research is focused on the detection, rather
than classification of sleep apnea. This means that,
even though sleep apnea exists in a variety of types,
namely central, obstructive and mixed apnea, and in
different severity level, such as severe apnea and mild
hypopnea, the majority of the prior research have not
made this distinction. The prediction problem in these
studies is based on whether the subject has or does not
have the apnea disorder. Those studies that did make
the distinction, only focused on obstructive sleep
apnea, which is a very severe type of the disorder and
is accompanied by prominent physiological features
(Almuhammadi et al., 2015; Kumari et al., 2020; Lee
et al., 2019; Tan et al., 2014). Therefore, despite
impressive results of these classifiers in detection of
apnea vs. non-apnea events, they have failed to grasp
the complexity of the sleep apnea disorder and its
severity level in different patients (Goshvarpour et al.,
2013). This gap in research is also identified by
previous scholars, highlighting the importance of
such classification in better comprehension of the
disorder (Goshvarpour et al., 2013) as well as in early
diagnosis of high-priority cases that might bear fatal
consequences (Leppänen et al., 2017).
This study attempts to approach this gap in the
literature by expanding the existing apnea detection
models to an EEG-based classification system that
recognizes apnea severity and apnea type among
patients. Earlier research has established three types
of sleep apnea based on respiratory effort;
obstructive, central and mixed apnea (Vimala et al.,
2019). “Obstructive sleep apnea”, which is a frequent
and serious type of sleep disorder, relaxes the throat
muscles during sleep and causes a complete blockage
of upper airways. In “central sleep apnea”, the brain
stops to send proper signals to the muscles that
control respiration and therefore the breathing stops
and starts repeatedly during sleep. Finally, “mixed
sleep apnea” which is also known as “complex sleep
apnea” is a combination of obstructive and central
apnea types, carrying the symptoms of both disorders
in the same episode. On the other hand, all apnea
symptoms indicated above could happen on a less
severe level, in which case the episode in called a
hypopnea. Unlike apnea episodes that contain periods
of no breathing, hypopneas are usually accompanied
by abnormally slow or shallow breathing (a reduction
rather than absence in airflow). Therefore, apneas are
considered as the “Severe” level of the disorder while
hypopneas are the “Mild” subcategory. Similar to
apneas, hypopneas consist of three types of
obstructive, central and mixed. Table 1 summarizes
the description of all apnea types and severity
categories based on the American Academy of Sleep
Medicine criteria for diagnosing sleep apnea disorder
(Kagawa et al., 2016).
Based on the existing knowledge with regard to
apnea severity and types, two research questions were
formulated:
RQ1: To what extent can a binary classification
model distinguish between mild and severe cases of
sleep apnea disorder based on EEG signals?
RQ2: To what extent can a multiclass
classification model distinguish between multiple
types of sleep apnea and hypopnea based on EEG
signals?
We believe that our attempt to answer these
questions
in this study provides new insights with
Table 1: Description of apnea severity levels and apnea types as established in previous research.
Severity level Type Label Symptoms
Severe
(Apnea)
Obstructive APNEA-O Obstruction of the upper airways, complete cessation airflow
Central APNEA-C No obstruction upper airways, complete cessation airflow
Mixed APNEA-M
Central respiratory pause is quickly followed by obstructive ventilatory
effort, complete cessation airflow
Mild
(Hypopnea)
Obstructive HYP-O Obstruction of the upper airways, incomplete cessation airflow
Central HYP-C No obstruction upper airways, incomplete cessation airflow
Mixed HYP-M
Central respiratory pause is quickly followed by obstructive ventilatory
effort, incomplete cessation airflow
BIODEVICES 2021 - 14th International Conference on Biomedical Electronics and Devices
122
respect to different neurophysiological underpinnings
of apnea disorder. In addition, our AI-based approach
for detection of apnea severity and types will put
forward cost-efficient support systems such as home-
based brain-computer interfaces (BCIs) that assist
sleep therapists in their diagnosis of disorder and
monitoring of the patients’ treatment process (Penzel
et al., 2018).
2 METHODS
2.1 Dataset
We employed the St. Vincent's University Hospital
database, which can be found online on PhysioNet
repository (Goldberger et al., 2000). The dataset
contains full overnight polysomnograms from 25 adult
subjects (21 men, 4 female; all above 18 years old) with
sleep-disordered breathing but no known cardiac
disease or medication to interfere with the experiment.
The included EEG signals consisted of two channels in
the left and right central area (C3 and C4) referenced
to the earlobes. The recordings had an average duration
of six hours and contained annotations by a sleep
technologist who labelled different apnea episodes
based on their type and severity. There were two
severity levels; Mild (hypopnea) and Severe (apnea)
each including three categories; Obstructive (labelled
“O”), Central (labelled “C”), and Mixed (labelled “M”)
(see Table 1 for a full description of labels and
symptoms associated with each apnea severity
category and apnea type).
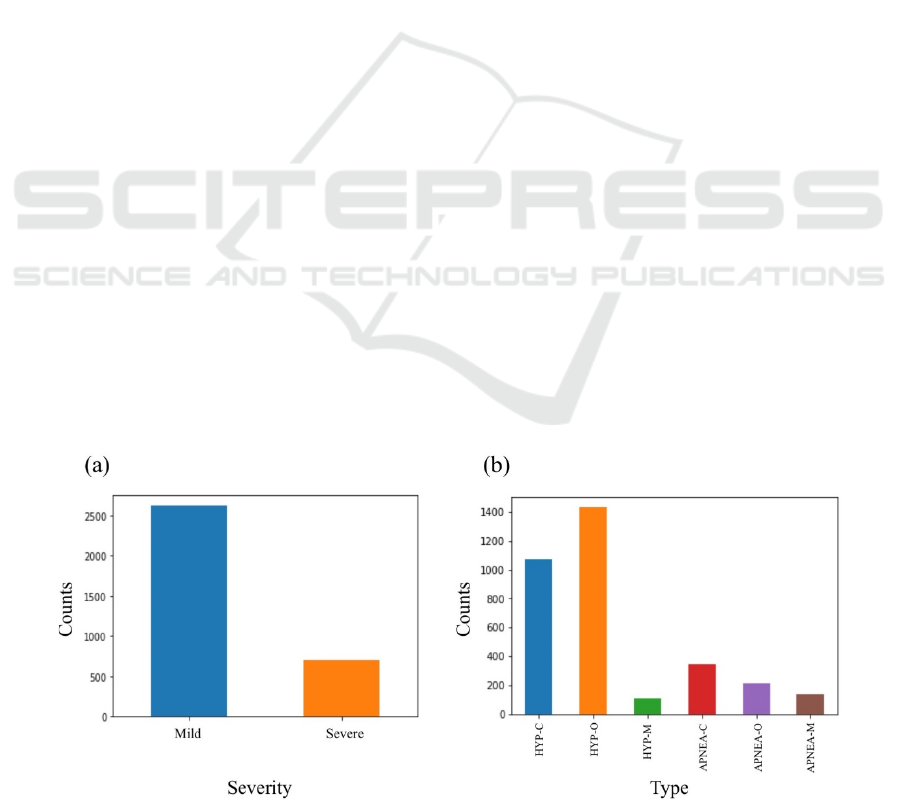
Figure 1 illustrates the distribution of available
apnea episodes and their labels in the dataset with
respect to each classification problem. As can be seen
in this figure, the number of “Mild” hypopnea
episodes was considerably larger than the number of
“Severe” apnea episodes (Figure 1a). Also among six
classes of apnea and hypopnea types (Figure 1b), the
central hypopnea “HYP-C” and obstructive hypopnea
“HYP-O” episodes occurred more frequently than
other apnea and hypopnea types. This imbalance in
the dataset could introduce a bias in the performance
whereby prediction of the majority class would
maximize accuracy. Therefore, the majority class in
each classification problem was downsampled so that
every class held the same number of occurrences
during training and test of the models.
2.2 Data Pre-processing
EEG signals were pre-processed in MATLAB using
EEGLAB toolbox (Delorme & Makeig, 2004). First
the signals were imported at a sampling rate of 128
Hz, which was the original sampling rate at the time
of recording, and band-pass filtered between 0.5 to 30
Hz. Then, filtered EEG signals were segmented into
apnea epochs using the event markers in the data.
Each apnea epoch was used to extract EEG features
associated with that apnea episode. In total, the data
provided 3318 EEG epochs with durations ranging
between 10 to 20 seconds.
2.3 Feature Extraction
There are three types of features, which are
commonly used in sleep classification; time domain
features, frequency domain features and non-linear
features (Koley & Dey, 2012). In the case of sleep
apnea classification, the features that are found the
most relevant are frequency domain and non-linear
features (Almuhammadi et al., 2015; Goshvarpour et
al.,
2013). Therefore, in this research we used
Figure 1: Distribution of the apnea episodes in the dataset based on (a) severity and (b) type.
Automatic Classification of Sleep Apnea Type and Severity using EEG Signals
123
previously reported frequency domain and non-linear
features as the input for the classification algorithms.
For frequency domain features, mean spectral powers
were computed in four frequency bands of delta (1-4
Hz), theta (4-8 Hz), alpha (8-12 Hz) and beta (12-30
Hz) through Fast-Fourier Transform (FFT).
For the second non-linear feature category,
approximate entropy, which is a measure of system
complexity, was computed using EntroPy package
2
.
Approximate entropy quantifies the unpredictability
of fluctuations and the regularity in a time series data.
A smaller approximate entropy value means that the
data performs well in terms of regularity and
prediction. It can be obtained using equation 1
(Goshvarpour et al., 2013), where m is the pattern
length, r is the effective filter and L is the total number
of data points in the data. In this research, we chose
m = 2 and r was set to 15% of the standard deviation
of each EEG segment.
𝐴
𝑝𝐸𝑛
𝑚,𝑟,𝐿
1
𝐿𝑚
𝑙𝑜𝑔𝐶
𝑟
1
𝐿𝑚1
𝑙𝑜𝑔𝐶
𝑟
(1)
Additionally, two statistical measures, i.e. mean
and standard deviation of the amplitudes, were
extracted from the EEG signal segments as time
domain features. These statistical measures were
included to feed the algorithm a more comprehensive
selection of information content from the data as such
features offer information about the shape and density
of the EEG signal during sleep (Koley & Dey, 2012).
The obtained spectral powers, approximate entropy
and statistical measures were then passed to the
feature selection step in order to construct an
optimized feature space for each classification
algorithms.
2.4 Feature Selection
In order to obtain the most optimal input features for
the classification algorithms, the leave-one-out
technique was employed (Feng et al., 2013). This
method consists of dropping one individual feature
per run to examine how the outcome of the classifier
is influenced. In this way, individual importance of
each selected feature is evaluated while interactions
between features during selection process is
preserved which, in turn, results in a more optimal
2
https://github.com/raphaelvallat/entropy
and unified selection of features. For this study, non-
linear features as well as frequency band powers were
dropped individually to investigate what the effect
was on the evaluation metrics.
2.5 Classification
Following our research questions in this study, two
classification problems were investigated; 1) binary
classification of severe apnea episodes (APNEA) vs.
mild hypopnea episodes (HYP), and 2) multiclass
classification of apnea and hypopnea types which
included six classes of obstructive sleep apnea
(APNEA-O), central sleep apnea (APNEA-C), mixed
sleep apnea (APNEA-M), obstructive sleep hypopnea
(HYP-O), central sleep hypopnea (HYP-C), and
mixed sleep hypopnea (HYP-M) (see Table 1).
For each classification problem, three models
including Support Vector Machine (SVM), Linear
Discriminant analysis (LDA), and Naive Bayes (NB)
were imported from the scikit-learn package and were
fitted to the input and target data. Feature vectors
were split into train and test set to construct a
supervised learning setting for the classifiers (70%
training data, 30% test data). The training and test
data were subsequently fitted with the use of
StandardScaler from the scitkit-learn package to
standardize the features. Furthermore, LabelEncoder,
which was also derived from scikit-learn, was used to
convert the targets into numerical values.
Finally, for each model, four metrics of accuracy,
precision, recall and F1-score were reported to get a
conclusive view of the model performance. These
metrics are commonly used as evaluation tools for
sleep apnea research (Almuhammadi et al., 2015;
Vimala et al., 2019; Zhou et al., 2015). Accuracy
refers to the ratio of correct predictions to the total
amount of predictions; precision is the ratio of correct
positive predictions to the total of predicted positives;
recall is the ratio of correct positive predictions to the
total of positive cases in the set and the F1-score is
the harmonic mean of precision and recall.
3 RESULTS
The outcomes of classification performances are
presented in two subsections, each associated with
apnea severity and apnea type classification
problems.
BIODEVICES 2021 - 14th International Conference on Biomedical Electronics and Devices
124
3.1 Binary Classification for Apnea
Severity Recognition
In the feature selection step for this classification
problem, the leave-one-out method (as described in
2.4) showed that for the SVM model, the performance
was optimal when all spectral band powers were
dropped from the input features (1.19% increase on
accuracy). Also, the performance of LDA was
improved by dropping the delta band power (0.24%
increase on accuracy) and the performance of NB was
enhanced when the theta band was left out of the input
features (0.48% increase on accuracy).
Table 2 demonstrates the outcomes of the binary
classification of apnea severity for the SVM, LDA
and NB classifiers. Boldface denotes the best
performance for each measure. A comparison among
the three classification models shows that the SVM
model reached the highest average performance on all
metrics. All models reached an accuracy level above
the baseline accuracy of 50%, however, the highest
mean accuracy was obtained from the SVM model,
which was 75.90%.
3.2 Multiclass Classification for Apnea
Type Recognition
In the feature selection step for this classification, the
leave-one-out method indicated that for the SVM
model, the performance was optimal when the theta
band power was dropped from the input features
(increase of 2.36% on accuracy). For LDA, the alpha
band power was dropped to strengthen the model
(increase 5.10% on accuracy), and in the case of NB
it turned out that dropping all band power features
was beneficial for the model performance (increase of
1.96% on accuracy).
Table 3 presents the results of the efforts to
classify different types of sleep apnea with the use of
SVM, LDA and NB algorithms. Boldface denotes the
best performance for each measure. As is evident
from the table, again the SVM model surpassed the
other two classifiers in every performance metric as
averaged over multiple classes. All models reached
an accuracy level above the baseline accuracy of
20%, however, the highest mean accuracy was
obtained from the SVM model, which was 48.24%.
Additionally, the highest F1-score was obtained for
the HYP-O class in all classification models.
4 DISCUSSION
Diagnosis of sleep apnea disorder using
polysomnogram signals has become an increasingly
difficult and resourceful task for sleep physicians due
to the prevailing magnitude of the apnea phenomenon
(Altevogt & Colten, 2006). Previous studies have
shown the efficacy of EEG signals in detection of
apnea presence. However, classification of apnea
severity and apnea type based on EEG signals has
never been explored in the past. Therefore, a combined
call from the scientific community (Goshvarpour et al.,
2013) as well as a sense of urgency from the practical
point of view (Goldberger et al., 2003; Koley & Dey,
2012) drove the motivation for this study to explore the
promises of machine learning models in automatic
detection of apnea severity and apnea type from
neurophysiological signals.
In this study, we used annotated EEG recordings from
25 patients who suffered from sleep apnea and
developed classifiers for automatic classification of
two apnea severity levels and three apnea types. Our
results from three classification models showed that
overall EEG signals could be employed in automatic
recognition of apnea severity to a decent extent, but
an optimal performance was not achieved for
classification of apnea types.
Table 2: Performance results for binary classification of apnea severity with three models of Support Vector Machine, Linear
Discriminant Analysis and Naive Bayes.
Binary Classification for Apnea Severity
Support Vector Machine Linear Discriminant Analysis Naive Bayes
F1-score Precision Recall F1-score Precision Recall F1-score Precision Recall
Mild
0.7624 0.7043 0.8308 0.6916 0.6352 0.7590 0.6509 0.5613 0.7744
Severe
0.7554 0.8254 0.6964 0.6780 0.7473 0.6205 0.5668 0.7067 0.4732
Weighted
Average
0.7587 0.7691 0.7590 0.6844 0.6951 0.6850 0.6059 0.6390 0.6134
Accuracy
75.90% 68.50% 61.34%
Automatic Classification of Sleep Apnea Type and Severity using EEG Signals
125
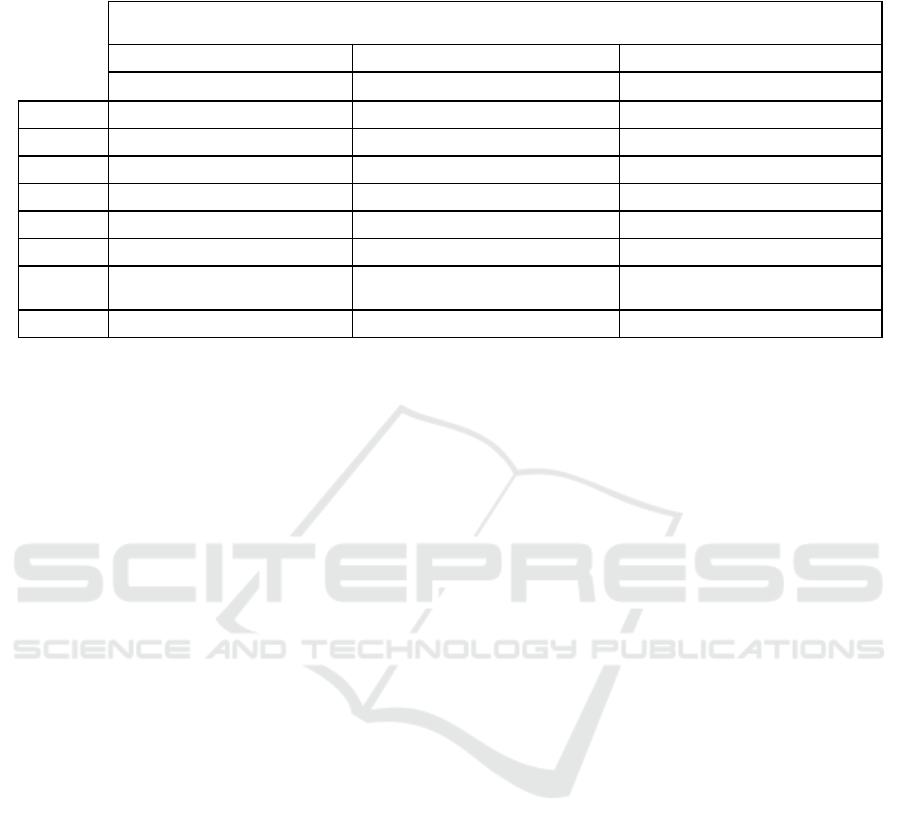
Table 3: Performance results for binary classification of apnea severity with three models of Support Vector Machine, Linear
Discriminant Analysis and Naive Bayes.
With respect to the first classification problem, the
SVM model performed the best on the binary
recognition of mild hypopnea vs. severe apnea
episodes (76% accuracy). A close look at Table 2 and
other performance metrics of each model in this
classification problem revealed that in general the
models obtained a superior precision and an inferior
recall score for the “Severe” class than they did for
the “Mild” class. Also, the precision score was higher
than recall in classification of “Severe” apnea
episodes, while opposite pattern was present for the
“Mild” class, where the recall score was higher than
the precision score. This means that the classifiers
made few mistakes in attribution of mild episodes to
a severe class whereas many severe episodes were
falsely detected as mild. This outcome is
disadvantageous to the classification goal in this
study, as the aim of this research was to detect as
many severe cases as possible. The flagging of severe
cases helps physicians to spot high-risk patients that
require immediate attention. Hence, the recall metric
is an important measure for this classification
problem and thus the scales should be tipped in favour
of detecting as many severe cases as possible, even if
this means that some patients with mild apnea are
classified as severe.
The importance of the recall score has also been
mentioned in previous apnea detection studies, in
view of the fact that the classifier should reduce the
risk of missing the apnea/hypopnea events rather than
reducing the incorrect recognition of non-apnea
events (Xie & Minn, 2012). To that end, Xie and
Minn (2012) proposed a cost-sensitive classification
that would enhance the recall score by imposing a
cost matrix to penalize the FN errors more than the
FP errors. They incorporated this strategy of cost-
sensitive weighting in the feature selection process to
favour highly predictive features. They also found
that this method reduced the computational load by
1/5 of the even cost method (Xie & Minn, 2012). The
same technique could be applied in future research on
the results of this study, in order to improve the
classifier and make it functional for practitioners.
In the second classification problem, the
multiclass classifier did not reach a favourable
performance in apnea type detection, even though the
accuracy obtained from the three models was above
the chance-level baseline. Again, the SVM model
performed the best on the multiclass classification of
apnea types (48% accuracy) and the performance
metrics were relatively high only for the HYP-O and
HYP-C classes; the same classes that originally
provided more instances in the dataset and were
downsampled for training of the model. This means
that although for a few apnea types the model learned
the EEG representations well, the classifier cannot be
put into practice on the basis of this study alone.
Nevertheless, this does not mean that the model
cannot be a starting point for future research and the
further development of an apnea type detection
system. Various strategies can be suggested for future
research to improve the classification performance on
apnea type detection task. For instance,
One of the effective tools in improvement of sleep
data classification is combination of two or more
models (Supratak et al., 2017; Zhang et al., 2016).
This strategy is based on the idea that individual
classifiers offer different perspectives in decision
making and that the combination of different
classifiers would harnesses the complementary
information provided by each of them. In this study,
an improvement of the model can be expected by
Multiclass Classification for Apnea Types
Support Vector Machine Linear Discriminant Analysis Naive Bayes
F1-score Precision Recall F1-score Precision Recall F1-score Precision Recall
APNEA-C
0.4200 0.3559 0.5122 0.3855 0.3810 0.3902 0.1509 0.3333 0.0976
APNEA-M
0.4615 0.4865 0.4390 0.4471 0.4318 0.4634 0.4706 0.3590 0.6829
APNEA-O
0.2973 0.5000 0.2115 0.2558 0.3235 0.2115 0.1972 0.3684 0.1346
HYP-C
0.5321 0.5088 0.5577 0.5000 0.4821 0.5192 0.4306 0.3370 0.5964
HYP-M
0.3019 0.3200 0.2857 0.2388 0.2051 0.2857 0.1860 0.2667 0.1429
HYP-O
0.7500 0.6545 0.8780 0.7160 0.7250 0.7073 0.6000 0.6154 0.5854
Weighted
Average
0.4646 0.4815 0.4824 0.4293 0.4341 0.4314 0.3448 0.3834 0.3843
Accuracy
48.24% 43.14% 38.43%
BIODEVICES 2021 - 14th International Conference on Biomedical Electronics and Devices
126

merging of the SVM and LDA models, since the LDA
precision scores for “APNEA-C” and “HYP-O” offer
additional value for the classification performance.
Another direction for future research could be
investigation of appropriate EEG features for apnea
type and severity classification. In this study, we
mainly relied on previously reported EEG features
that were employed in the field of apnea detection
research, however, it is conceivable that the best
features for apnea detection are not necessarily the
optimal features for apnea classification. For
instance, past research shows that sample entropy has
an advantage over approximate entropy as it yields
more consistent results and is less affected by the
choice of parameters in the model (Richman &
Moorman, 2000). Nonetheless, both are sensitive to
spikes and noise in the EEG signals (Molina-Picó et
al., 2011). Further research should be conducted in
order to estimate what other non-linear, time domain
or frequency domain features could be used to
strengthen the model and its performance.
Alternatively, deep learning models can be employed
for automatic learning of the EEG signal
characteristics without utilizing any hand-engineered
features (Zhang et al., 2016).
Increasing the size of the dataset will also benefit
the performance of the model although insufficient
data is a problem that is often faced in sleep research
since collection and annotation of polysomnogram
data is a very costly and time-consuming process. It
is worth noting that not only the number of the
recorded patients, but also the unbalanced frequency
in the occurrence of apnea and hypopnea episodes
imposed a limitation on the final data employed in
this study. Due to the imbalance of the Vincent’s
dataset, we had to deploy a downsampling technique,
which meant a large part of the data segments could
not be used in the training and test of the models.
Consequently, we had to combine all EEG epochs
from all subjects and employ cross validation over
events rather than subjects. Although, this approach
is ideal for development of a one-fit-all solution that
makes diagnosis without system calibration possible,
it comes at the expense of accuracy for long-term
monitoring and treatment. With extended and more
frequent EEG recordings from more apnea patients,
future research can investigate the inter-subject
variability in classifiers’ performance and develop a
personalized BCI system that learns from the same
patient’s EEG signals and provides a more reliable
prediction.
In sum, our study showed that machine learning
methods combined with EEG monitoring sensors can
provide a prominent evidence for automated
classification of apnea severity. Determining the
severity of apnea disorder is a key aspect of accurate
diagnosis and the first step toward development of
home testing and treatment devices for apnea
disorder. Apnea can have very serious health
consequences and, therefore, the severe cases need to
be detected and treated promptly. Development of
AI-driven home-based apnea management systems
will have three major impacts; 1) they would alleviate
the burden of lengthy diagnosis procedures from
overworked physicians, 2) they would relieve a
patient from the intrusive data collection process at a
sleep lab, and 3) they would make the diagnosis of
sleep apnea and follow-up monitoring of treatment
cost-efficient and widely accessible to the public.
Therefore, future research should continue to explore
methods for improvement of the apnea classifier
performance and pragmatically investigate the
benefits of real-time BCI applications in sleep health
research and clinical practice.
5 CONCLUSIONS
This study attempted the classification of sleep apnea
severity and apnea types from EEG signals of 25
patients. Our results showed promising findings with
respect to recognition of apnea severity (mild vs.
severe), which could be of significant interest to sleep
specialists. Additionally, our comparison of three
machine learning algorithms confirmed that the SVM
model performed better than LDA and NB models in
both classifications of apnea severity and apnea type.
These findings hold promise for future development
of EEG-based apnea diagnosis technologies as well
as home-based apnea monitoring and management
systems (e.g. smartphone apps) that can automatically
detect apnea episodes in real-time and provide
immediate care.
REFERENCES
Almuhammadi, W. S., Aboalayon, K. A., & Faezipour, M.
(2015, May). Efficient obstructive sleep apnea
classification based on EEG signals. In 2015 Long
Island Systems, Applications and Technology (pp. 1-6).
IEEE.
Altevogt, B. M., & Colten, H. R. (Eds.). (2006). Sleep
disorders and sleep deprivation: an unmet public health
problem. National Academies Press.
Delorme, A., & Makeig, S. (2004). EEGLAB: an open
source toolbox for analysis of single-trial EEG
dynamics including independent component analysis.
Journal of neuroscience methods, 134(1), 9-21.
Automatic Classification of Sleep Apnea Type and Severity using EEG Signals
127

Feng, D., Chen, F., & Xu, W. (2013). Efficient leave-one-
out strategy for supervised feature selection. Tsinghua
Science and Technology, 18(6), 629-635.
Fonseca, M. I. P., Pereira, T., & Caseiro, P. (2015). Death
and disability in patients with sleep apnea-a meta-
analysis. Arquivos Brasileiros de Cardiologia, 104(1),
58-66.
Goldberger, A. L., Amaral, L. A., Glass, L., Hausdorff, J.
M., Ivanov, P. C., Mark, R. G., ... & Stanley, H. E.
(2000). PhysioBank, PhysioToolkit, and PhysioNet:
components of a new research resource for complex
physiologic signals. circulation, 101(23), e215-e220.
Goshvarpour, A., Abbasi, A., & Goshvarpour, A. (2013).
Nonlinear evaluation of electroencephalogram signals
in different sleep stages in apnea episodes.
International journal of intelligent systems and
applications, 5(10), 68.
Hassan, A. R., & Bhuiyan, M. I. H. (2017). An automated
method for sleep staging from EEG signals using
normal inverse Gaussian parameters and adaptive
boosting. Neurocomputing, 219, 76-87.
Koley, B., & Dey, D. (2012). An ensemble system for
automatic sleep stage classification using single
channel EEG signal. Computers in biology and
medicine, 42(12), 1186-1195.
Kagawa, M., Tojima, H., & Matsui, T. (2016). Non-contact
diagnostic system for sleep apnea–hypopnea syndrome
based on amplitude and phase analysis of thoracic and
abdominal Doppler radars. Medical & biological
engineering & computing, 54(5), 789-798.
Kumari, C. U., Kora, P., Meenakshi, K., Swaraja, K.,
Padma, T., Panigrahy, A. K., & Vignesh, N. A. (2020).
Feature Extraction and Detection of Obstructive Sleep
Apnea from Raw EEG Signal. In International
Conference on Innovative Computing and
Communications (pp. 425-433). Springer, Singapore.
Lee, P. L., Huang, Y. H., Lin, P. C., Chiao, Y. A., Hou, J.
W., Liu, H. W., ... & Chiueh, T. D. (2019). Automatic
Sleep Staging in Patients With Obstructive Sleep Apnea
Using Single-Channel Frontal EEG. Journal of Clinical
Sleep Medicine, 15(10), 1411-1420.
Leppänen, T., Kulkas, A., Duce, B., Mervaala, E., &
Töyräs, J. (2017). Severity of individual obstruction
events is gender dependent in sleep apnea. Sleep and
Breathing, 21(2), 397-404.
Molina-Picó, A., Cuesta-Frau, D., Aboy, M., Crespo, C.,
Miro-Martinez, P., & Oltra-Crespo, S. (2011).
Comparative study of approximate entropy and sample
entropy robustness to spikes. Artificial intelligence in
medicine, 53(2), 97-106.
Penzel, T., Schöbel, C., & Fietze, I. (2018). New
technology to assess sleep apnea: wearables,
smartphones, and accessories. F1000Research, 7.
Richman, J. S., & Moorman, J. R. (2000). Physiological
time-series analysis using approximate entropy and
sample entropy.
American Journal of Physiology-Heart
and Circulatory Physiology, 278(6), H2039-H2049.
Senaratna, C. V., Perret, J. L., Lodge, C. J., Lowe, A. J.,
Campbell, B. E., Matheson, M. C., ... & Dharmage, S.
C. (2017). Prevalence of obstructive sleep apnea in the
general population: a systematic review. Sleep medicine
reviews, 34, 70-81.
Supratak, A., Dong, H., Wu, C., & Guo, Y. (2017).
DeepSleepNet: A model for automatic sleep stage
scoring based on raw single-channel EEG. IEEE
Transactions on Neural Systems and Rehabilitation
Engineering, 25(11), 1998-2008.
Tan, H. L., Gozal, D., Ramirez, H. M., Bandla, H. P., &
Kheirandish-Gozal, L. (2014). Overnight
polysomnography versus respiratory polygraphy in the
diagnosis of pediatric obstructive sleep apnea. Sleep,
37(2), 255-260.
Vimala, V., Ramar, K., & Ettappan, M. (2019). An
intelligent sleep apnea classification system based on
EEG signals. Journal of medical systems, 43(2), 36.
Xie, B., & Minn, H. (2012). Real-time sleep apnea
detection by classifier combination. IEEE Transactions
on information technology in biomedicine, 16(3), 469-
477.
Zhang, J., Wu, Y., Bai, J., & Chen, F. (2016). Automatic
sleep stage classification based on sparse deep belief net
and combination of multiple classifiers. Transactions of
the Institute of Measurement and Control, 38(4), 435-
451.
Zhou, J., Wu, X. M., & Zeng, W. J. (2015). Automatic
detection of sleep apnea based on EEG detrended
fluctuation analysis and support vector machine.
Journal of clinical monitoring and computing, 29(6),
767-772.
BIODEVICES 2021 - 14th International Conference on Biomedical Electronics and Devices
128
