
Quantifying Wind Turbine Blade Surface Roughness using Sandpaper
Grit Sizes: An Initial Exploration
Ivan Nikolov and Claus Madsen
Department of Architecture, Design and Media Technology, Aalborg University, Rendsburggade 14, Aalborg, Denmark
Keywords:
3D Reconstruction, Surface Inspection, Sandpaper Roughness, Classification, Random Forests, Geometrical
Properties.
Abstract:
Surface inspection of wind turbine blades is a necessary step, to ensure longevity and sustained high energy
output. The detection of accumulation of damages and increased surface roughness of in-use blades, is one
of the main objectives of inspections in the wind energy industry. Creating 3D scans of the leading edges of
blade surfaces has been more and more used for capturing the roughness profile of blades. An important part
in analysing these surface 3D scans is the standardization of the captured data across different blade surfaces,
types and sizes. In this paper we propose an initial exploration of using sandpaper grit sizes to provide this
standardization. Sandpaper has been widely used for approximating different levels of blade surface roughness
and its standardized nature can be used to easily describe and compare blade surfaces. We reconstruct a number
of different sandpaper grit sizes - from coarser P40 to a finer P180. We extract a number of 3D surface features
from them and use them to train a random forest classification method. This method is then used to segment
the surfaces of wind turbine blades in areas of different surface roughness. We test our proposed solution on
a variety of blade surfaces - from smooth to course and damaged and show that it manages to classify them
depending on their roughness.
1 INTRODUCTION
Surface inspection is a required part of ensuring
the proper working condition of machinery and in-
frastructure in industries like agriculture (El-Mesery
et al., 2019), manufacturing (Dastoorian et al., 2018)
and energy production (Zhang et al., 2017b) among
other. The wind energy production industry is partic-
ularly susceptible to the effects of infrastructure dam-
ages and degradation. For achieving maximum wind
turbine performance, blades need to be inspected reg-
ularly and potential damages caused by weather ero-
sion and imperfections in the manufacturing process
(Martin et al., 2018), (Du et al., 2020), need to be de-
tected as soon as possible. It has been shown that the
presence of even small surface roughness deviations
and damages can cause 2% and 5% loss in energy pro-
duction (Langel et al., 2015), with numbers as high
as 25% for larger damages and surface imperfections
(Schramm et al., 2017).
Wind turbine blade inspection is normally focused
on the leading edge of the blades, as it is shown
that damages there affect performance the most (Bak
et al., 2016). Inspection can be done manually by ex-
perts on site or in a laboratory setting through contact
measurements and microscopy analysis (Chen, 2018)
or by using machine vision methods (Shihavuddin
et al., 2019). This normally requires capturing images
of the surface, which are used for detecting potential
damages and imperfection (Shihavuddin et al., 2019),
(Moreno et al., 2018), (Al-Kaff et al., 2017). These
algorithms require a lot of image data of both clean
and damaged surfaces of wind turbine blades, which
is not easily accessible. These systems also cannot
normally quantify the micro surface roughness of the
blade, as they lack depth information. This depth in-
formation can be captured by reconstructing the 3D
surface, using techniques like Structure from Motion
(Zhang et al., 2020), (Nielsen et al., 2020).
To quantify this information and be able to com-
pare it between blade surfaces, a standardized model
of measurement of surface roughness is required. Pro-
file roughness metrics part of the ISO 4287 (ISO4287,
1997) standard are used for estimation of the details
of line scans of surfaces. These profile metrics can
be extended to a 3D area, by using the ISO 25178
(ISO25178, 2012) standard. For 3D, a plane is fit-
ted to the surface patches and the metrics are cal-
Nikolov, I. and Madsen, C.
Quantifying Wind Turbine Blade Surface Roughness using Sandpaper Grit Sizes: An Initial Exploration.
DOI: 10.5220/0010283908010808
In Proceedings of the 16th International Joint Conference on Computer Vision, Imaging and Computer Graphics Theory and Applications (VISIGRAPP 2021) - Volume 5: VISAPP, pages
801-808
ISBN: 978-989-758-488-6
Copyright
c
2021 by SCITEPRESS – Science and Technology Publications, Lda. All rights reserved
801

culated from their values. In this paper we explore
extending these metrics representations, by classify-
ing the surface based on sandpaper roughness that
best describes it. Sandpapers with different grit sizes
have been widely used in the literature for model-
ing wind turbine blade roughness in wind tunnels
(Marzuki et al., 2018), (Genc et al., 2019). It has been
shown that surfaces with attached sandpaper patches
exhibit the same behaviour as damaged ones. By
classifying wind turbine blades, into different sandpa-
per roughness profiles, their degradation can be more
easily communicated and compared between blades.
In addition, sandpaper surface grits are standardized
(ISO6344, 1998) and easily accessible, making repro-
duction of results easy and straightforward. Finally,
3D data of sandpaper surfaces can be much more eas-
ily obtained, than real wind turbine blade surface data
with different levels of surface damages.
2 STATE OF THE ART
Wind turbine blade analysis can be used to calculate
the predicted energy production (Han et al., 2018)
and the utilization coefficients of turbines (Wang and
Zhang, 2017). It can be also used for introducing a
more granular control on the flow control and aerody-
namic properties of blades (Langel et al., 2017).
Capturing of 3D data from the surface of wind tur-
bine blades is a widely researched topic. Two main
approaches to capturing 3D can be seen in the state
of the art - for on-site inspections (Xu et al., 2019),
when the wind turbine has been just stopped and off-
line laboratory inspections, where decommissioned
blades are normally inspected (Chen, 2018). The first
type of inspection is performed on a more regular ba-
sis and aims to keep the blades in as close as possible
optimal conditions, while the second type is focus on
understanding why and how a blade failed or it was
decided that the damages are too severe. For on-site
inspections cameras and 3D sensors like LiDARs and
stereo cameras are mounted on unmanned aerial ve-
hicles (Zhang et al., 2017a), (Peng and Liu, 2018).
These aim to produce less high detailed reconstruc-
tions, which could under optimal capturing conditions
capture enough information to give an estimate of
the current condition of the blades. Laboratory in-
spections normally use more detailed surface analy-
sis technique, employing electronic microscopes or
surface probes (Chan et al., 2019), (Amenabar et al.,
2011). These methods can capture very high reso-
lution sub-millimeter accuracy reconstructions of the
blade surfaces.
In this paper we try to classify wind turbine blade
surfaces using sandpapers with different grit sizes. As
sandpapers have known surface properties, we can
then infer the same information about the blade sur-
faces. In addition, sandpaper data is widely used for
simulating how different surface roughness affects the
aerodynamic characteristics of wind turbine blades
and their energy production potential. We base our
research on traditional supervised learning methods,
using hand crafted features like the ones presented in
the work of (Weinmann et al., 2015), (Hackel et al.,
2016), (Dittrich et al., 2017), for use on large scale Li-
DAR point cloud segmentation, focusing on extract-
ing geometrical features, which describe the under-
lying surface in a robust way. Our proposed solu-
tion uses 3D sandpaper data to train a Random Forest
classifier, which is later used to segment wind turbine
blade surfaces into ares best described by the differ-
ent sandpaper grit sizes This information can be later
used to model test setups or to better evaluate how
the roughness would affect the blade, based on sand-
paper wind tunnel tests. We show that the proposed
approach gives promising results.
3 METHODOLOGY
3.1 SfM Overview
As both the sandpaper patches and the testing wind
turbine data are captured using Structure from Motion
(SfM), we will first give an overview of the method,
for easier reproducibility. SfM is a part of the multi-
view stereo algorithms, that uses only 2D image data
from different positions and view directions to recon-
struct the full 3D surface of an object (Ozyesil et al.,
2017). A number of images with a certain overlap
are used as input to the algorithm. Features are ex-
tracted from each image and matched between im-
ages. This can be done using algorithms like SIFT
(Lowe, 2004) or ORB (Rublee et al., 2011). These
matched features, together with information about the
intrinsic parameters of the camera used to take the im-
ages, are used to iteratively triangulate the camera po-
sitions and create a sparse point cloud of the scanned
object. The sparse point cloud is then refined using
bundle adjustment (Triggs et al., 1999) and a dense
point cloud is created from the 3D sparse points and
camera positions.
3.2 Sandpaper 3D Reconstruction
A number of sandpaper grit sizes are chosen for devel-
oping the training examples and given in Table 1, to-
VISAPP 2021 - 16th International Conference on Computer Vision Theory and Applications
802
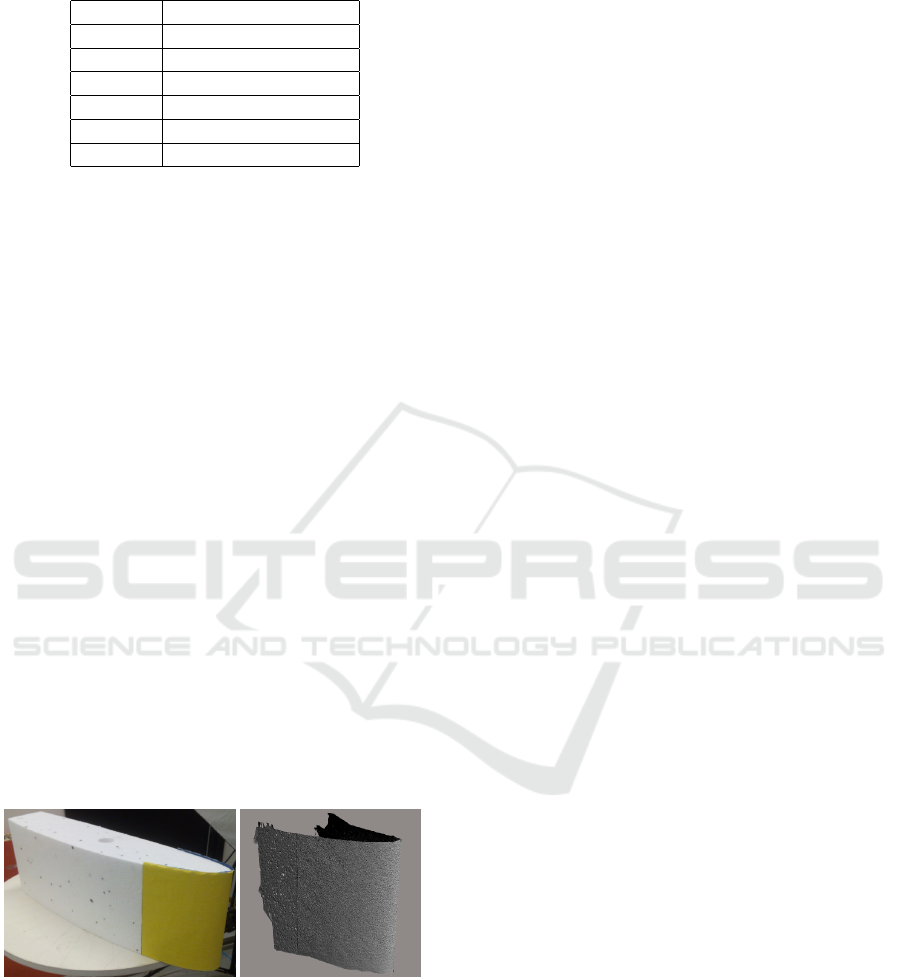
Table 1: Sandpaper grit size and the nominal average parti-
cle diameter in mm (FEPA, 1955).
Grit size Nom. av. diam. (mm)
P40 0.425
P60 0.269
P80 0.201
P100 0.162
P120 0.125
P180 0.082
gether with their average particle size. This standard
is proposed by (FEPA, 1955) and widely used. The
”P” notation of the grit sizes is inversely related to the
coarseness of the sandpaper material and represents
the size of the particles, embedded in the material.
These grit sizes are chosen, because they are widely
used for blade roughness approximation (Genc et al.,
2019) and the nominal average diameter of their grit
structure is representative of blade roughness values,
at which energy production loss starts to be observed
(Bak et al., 2016). To more closely mimic how rough-
ness on a wind turbine blade edge would behave,
the sandpaper patches are mounted on blade replicas
made from styrofoam. The replicas are modeled after
the NACA 633418 blade and can be seen in Figure
1(a).
For 3D reconstructing the blade replicas a Canon
5Ds camera is used. As proposed by (Nikolov and
Madsen, 2016), a semi-circular pattern with a 1.5m
radius is used and 18 images are taken in three dif-
ferent heights of the leading edge with the sandpaper
attached. The thus created 54 images are then used as
an input to Metashape (Agisoft, 2010), a commercial
SfM solution, shown to produce high detailed and ro-
bust reconstructions. An example of the reconstructed
point clouds for grit size P40, can be seen in Figure
1(b).
(a) (b)
Figure 1: Example of styrofoam blade replica with sand-
paper of P40 installed on it 1(a), together with the recon-
structed surface 1(b).
3.3 Sandpaper Feature Extraction
We extract a number of features from the sandpaper
point clouds, as presented in the work by (Blomley
et al., 2016). To calculate these features first the lo-
cal neighbourhood around each point needs to be ex-
tracted, using a KDtree (Bentley, 1975), using the im-
plementation from (Zhou et al., 2018). In their work
(Blomley et al., 2016) and (Weinmann et al., 2015)
test features extracted from different types of neigh-
bourhood selection for each point. From the results of
their work it can be seen that a combination of mul-
tiple neighbourhoods with different shapes and sizes
gives the best results. We also choose this approach,
but focus on neighbourhoods of the same shape, as the
classes we are trying to detect, have uniform sandpa-
per roughness structures. We choose the neighbour-
hood scales, in a way that they can encompass the
average particle sizes of the selected sandpaper grits.
We choose spherical neighbourhoods with radii in the
interval [1 . . . 0.1] mm and a delta change of 0.1 mm.
This creates 10 progressively smaller scales of neigh-
bourhoods. If not enough points are present in the
neighbourhood for calculating the features, it is ze-
roed out.
Three types of features are selected, as described
in (Blomley et al., 2016) and (Weinmann et al., 2015),
(Dittrich et al., 2017) - fundamental geometrical prop-
erties of the point clouds, local shape covariance fea-
tures and local statistical shape distribution features.
These are calculated for each neighbourhood scale
and combined. As described by (Blomley et al.,
2016), the fundamental geometrical properties are as
follow:
• Local point density of the neighbourhood around
a given point (Figure 2(a)),
• The farthest distance between points in the neigh-
bourhood (Figure 2(b)),
• The maximum height of difference between
points in the neighbourhood, where height is ex-
pressed in the direction of the average normal of
the neighbourhood (Figure 2(c)),
• The standard deviation of the height differences
between points in the neighbourhood, where again
the height is expressed in the direction of the av-
erage normal (Figure 2(d)).
A visualization of these features for a neighbour-
hood size of 1mm on the P40 sandpaper are shown in
Figure 2, where just a small area of the whole sand-
paper leading edge is visualized.
The local shape features proposed by (Blomley
et al., 2016) and (Weinmann et al., 2015) are based
on the use of covariance features and require the cal-
culation of the eigenvalues λ
1
, λ
2
, λ
3
of each neigh-
bourhood scale. These features are as follows:
Quantifying Wind Turbine Blade Surface Roughness using Sandpaper Grit Sizes: An Initial Exploration
803
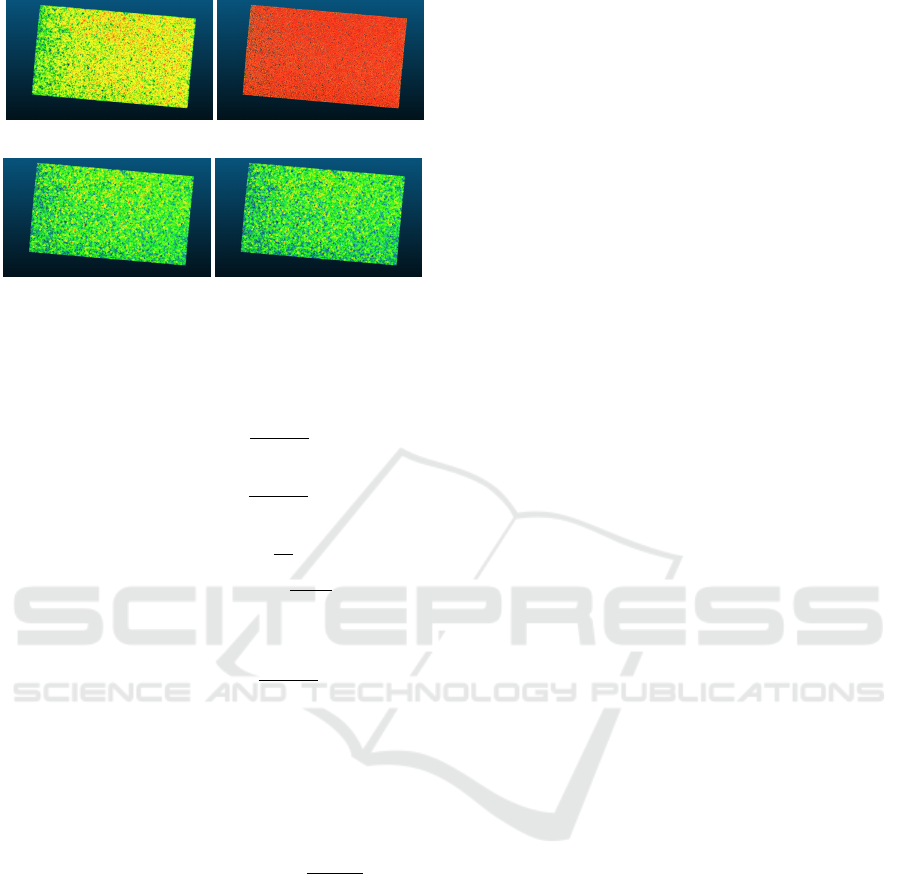
(a) Local Density (b) Farthest Distance
(c) Maximum Height (d) Height Std. Dev.
Figure 2: Example local fundamental geometrical proper-
ties, extracted from the P40 sandpaper grit size. Just a small
part of the sandpaper leading edge is shown for easier visu-
alization.
Linearity: L
λ
=
λ
1
− λ
2
λ
1
(1)
Planarity: P
λ
=
λ
2
− λ
3
λ
1
(2)
Sphericity: S
λ
=
λ
3
λ
1
(3)
Omnivariance: O
λ
=
3
s
3
∏
i=1
λ
i
(4)
Anisotropy: A
λ
=
λ
1
− λ
3
λ
1
(5)
Eigenentropy: E
λ
= −
3
∑
i=1
λ
i
lnλ
i
(6)
Sum of Eigenvalues: Σ
λ
=
3
∑
i=1
λ
i
(7)
Local surface variation: C
λ
=
λ
3
∑
3
i=1
λ
i
(8)
To calculate the eigenvalues, we first calculate the
covariance matrix, of the points inside of the neigh-
bourhood and extract the eigenvalues from it, which
are then sorted in descending order. Example of how
these features look on a P40 sandpaper, calculated
from a neighbourhood size of 1mm is given in Figure
3.
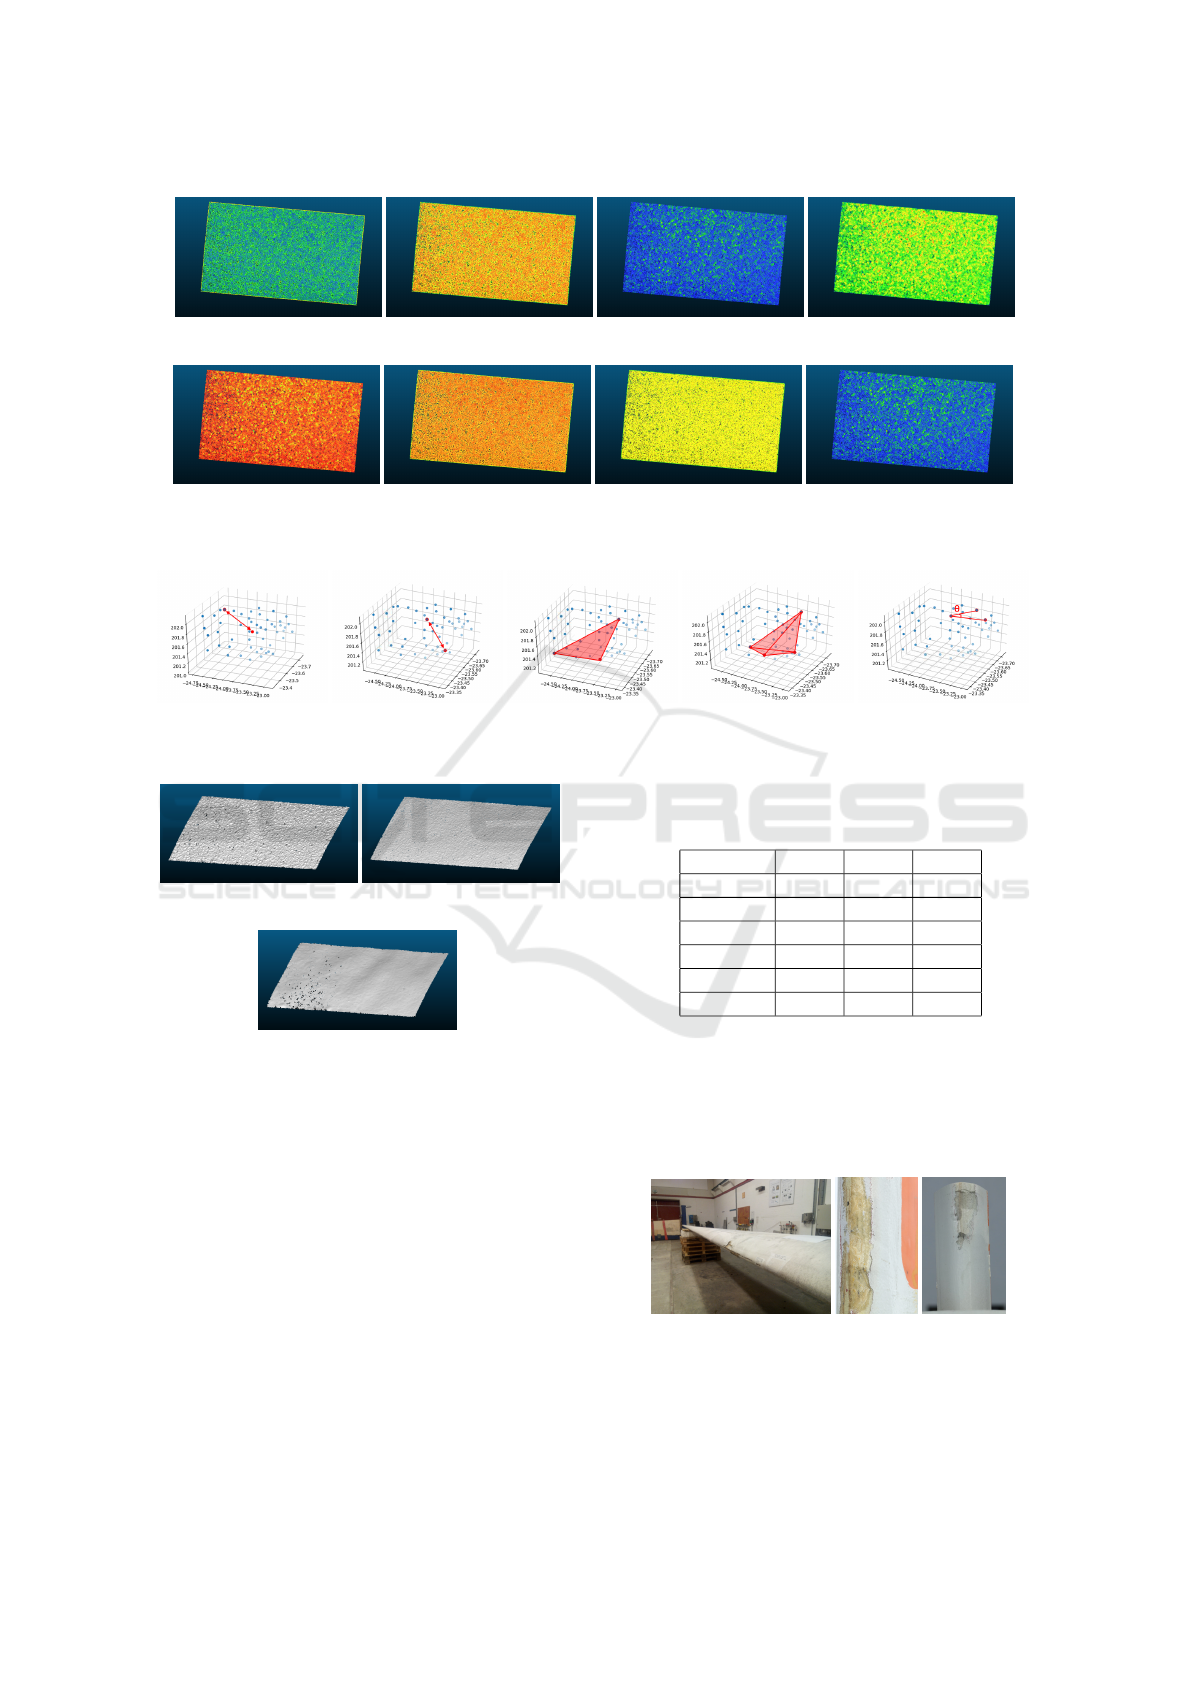
The third type of features are the statistical shape
distributions. These distributions are derived from the
work by (Osada et al., 2002), for parameterization of
the whole object’s shape, but for use as local features,
they can be used on neighbourhoods of points. These
distributions are calculated as histograms of randomly
sampled shape values. These shape values are based
on five metrics:
• D1 - distance from the neighbourhood centroid,
to a random point from the same neighbourhood
4(a),
• D2 - distance between two random points from
the neighbourhood 4(b),
• D3 - the square root of the area between three ran-
dom points from the neighbourhood 4(c),
• D4 - the cubic root of the volume of a tetrahedron
made from four random points from the neigh-
bourhood 4(d),
• A3 - the angle between three random points from
the neighbourhood 4(e).
We follow the suggestions by (Weinmann et al.,
2015) and calculate the distributions as histograms
with 10 bins and 255 random samplings from each
neighbourhood scale. These results in 100 statistical
distribution features per point. The visualization of
the five used metrics, can be seen in Figure 4.
These features are extracted from each of the re-
constructed sandpaper patches and used to train a
Random Forest classifier. The same classifier is used
in the work of (Weinmann et al., 2015) and (Nikolov
and Madsen, 2020) and is proven to provide good re-
sults, when used with 3D surface features.
4 EXPERIMENTAL SCENARIOS
AND RESULTS
Initially a simple classification scenario is test, us-
ing control reconstructed sandpaper patches. These
patches are then classified by the trained Random For-
est algorithms, to prove that the selected features can
describe the surface of sandpaper patches of differ-
ent grit size. After that a second testing scenario is
proposed, using decommissioned wind turbine blades
and classifying their surface depending on how close
it resembles different sand paper grits.
The control sandpaper patches are from a differ-
ent brand and represent again three different grit sizes
- a rough large grit size P40, a medium grit size P80
and a fine small grit size P180. They are reconstructed
using the same capturing protocol given in Subsection
3.2. The reconstructions are shown in Figure 5. These
reconstructions are then used as testing data, to deter-
mine if the chosen features could describe unknown
sandpaper surfaces, before transferring the knowledge
to blade surfaces. The prediction results are given in
Table 2. It can be seen that the highest percentage
prediction for each of the testing sandpaper patches,
showed in bold, corresponds to the real grit size of
VISAPP 2021 - 16th International Conference on Computer Vision Theory and Applications
804
(a) Linearity (b) Planarity (c) Sphericity (d) Omnivariance
(e) Anisotropy (f) Eigentropy (g) Sum of Eigenvalues (h) Local Surface Variation
Figure 3: Example local covariance features, extracted from the P40 sandpaper grit size. Just a small part of the sandpaper
leading edge is shown for easier visualization.
(a) D1 (b) D2 (c) D3 (d) D4 (e) A3
Figure 4: The five density metrics, used to calculate the statistical shape distributions, as proposed by (Osada et al., 2002).
(a) P40 (b) P80
(c) P180
Figure 5: The three sandpaper patches, used as an initial
test for how good are the used features for describing the
sandpaper surface.
that patch. Some of the other grit sizes are also de-
tected, as each of the patches contains smoother and
rougher areas. For the P180, some problems come
from the possible present reconstruction noise and
low frequency surface roughness (Figure 5(c)), which
can be classified as higher grit sizes.
For the second testing scenario three wind turbine
blades, with varying surface roughness are selected.
All the selected blades have been decommissioned
and contain both smooth and very rough and damaged
surface patches. One is a full blade, from which a
number of patches are selected for reconstruction and
the other two are smaller blade segments, which are
Table 2: Results from the initial sandpaper data test, show-
ing predictions for the three tested grit sizes P40, P80, P180
(horizontally). All three have been correctly predicted.
Grit Size P40 P80 P180
P40 0.761 0.013 0.002
P60 0.193 0.127 0.101
P80 0.029 0.696 0.010
P100 0.007 0.055 0.059
P120 0.003 0.104 0.253
P180 0.007 0.005 0.575
used whole for the experiments. Four patches are se-
lected from the full blade - two representing damaged
and very rough areas and two representing relatively
clean areas, with small amounts of surface roughness.
The large blade, together with the two blade segments
are shown in Figure 6.
(a) (b) (c)
Figure 6: The three wind turbine blades used for the second
experiment. Four patches with varying degree of rough-
ness are selected from the first large blade (Figure 6(a)),
while the other two segments (Figure 6(b) and 6(c)) are used
whole.
Quantifying Wind Turbine Blade Surface Roughness using Sandpaper Grit Sizes: An Initial Exploration
805
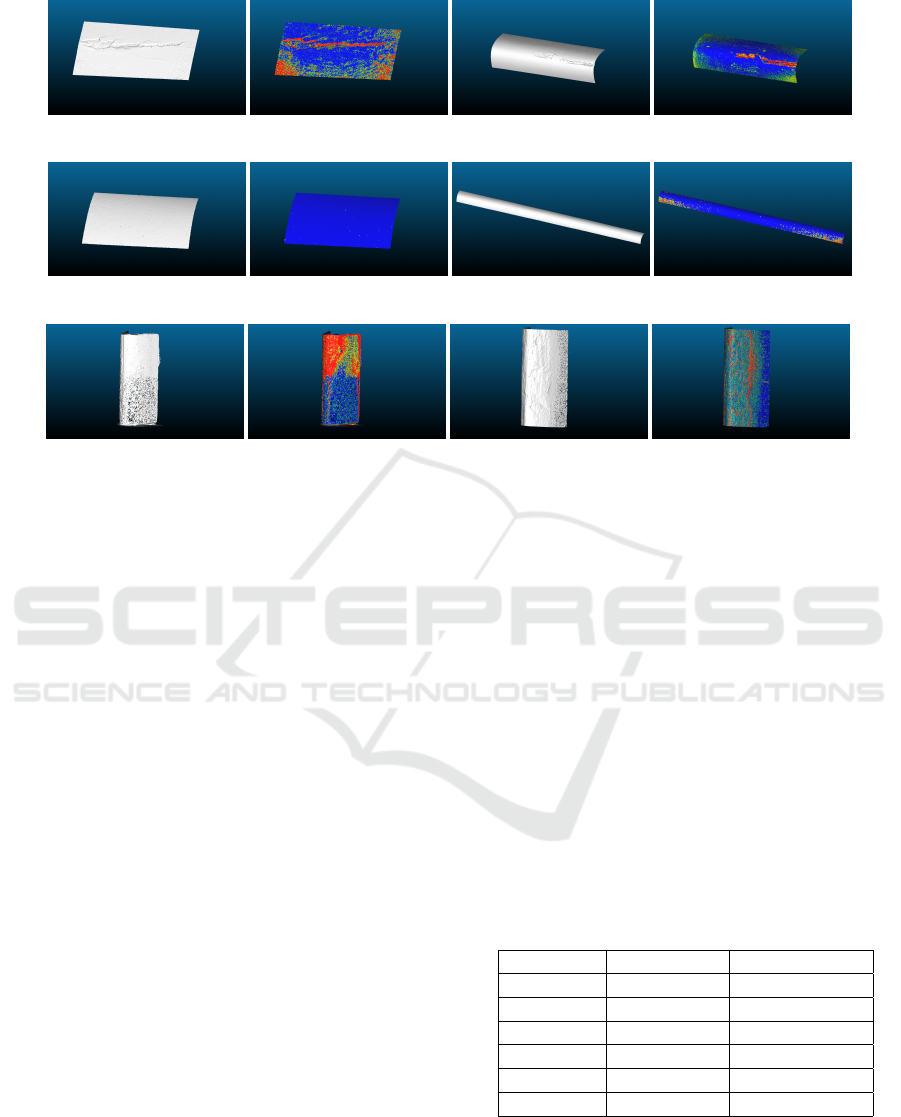
(a) Patch 1 (b) Patch 1 (c) Patch 2 (d) Patch 2
(e) Patch 3 (f) Patch 3 (g) Patch 4 (h) Patch 4
(i) Segment 1 (j) Segment 1 (k) Segment 2 (l) Segment 2
Figure 7: Results from segmentation of the wind turbine blades, visualized in pseudocolor, where P40 grit is shown as red
and P180 is dark blue, while the other grit sizes are the colors between them. Just the point cloud is also given for each, for
easier visualization of the roughness.
The four patches and two blade segments are
reconstructed using Metashape, following the same
capturing protocol presented in Subsection 3.2. The
selected features, presented in 3.3, are extracted from
the blade reconstructions and used as testing data for
the Random Forest classifier. The result point clouds
with pseudocolor information, on which sandpaper
roughness best describes each point is given in Fig-
ure 7. The P40 grit size is shown as red color and
the P180 as dark blue color, with all other grit sizes
represented with the in-between colors.
Because there is no ground truth for calculating
the accuracy of the surface classification, the rough-
ness of each of the blade segments is first calcu-
lated as the distance to a best fitting plane. Each
plane is fit to a spherical neighbourhood, which has
been heuristically selected to best describe all parts
of the point cloud. This is done through the use of
the roughness calculation functionality of CloudCom-
pare (Girardeau-Montaut, 2011). The distance be-
tween this roughness and our proposed method is then
computed for each point. The nominal average di-
ameter of the sandpaper grains given in Table 3.2 is
used. We then calculate their root mean square error
(RMSE) and standard deviation, which would give an
overview of how good the sandpaper roughness is fit
to the blade surface. These values are presented in
Table 3. It can be seen that the damaged surface parts
are mostly classified as a P40 grit, with the parts that
have varying degrees of roughness classified as the
smaller grit sizes. The P60 and P120 have the least
amount of point classified as them. The smooth and
clean surfaces, especially on the two patches (Figure
7(f) and 7(h)) and on the blade segments are repre-
sented with P180 grit size. From Table 3 it can be seen
that on average the rougher patches exhibit a higher
RMSE between the sandpaper representation and the
real roughness. The blade segments on Figure 7(j)
has a larger RMSE value, because the damages on it
exhibit roughness values, which far exceed the values
of the sandpaper grits. This testing scenario can be
very dependent on the selected parameters and addi-
tional testing is required, with examples presented in
the Future Work section 5.
Table 3: RMSE and standard deviation between the best fit-
ting plane roughness calculation and our proposed solution.
RMSE [mm] Std. Dev. [mm]
Patch 1 0.179 0.113
Patch 2 0.125 0.069
Patch 3 0.070 0.009
Patch 4 0.101 0.060
Segment 1 0.162 0.110
Segment 2 0.288 0.122
VISAPP 2021 - 16th International Conference on Computer Vision Theory and Applications
806

5 CONCLUSION AND FUTURE
WORK
In this paper we presented an idea for segmenting
wind turbine blade surfaces depending on the sandpa-
per grit size that best represents their roughness. This
solution aims to provide a standardized method clas-
sifying surface roughness of wind turbine blades that
can be used for calculating their energy output and
performance, as well as more easily modeling them
for tests in wind tunnels.
We selected six different sandpaper patches with
varying grit sizes and 3D reconstructed them using
SfM. We then extracted a number of geometrical, co-
variance and statistical features from neighbourhoods
with progressively smaller sizes. We used these fea-
tures to train a Random Forest classifier.
To test the proposed solution we first evaluated the
classier on a testing set of sandpaper patches. We
verified that the extracted features could be used to
identify each grit size of the training set. We then in-
troduced surface data from three wind turbine blades.
The data represented surfaces with varying degrees
of surface roughness and damages. These surfaces
were also 3D reconstructed and then used as a test-
ing dataset. We demonstrated that we Random For-
est classifier managed to sufficiently segment the sur-
faces and to represent their roughness as sandpaper
grit sizes.
The current research lacks an in-depth verification
of the robustness of the proposed methods. The next
steps for the current research can be divided in two
directions. The first direction requires the creation of
ground truth 3D surface scans of the test blades and
extracting the roughness from patches using a pro-
filometer. These surfaces can then be used for more
clear comparison to the proposed solution. The sec-
ond direction would require the use of a wind tun-
nel, where the performance of a damaged blade and a
blade with sandpaper of different grit sizes mounted
on surfaces defined by the proposed algorithm can be
compared.
REFERENCES
Agisoft (2010). Metashape. http://www.agisoft.com/. Ac-
cessed: 2019-09-20.
Al-Kaff, A., Moreno, F. M., San Jos
´
e, L. J., Garc
´
ıa, F.,
Mart
´
ın, D., de la Escalera, A., Nieva, A., and Garc
´
ea,
J. L. M. (2017). Vbii-uav: Vision-based infrastructure
inspection-uav. In World Conference on Information
Systems and Technologies, pages 221–231. Springer.
Amenabar, I., Mendikute, A., L
´
opez-Arraiza, A.,
Lizaranzu, M., and Aurrekoetxea, J. (2011). Com-
parison and analysis of non-destructive testing
techniques suitable for delamination inspection in
wind turbine blades. Composites Part B: Engineering,
42(5):1298–1305.
Bak, C., Gaunaa, M., Olsen, A. S., and Kruse, E. K. (2016).
What is the critical height of leading edge roughness
for aerodynamics. In Journal of Physics: Conference
Series, volume 753, page 022023.
Bentley, J. L. (1975). Multidimensional binary search trees
used for associative searching. Communications of the
ACM, 18(9):509–517.
Blomley, R., Jutzi, B., and Weinmann, M. (2016). Clas-
sification of airborne laser scanning data using geo-
metric multi-scale features and different neighbour-
hood types. ISPRS Annals of Photogrammetry, Re-
mote Sensing & Spatial Information Sciences, 3(3).
Chan, C. H. L., Wang, Q., Holden, R., Huang, S., and
Zhao, W. (2019). Optimal number of control points
for fitting b-splines in wind turbine blade measure-
ment. International Journal of Precision Engineering
and Manufacturing, 20(9):1507–1517.
Chen, X. (2018). Fracture of wind turbine blades in opera-
tion—part i: A comprehensive forensic investigation.
Wind Energy, 21(11):1046–1063.
Dastoorian, R., Elhabashy, A. E., Tian, W., Wells, L. J.,
and Camelio, J. A. (2018). Automated surface in-
spection using 3d point cloud data in manufactur-
ing: A case study. In International Manufacturing
Science and Engineering Conference, volume 51371,
page V003T02A036. American Society of Mechani-
cal Engineers.
Dittrich, A., Weinmann, M., and Hinz, S. (2017). Analytical
and numerical investigations on the accuracy and ro-
bustness of geometric features extracted from 3d point
cloud data. ISPRS Journal of Photogrammetry and
Remote Sensing, 126:195–208.
Du, Y., Zhou, S., Jing, X., Peng, Y., Wu, H., and Kwok,
N. (2020). Damage detection techniques for wind tur-
bine blades: A review. Mechanical Systems and Sig-
nal Processing, 141:106445.
El-Mesery, H. S., Mao, H., and Abomohra, A. E.-F. (2019).
Applications of non-destructive technologies for agri-
cultural and food products quality inspection. Sensors,
19(4):846.
FEPA (1955). Fepa - federation of european produc-
ers of abrasives. https://www.fepa-abrasives.com/
abrasive-products/grains. Accessed: 2019-03-06.
Genc, M. S., Kemal, K., and Ac¸ikel, H. H. (2019). Investi-
gation of pre-stall flow control on wind turbine blade
airfoil using roughness element. Energy, 176:320–
334.
Girardeau-Montaut, D. (2011). Cloudcompare-open source
project. OpenSource Project.
Hackel, T., Wegner, J. D., and Schindler, K. (2016). Fast se-
mantic segmentation of 3d point clouds with strongly
varying density. ISPRS annals of the photogramme-
try, remote sensing and spatial information sciences,
3:177–184.
Han, W., Kim, J., and Kim, B. (2018). Effects of contam-
ination and erosion at the leading edge of blade tip
Quantifying Wind Turbine Blade Surface Roughness using Sandpaper Grit Sizes: An Initial Exploration
807

airfoils on the annual energy production of wind tur-
bines. Renewable energy, 115:817–823.
ISO25178 (2012). Iso25178(2012) geometrical product
specifications (gps) — surface texture: Areal — part
2: Terms, definitions and surface texture parame-
ters. https://www.iso.org/obp/ui/#iso:std:iso:25178:
-2:ed-1:v1:en. Accessed: 2020-08-03.
ISO4287 (1997). Iso4287(1997) geometrical product spec-
ifications (gps) — surface texture: Profile method
— terms, definitions and surface texture parameters.
https://www.iso.org/standard/10132.html. Accessed:
2020-08-03.
ISO6344 (1998). Iso6344(1998) coated abrasives — grain
size analysis parts 1-3. https://www.iso.org/standard/
12643.html. Accessed: 2020-08-03.
Langel, C. M., Chow, R., Hurley, O. F., Van Dam, C.
C. P., Maniaci, D. C., Ehrmann, R. S., and White,
E. B. (2015). Analysis of the Impact of Leading Edge
Surface Degradation on Wind Turbine Performance.
In 33rd Wind Energy Symposium, Reston, Virginia.
American Institute of Aeronautics and Astronautics.
Langel, C. M., Chow, R., Van Dam, C., and Maniaci, D. C.
(2017). Rans based methodology for predicting the
influence of leading edge erosion on airfoil perfor-
mance. Technical report, Sandia National Lab.(SNL-
NM), Albuquerque, NM (United States).
Lowe, D. G. (2004). Distinctive image features from scale-
invariant keypoints. International journal of computer
vision, 60(2):91–110.
Martin, R. W., Sabato, A., Schoenberg, A., Giles, R. H., and
Niezrecki, C. (2018). Comparison of nondestructive
testing techniques for the inspection of wind turbine
blades’ spar caps. Wind Energy, 21(11):980–996.
Marzuki, O. F., Rafie, A. S. M., Romli, F. I., and Ahmad,
K. A. (2018). Magnus wind turbine: the effect of
sandpaper surface roughness on cylinder blades. Acta
Mechanica, 229(1):71–85.
Moreno, S., Pe
˜
na, M., Toledo, A., Trevi
˜
no, R., and Ponce,
H. (2018). A new vision-based method using deep
learning for damage inspection in wind turbine blades.
In 2018 15th International Conference on Electrical
Engineering, Computing Science and Automatic Con-
trol (CCE), pages 1–5. IEEE.
Nielsen, M., Nikolov, I., Kruse, E., Garnæs, J., and Madsen,
C. (2020). High-resolution structure-from-motion for
quantitative measurement of leading-edge roughness.
Energies, 13(15).
Nikolov, I. and Madsen, C. (2016). Benchmarking close-
range structure from motion 3d reconstruction soft-
ware under varying capturing conditions. In Euro-
Mediterranean Conference, pages 15–26. Springer.
Nikolov, I. and Madsen, C. (2020). Rough or noisy? metrics
for noise estimation in sfm reconstructions. Sensors,
20(19):5725.
Osada, R., Funkhouser, T., Chazelle, B., and Dobkin, D.
(2002). Shape distributions. ACM Transactions on
Graphics (TOG), 21(4):807–832.
Ozyesil, O., Voroninski, V., Basri, R., and Singer, A.
(2017). A survey of structure from motion. arXiv
preprint arXiv:1701.08493.
Peng, L. and Liu, J. (2018). Detection and analysis of large-
scale wt blade surface cracks based on uav-taken im-
ages. IET Image Processing, 12(11):2059–2064.
Rublee, E., Rabaud, V., Konolige, K., and Bradski, G.
(2011). Orb: An efficient alternative to sift or surf.
In 2011 International conference on computer vision,
pages 2564–2571. Ieee.
Schramm, M., Rahimi, H., Stoevesandt, B., and Tangager,
K. (2017). The Influence of Eroded Blades on Wind
Turbine Performance Using Numerical Simulations.
Energies, 10(9):1420.
Shihavuddin, A., Chen, X., Fedorov, V., Nymark Chris-
tensen, A., Andre Brogaard Riis, N., Branner, K.,
Bjorholm Dahl, A., and Reinhold Paulsen, R. (2019).
Wind turbine surface damage detection by deep
learning aided drone inspection analysis. Energies,
12(4):676.
Triggs, B., McLauchlan, P. F., Hartley, R. I., and Fitzgibbon,
A. W. (1999). Bundle adjustment—a modern synthe-
sis. In International workshop on vision algorithms,
pages 298–372. Springer.
Wang, L. and Zhang, Z. (2017). Automatic Detection of
Wind Turbine Blade Surface Cracks Based on UAV-
Taken Images. IEEE Transactions on Industrial Elec-
tronics, 64(9):7293–7303.
Weinmann, M., Jutzi, B., Hinz, S., and Mallet, C. (2015).
Semantic point cloud interpretation based on optimal
neighborhoods, relevant features and efficient classi-
fiers. ISPRS Journal of Photogrammetry and Remote
Sensing, 105:286–304.
Xu, D., Wen, C., and Liu, J. (2019). Wind turbine blade sur-
face inspection based on deep learning and uav-taken
images. Journal of Renewable and Sustainable En-
ergy, 11(5):053305.
Zhang, D., Burnham, K., Mcdonald, L., Macleod, C., Do-
bie, G., Summan, R., and Pierce, G. (2017a). Remote
inspection of wind turbine blades using uav with pho-
togrammetry payload. In 56th Annual British Confer-
ence of Non-Destructive Testing-NDT 2017.
Zhang, D., Watson, R., Dobie, G., MacLeod, C., Khan,
A., and Pierce, G. (2020). Quantifying impacts on
remote photogrammetric inspection using unmanned
aerial vehicles. Engineering Structures, page 109940.
Zhang, Y., Yuan, X., Fang, Y., and Chen, S. (2017b).
Uav low altitude photogrammetry for power line
inspection. ISPRS International Journal of Geo-
Information, 6(1):14.
Zhou, Q.-Y., Park, J., and Koltun, V. (2018). Open3D:
A modern library for 3D data processing.
arXiv:1801.09847.
VISAPP 2021 - 16th International Conference on Computer Vision Theory and Applications
808
