
The Effect of Resistance to Change on Students' Acceptance in a
Flipped Classroom Course
Christin Voigt, Kristin Vogelsang
a
and Uwe Hoppe
University of Osnabrück, Katharinenstr. 1-3, 49074 Osnabrueck, Germany
Keywords: TAM2, Flipped Classroom, Digital Education, Inertia, Resistance to Change, Quantitative Research.
Abstract: Digital technologies are increasingly used in higher education in so-called blended learning courses. A
growing popular course concept is the Flipped Classroom (FC). In an FC, knowledge is acquired at home and
deepened in the in-class time with the teacher. Compared to traditional teaching concepts, FC courses are
considered particularly effective in terms of learning success. However, the transformation to FC-concepts is
a big change for learners and students and often combines with a resistance to change. In this study we
investigate the effect of resistance to change (inertia) on the acceptance of Flipped Classroom courses from
the students' perspective. Teachers can use this knowledge to increase the attractiveness of FC.
1 INTRODUCTION
The use of digital technologies in university teaching
enables new forms of teaching and learning. Teachers
expect positive effects from so-called blended
learning courses (Lehmann et al. 2015). One variant
of blended learning is the Flipped Classroom (FC)
(Bergmann and Sams 2012). In the FC courses,
knowledge acquisition takes place at home. For this
purpose, digital technologies such as learning videos
or online quizzes are provided. The consolidation of
knowledge then takes place in the classroom
supervised by the teacher. Many studies prove the
positive influence of FC, especially in the area of
active, independent work and learning success
(Abeysekera and Dawson 2015; Sun et al. 2018),
(Voigt et al. 2020).
Despite its popularity, the FC concept is still
relatively new. For the students, it represents a clear
departure from the previous, lecturer-centered
teaching-learning arrangement. The success of an FC
depends largely on the acceptance of the stakeholders
involved. First studies use modifications of the well-
known Technology Accteptance Model according to
Davis (Davis 1986) to measure the acceptance of the
overall FC construct (Vogelsang and Hoppe 2018). In
contrast to the original variant, which focuses on the
use of a single technology, the entirety of the learning
a
http://orcid.org/0000-0003-2503-3207
unit represents the technology object in this case. The
TAM is suitable for measuring the attitude of the
target group towards certain aspects (such as the
quality of outcomes or the influence of social peers)
in connection with the use of the learning concept.
One aspect that has not yet been included in the
investigations is the resistance of students to accept
new concepts. This resistance is called inertia in
science and is an important and at the same time
difficult to grasp effect variable (Polites and
Karahanna 2012). Inertia is often an initial reaction to
changes. Only through the reduction of the resistance
to change a real acceptance of new technology
concepts such as the Flipped Classroom can take
place. Therefore, it is to be assumed that inertia
reduces acceptance. In this research, we want to close
the research gap mentioned above. The present paper
therefore aims to answer the following research
question (RQ):
RQ: What influence has the inertia on the
acceptance of a Flipped Classroom from the
students' perspective in our course?
To answer the research question, we have
developed a quantitative questionnaire, which is
tested in an FC course in the Master of Business
Informatics.
Voigt, C., Vogelsang, K. and Hoppe, U.
The Effect of Resistance to Change on Students’ Acceptance in a Flipped Classroom Course.
DOI: 10.5220/0010283800150022
In Proceedings of the 13th International Conference on Computer Supported Education (CSEDU 2021) - Volume 2, pages 15-22
ISBN: 978-989-758-502-9
Copyright
c
2021 by SCITEPRESS – Science and Technology Publications, Lda. All rights reserved
15

In a first step, we conduct a reliability and a factor
analysis to measure the suitability of the selected
items and constructs. Subsequently, we conduct a
regression analysis to show the interdependencies.
The resulting model provides researchers with
information about the connection between attitude-
related acceptance decisions and the resistance of the
target group, which is difficult to observe. Practical
implications for lecturers and program coordinators
can be derived from the model, which can lead to
acceptance-promoting measures.
2 THEORETICAL
FOUNDATIONS
Acceptance is used to measure the assent and
agreement of an individual, e.g. with a technology.
The best known model that deals with the explanation
and measurement of technology acceptance is the
Technology Acceptance Model according to Davis
(Davis 1986).
The TAM is based on the Theory of Reasoned
Action (Fishbein and Ajzen 1975). The essence of
this theory is that a behavioural intention precedes the
actual behaviour. Based on this assumption, human
actions can be explained and predicted to a certain
degree. The TAM assumes that the intention to use a
system (intention to use) precedes the actual use. The
intention to use (IU) is explained in the original
acceptance model by two predictors (perceived ease
of use and perceived usefulness). Especially its easy
comprehensibility and high validity have contributed
to its wide dissemination (Vogelsang et al. 2013).
A large branch of research is concerned with
investigations on the validity of the TAM in different
contexts such as the working world (Venkatesh et al.
2012) or the university (Park 2009). In the course of
time numerous extensions of the TAM have been
developed. Often external variables such as age or
experience of the users are used (Venkatesh et al.
2003). In addition, the model is extended by factors
from other models in order to increase the accuracy
of the information. One such extension is the TAM2
(Venkatesh and Davis 2000). In this model the core
dimensions are preceded by predictors from the area
of cognitive-instrumental and social components.
The TAM and its extensions are still valid today.
It is also often used to explain the intended use of
scenarios in which technology plays an important
role. For example, acceptance studies are used to
measure the acceptance of blended learning events
(Abeysekera and Dawson 2015; Padilla-Meléndez et
al. 2013). Here, the intention of use is not aimed at the
use of the technology alone, but rather at the overall
concept.
While the acceptance studies focus on the
presence of positive reinforcing factors, there are of
course also factors whose presence can weaken the
intention to use the technology. The inertia or
resistance to change is a difficult construct to grasp,
as it is primarily expressed through strongly anchored
attitudes. Inertia or resistance to change describes
remaining in old habits even though better
alternatives are available. Inertia research has its
origin in consumer research, whereby inertia in this
environment means remaining loyal to a brand
instead of choosing new, different or even better
alternatives (Murray and Häubl 2007). The
investigation of the phenomenon takes place in
different scenarios. For example, the influence of
inertia on the use of IS (information systems) (Polites
and Karahanna 2012) is investigated. Inertia is based
on individual habits.
Inertia expresses itself by remaining with familiar
structures and thus counteracts acceptance. However,
the influence of inertia on user acceptance has not yet
been investigated. In general, the negative aspects of
changing a learning scenario are rarely discussed
(Vogelsang et al. 2019).
3 RESEARCH MODEL AND
SAMPLE
TAM2 (Venkatesh and Davis 2000) was chosen as
the initial model for the investigation. Only a few
modifications are necessary to adapt to the present FC
scenario. First, all external variables were removed
from the model. We assume a high homogeneity of
the selected sample with respect to experience, age
and voluntariness. As predictors, output quality (OQ)
was chosen as the cognitive and subjective norm (SN)
as the social component. Output quality measures the
students' attitude towards improvements through the
new concept and its advantages. The subjective norm,
on the other hand, measures the influence of fellow
students with regard to the new concept. The image
used in TAM2 was excluded, since an image gain of
the students via a course to be taken voluntarily is not
considered relevant. Instead, the other cognitive
components, job relevance and result
demonstrability, were adapted to the university
context and replaced by the construct of expected
effort used in the Unified Theory of Acceptance and
Use of Technology (Venkatesh et al. 2003). It can be
CSEDU 2021 - 13th International Conference on Computer Supported Education
16

assumed that students compare exactly the effort of
the course with the expected results. Therefore, it is
assumed that this construct is more applicable than
the presentation of the success, which only becomes
visible as the exam result at the end of the course.
Thus, we use a model that examines the influence
of perceived ease of use (EoU) and perceived
usefulness (PU) on the intention to use (UI), as well as
the effect of EoU on PU. Predictors of PU are,
according to the theoretical basis, the output quality
(OQ), the subjective norm (SN) and the expected effort
(EE). The influence of the inertia (RC) on the intention
of use and the perceived usefulness should also be
tested. In addition, we want to test whether these
predictors EE, OQ and SN have an effect on the inertia.
In our questionnaire, the individual factors are each
measured with three to four items. Figure 1 shows all
influences to be tested in our research model.
Figure 1: Research Model.
The following hypotheses can be derived from this
research model: Hypotheses H01 a) to H01 c) address
the connections from the original TAM model.
H01a) In our FC course, the perceived usefulness
affects the intention of use.
H01b) The perceived ease of use has an effect on
the intention of use in our FC course.
H01c) The perceived ease of use affects the
perceived usefulness in our FC course.
H02 a) to H02 c) test the effects of TAM2.
H02a) The subjective norm affects the perceived
usefulness in our FC course.
H02b) The expected effort affects the perceived
usefulness in our FC course.
H02c) The result quality has an effect on the
perceived usefulness in our FC course.
Hypotheses H03a) to H04c), on the other hand,
address the inertia in FC:
H03a) Inertia affects the perceived usefulness in
our FC course.
H03b) In our FC course, inertia affects the
intention of use.
H04a) In our FC course, the results quality has an
effect on the inertia.
H04b) The expected effort has an effect on the
inertia in our FC course.
H04c) The subjective norm has an effect on the
inertia in our FC course.
For the purpose of data collection, a written,
voluntary and anonymous survey of students was
conducted in the winter semester 2017/18 at the last
session of the course "Project Management", which is
designed as a Flipped Classroom. Within this course,
students will be provided with audio-supported slides
as video clips during the online time. Based on this,
activating methods such as case study work and
literature discussions will be carried out during the
attendance time to deepen the students' knowledge.
A total of 40 students took part in the survey.
Among the participants, 62% were male and 26%
female. 95% of all participants took part in the lectures
in the classroom, 82.5% in the guest lecture and 70%
used the group work. The most frequent reason given
for non-participation was the overlap with other
courses, with 7.5% of participants. 5% had parallel
work placements or jobs and 2% of the students stated
that they did not participate in at least one of the
classroom sessions due to the increased workload.
The survey contains 23 quantitative questions,
which were assigned to the seven different factors.
The data evaluation consists of two steps: In the
first part, the survey is verified for statistical quality
criteria, in particular reliability and validity. For this
purpose, the reliability analysis and the factor
analysis are carried out and the theoretical framework
is adapted to the results. In the second step, the
significant correlations are examined by means of
regression analyses to test the influences shown in the
above research model. A total of four regression
models are used with the dependent variables:
intention to use, perceived usefulness, perceived ease
of use and inertia.
The Effect of Resistance to Change on Students’ Acceptance in a Flipped Classroom Course
17
4 MODEL VERIFICATION
The first step of the analysis aims at the composition
of the questionnaire. First, the factors are verified and
adjusted by means of reliability analysis. In the course
of the reliability analysis, two items are removed that
were originally assigned to the factor perceived
usefulness. Cronbacs Alpha is thus 0.770. Table 1
shows the Cronbachs alpha and the item scale
correlation for all items after removing the two items.
Table 1: Cronbachs Alpha.
Factor
Item
Cronbachs
Alpha, if Item
is left out
Item Scale
Correlation
Intention to
use (IU)
IU1 0.736 0.280
IU2 0.746 0.100
IU3 0.741 0.180
Inertia (RC)
RC1 0.737 0.275
RC2 0.713 0.540
RC3 0.769 0.439
RC4 0.703 0.678
Items
Perceived
usefulness
(PU)
PU1 0.734 0.292
PU3 0.742 0.195
Items Ease of
Use (EoU)
EoU1 0.720 0.481
EoU2 0.721 0.489
EoU3 0.730 0.364
Output
Quality (OQ)
OQ1 0.726 0.423
OQ2 0.738 0.229
EE1 0.749 0.020
Expected
Effort (EE)
EE2 0.748 0.127
EE3 0.741 0.232
RC5 0.728 0.366
PU2 0.740 0.228
Subjective
Norm (SN)
SN1 0.715 0.619
SN2 0.728 0.419
SN3 0.727 0.407
The designations of the items refer to the final
order after factor analysis.
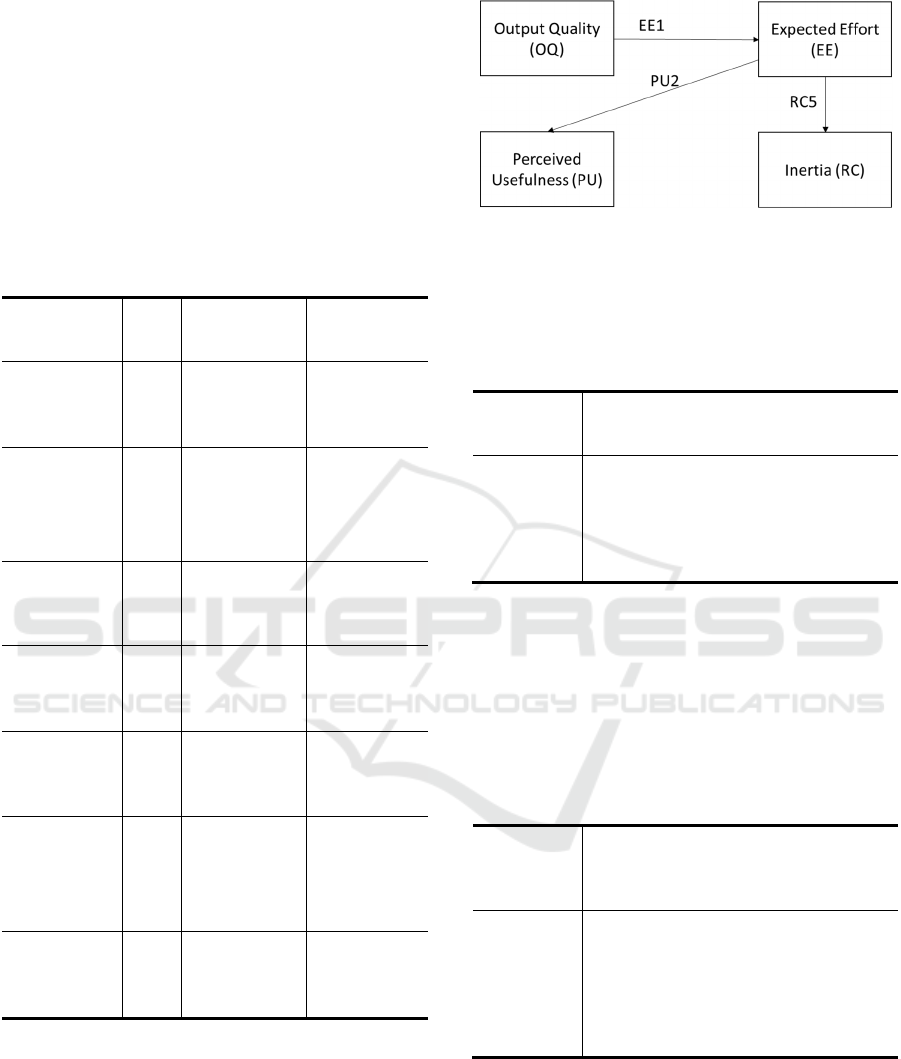
For further analysis, all items were coded
uniformly. For example, item RC3 was coded
negatively and PU2 and PU3 positively. Furthermore,
factor analysis was used to confirm the seven factors
IU, PU, EoU, OQ, EE, SN and RC, which are each
measured with 3 to 5 items. Figure 2 shows all new
item-classifications.
Figure 2: Factor Analysis.
As shown in Table 2, the intention to use is
measured by the willingness to reapply such a
learning concept in our FC course.
Table 2: Items Intention to Use.
Items:
Intention to
Use (IU)
Formulation
IU1
I would choose to attend such a learning
concept again.
IU2
I would like to see more learning concepts
of this kind.
IU3
I would also take other courses with such
learning concepts.
The perceived usefulness, on the other hand, is
characterized by an expected improvement in one's
own exam preparation and an expected increased
learning success due to the Flipped Classroom. The
final items are shown in table 3. During factor
analysis, PU2 was reassigned to the perceived
usefulness.
Table 3: Items Perceived Usefulness.
Items:
Perceived
Usefulness
(PU)
Formulation
PU1
My learning success is increased by such
a learning concept.
PU2
I have the feeling that such a learning
concept negatively influences my learning
success.
PU3
I feel badly prepared for the exam because
of the learning concept.
The items of the factor perceived ease of use is
shown in table 4 and asked whether the various
elements of online time were easy for students to use.
There were no changes during factor analysis for
EoU.
CSEDU 2021 - 13th International Conference on Computer Supported Education
18

Table 4: Items Ease of Use.
Items: Ease
of Use (EoU)
Formulation
EoU1 I find it easy to use the video tutorials.
EoU2
I consider the videos to be simple to
handle
EoU3
I find it easy to work with the videos the
way I want to.
After factor analysis, the expected effort is
measured by the perceived appropriateness of the
cost-benefit ratio, a perceived increase in the
workload due to the use of the Flipped Classroom, as
well as by the workload compared to other learning
concepts that are not designed as FC courses as shown
in table 5.
Table 5: Items Expected Efford.
Items:
Expected
Effort (EE)
Formulation
EE1
The amount of work and the result of the
learning concept are appropriate.
EE2
If all lectures were designed in this way,
the study effort would be too high for me.
EE3
I believe that such a learning concept
increases my study workload.
The factor subjective norm, on the other hand, is
shown in table 6 measured by the attitude of the
fellow students towards the Flipped Classroom as
well as by the general image of such a learning
concept.
Table 6: Items Subjective Norm.
Items:
Subjective
Norm (SN)
Formulation
SN1
Most of my fellow students think that it is
good to participate in such a learning
concept.
SN2
My fellow students support the
participation in such a learning concept.
SN3 My friends like the learning concept.
Table 7 shows the items of OQ. Since EE1 was
ordered from OQ to EE in the course of the factor
analysis, OQ is only measured with two items.
Table 7: Items Qutput Quality.
Items:
Output
Quality (OQ)
Formulation
OQ1
I believe that the learning concept
improves the teaching in general during
studies.
OQ2
I am aware of the advantages of the
learning concept in general.
The inertia is shown in Table 8 and is
characterized by the perceived stress and by
remaining in the status quo. Item RC5, which was
originally assigned to the effort expectation, was
added.
Table 8: Items Inertia.
Items Inertia
(RC)
Formulation
RC1 I prefer the familiar to new structures.
RC2
When I hear that innovations are pending,
I feel stressed.
RC3 I am open to innovation.
RC4 I rely on established concepts.
RC5
The thought of the new learning concept
has stressed me.
These newly sorted factors form the basis for
further analysis.
5 REGRESSION ANALYSIS
In the second part of the statistical analysis, the
regression models are assessed to reveal significant
influences. Based on the previously formulated
hypotheses, a total of three models could be estimated
with the dependent variables: Perceived usefulness,
intention to use and inertia. All factors that have an
effect on the ten percent or lower significance level in
at least one of the two regressions are presented. The
parameters, significance levels and T-values of all
regression models are shown in Table 9 - 11.
The perceived usefulness is shown in table 9. It
determined to be five percent significant in our FC
course and can be explained by 3.588
0.220 0.253 0.318.
The Effect of Resistance to Change on Students’ Acceptance in a Flipped Classroom Course
19

Table 9: Regression model for PU.
Factor
Perceived Usefulness
(PU)*
0.259 4.073
∝
Coef.
Constant p < 0.01 3.588 3.744
Perceived Ease of Use
(EoU)
p < 0.10 0.220 1.824
Output Quality (OQ) p > 0,10 - -
Expected Effort (EE) p < 0.10 0.253 1.940
Subjective Norm (SN) p > 0,10 - -
Inertia (RC) p < 0.05 -0.318 -2.278
Significance of the regression model: ** p < 0.01 * p < 0.05
As shown in table 9, it is positively influenced by
the perceived ease of use and the expected effort, and
negatively influenced by the inertia. The strongest
influence on PU is the inertia. The subjective norm
and the output quality, on the other hand, have no
significant influence on the perceived usefulness in
our FC course.
Moreover, the regression model shown in table 10
is used to determine the intention to use and applies
to the one-percent significance level. It has the largest
of all estimated models and can be determined by
3.737 0.398 0.302
0.384.
Table 10: Regression model for IU.
Factor
Intention to Use
(IU)**
0.376, 7.218
∝
Coef.
Constant p < 0.01 3.737 4.092
Perceived Usefulness
(PU)
p < 0.05 0.398 2.566
Perceived Ease of Use
(EoU)
p < 0.05 0.302 2.470
Inertia (RC) p < 0.01 -0.384 -2.841
Significance of the regression model: ** p < 0.01 * p < 0.05
The strongest influence on the IU is the perceived
usefulness, which positively influences IU in addition
to the perceived ease of use. On the other hand, the
presence of inertia reduces the intention to use.
Finally, a regression model could also be
estimated for inertia as a target variable for the five
percent significance level. This allows it to be
determined by: 2.190 0.344 and is
only negatively influenced by the output quality.
Table 11: Regression model for RC.
Factor
Inertia (RC)*
0.100, 4.209
∝
Coef.
Constant p < 0.05 2.190 2.518
Output Quality (OQ) p < 0.05 -0.344 -2.052
Significance of the regression model: ** p < 0.01 * p < 0.05
No significant influence on the inertia could be
demonstrated for the quality of the result and the
subjective norm. Overall, our model is able to explain
37% of the effects on the intention of use.
6 HYPOTHESIS TESTING
First of all, it becomes apparent that all relationships
contained in the original TAM model can also be
observed in our FC. Hence, the perceived usefulness
has a positive effect on the intention to use. The
hypothesis H01a) can be confirmed. The perceived
ease of use also has an influence on the perceived
usefulness and the intention to use: the higher EoU is,
the higher is IU and PU in our FC course. Thus,
hypotheses H01b) and H01c) are both supported.
However, the relations we suspect from
hypotheses H02a) to H02c) cannot be completely
confirmed. Only the expected effort affects the
perceived usefulness as predicted, but not the output
quality and the subjective norm. The higher the
expected effort is, the higher is the perceived
usefulness. As shown in Table 5, EE is to be
interpreted as a fair cost-benefit ratio and as an effort
perceived as appropriate for the course. In our Flipped
Classroom, however, the subjective norm has no
influence on PU. Thus, the hypotheses H02a) and
H02c) are rejected, while H02b) can be confirmed.
The inertia also has an effect on both the
perceived usefulness and the intention to use. Hence,
a high general resistance to change leads to a lower
intention to use the teaching concept, the hypotheses
H03a) and H03b) are both supported. The inertia can
in turn be explained by the output quality: A higher
output quality reduces the inertia. Hypothesis H04b)
can be confirmed. Thus, the higher the generally
known advantages and the importance of the teaching
concept for the study, the lower the resistance to
change. While the output quality in the FC model
without inertia would has no influence on the
perceived usefulness and the intention of use in our
course, in the acceptance model shown above it has
an indirect effect on IU and PU via the inertia.
CSEDU 2021 - 13th International Conference on Computer Supported Education
20

Hypotheses H04a) and H04c), on the other hand,
must be rejected, since there was no significant
influence of the expected effort and the subjective
norm on the inertia. Thus, the subjective norm has no
effect in our FC course as a whole.
7 IMPLICATIONS
From the regression models determined in Chapter 5,
an acceptance model of our Flipped Classroom course
can be derived, which describes the influences of the
students' intention to use a new teaching concept such
as FC. The acceptance model is shown in Figure 3.
In the teaching context, our model means that
students are not dependent on the opinions of their
fellow students when deciding to take part in an FC.
Figure 3: Acceptance Model.
More important are expected effort and the
expected output quality. The general, positive
assumptions about the concept reduce resistance and
negative feelings towards the change. For teachers
and program coordinators it is therefore important
that the advantages of an FC can be communicated
and promoted. These measures lead to an increased
intention to use the concept by students through the
predictors of perceived usefulness and ease of use. As
described in Chapter 4, this perceived usefulness
refers to the individual advantages for exam
preparation and the expected learning success. Such
an increase in learning success in FC has already been
observed in previous studies using activating methods
and improved feedback (Giannakos et al. 2014). In
order to increase the perceived ease of use, which
influences the perceived usefulness and thus also the
intention to use, the university could produce
explanatory videos that make it easier for students to
use digital media.
8 CONCLUSION
In the acceptance model of our FC course, we have
shown that the students' intention to use the new
technologies in education can be predicted by the
perceived usefulness and perceived ease of use.
Social components, on the other hand, have no
influence - in addition to the results of TAM2. Davis
already shows that the influence of the subjective
norm decreases over time (Venkatesh and Davis
2000). Since our examined sample is a master course,
an identical effect seems logical. Thus, the opinion of
other students does not influence the decision to
attend such a teaching concept. Cognitive
components are the main focus of this model to
explain the use of FC. In our FC course, the output
quality plays a special role, since it can reduce the
influence of the inertia. A positive ratio of effort to
benefit also promotes acceptance. This shows that
students are quite willing to achieve a lot if the effort
leads to a positive result.
Especially in times of the Corona Pandemic,
where many digital teaching materials have been
created, the future integration of a Flipped Classroom
is particularly useful. Because in such blended
learning concepts, the newly created digital media
can continue to be used profitably, when face-to-face
teaching is possible again. Both at this point in time
and at times when exclusive online teaching is
integrated, student acceptance is of central
importance for the success of studies. With our
model, we therefore aim to contribute towards
understanding resistance to change in order to
facilitate the integration of such teaching concepts
today and in future.
The limitations of our acceptance model are
initially to be found in the small sample of 40
students. Furthermore, the results are case-related and
apply to the Flipped Classroom concept presented
above. FCs can be designed differently, which could
have an influence on the statistical results and must
be considered in the interpretation. Furthermore, the
low
value of the regression model for RC suggests
that there are other factors affecting the inertia that
we have not considered. Therefore, there is no claim
to completeness of the model. Future research could
on the one hand verify whether our acceptance model
can be confirmed in other Flipped Classrooms with
different conditions and especially with and with a
larger number of participants and on the other hand
supplement missing influencing factors of the
resistance to chan. In addition, it could be examined
whether the influence of the subjective norm depends
on how far the students have progressed in their
The Effect of Resistance to Change on Students’ Acceptance in a Flipped Classroom Course
21

studies, and also whether the subjective norm is also
absent in earlier courses, for example in the
Bachelor’s degree. We, therefore, call for further
research analysing the connection between TAM and
digital course concepts.
REFERENCES
Abeysekera, L., and Dawson, P. 2015. “Motivation and
Cognitive Load in the Flipped Classroom: Definition,
Rationale and a Call for Research,” Higher Education
Research & Development (34:1), pp. 1–14.
Bergmann, J., and Sams, A. 2012. Flip Your Classroom:
Reach Every Student in Every Class Every Day,
Alexandria: International Society for technology in
Education.
Davis, F. D. 1986. “A Technology Acceptance Model for
Empirically Testing New End-User Information
Systems: Theory and Results,” Doctoral Dissertation,
Doctoral Dissertation, Massachusetts Institute of
Technology.
Fishbein, M., and Ajzen, I. 1975. Belief, Attitude, Intention
and Behavior – An Introduction to Theory and
Research, Reading MA: Addison-Wesley.
Giannakos, M. N., Krogstie, J., and Chrisochoides, N. 2014.
“Reviewing the Flipped Classroom Research:
Reflections for Computer Science Education,” in
Proceedings of the Computer Science Education
Research Conference, CSERC ’14, New York, NY,
USA: ACM, pp. 23–29.
Lehmann, K., Oeste, S., Janson, A., Söllner, M., and
Leimeister, J. M. 2015. “Flipping the Classroom – IT-
Unterstützte Lerneraktivierung Zur Verbesserung Des
Lernerfolges Einer Universitären
Massenlehrveranstaltung,” HMD Praxis Der
Wirtschaftsinformatik (52:1), pp. 81–95.
Murray, K. B., and Häubl, G. 2007. “Explaining Cognitive
Lock-in: The Role of Skill-Based Habits of Use in
Consumer Choice,” Journal of Consumer Research
(34:1), pp. 77–88.
Padilla-Meléndez, A., del Aguila-Obra, A. R., and Garrido-
Moreno, A. 2013. “Perceived Playfulness, Gender
Differences and Technology Acceptance Model in a
Blended Learning Scenario,” Computers & Education
(63), pp. 306–317.
Park, S. Y. 2009. “An Analysis of the Technology
Acceptance Model in Understanding University
Students’ Behavioral Intention to Use e-Learning,”
Journal of Educational Technology & Society (12:3), p.
150.
Polites, G. L., and Karahanna, E. 2012. “Shackled to the
Status Quo: The Inhibiting Effects of Incumbent
System Habit, Switching Costs, and Inertia on New
System Acceptance.,” MIS Quarterly (36:1), pp. 21–42.
Sun, Z., Xie, K., and Anderman, L. H. 2018. “The Role of
Self-Regulated Learning in Students’ Success in
Flipped Undergraduate Math Courses,” The Internet
and Higher Education (36), pp. 41–53.
Venkatesh, V., and Davis, F. D. 2000. “A Theoretical
Extension of the Technology Acceptance Model: Four
Longitudinal Field Studies,” Management Science
(46:2), pp. 186–204.
Venkatesh, V., L, J. Y. T., and Xu, X. 2012. “Consumer
Acceptance and Use of Information Technology:
Extending the Unified Theory of Acceptance and Use
of Technology,” MIS Quarterly (36:1), pp. 157–178.
Venkatesh, V., Morris, M. G., Davis, G. B., and Davis, F.
D. 2003. “User Acceptance of Information Technology:
Toward a Unified View,”
MIS Quarterly (27:3), pp.
425–478.
Vogelsang, K., Droit, A., and Liere-Netheler, K. 2019.
“Designing a Flipped Classroom Course–a Process
Model,” in Proceedings of the 14th International
Conference on Wirtschaftsinformatik, pp. 345–359.
Vogelsang, K., and Hoppe, U. 2018. “Development of an
Evaluation for Flipped Classroom Courses,” in
Proceeding of Multikonferenz Der
Wirtschaftsinformatik (Mkwi), Lüneburg, pp. 821–832.
Vogelsang, K., Steinhueser, M., and Hoppe, U. 2013. “A
Qualitative Approach to Examine Technology
Acceptance,” in Proceedings of the International
Conference on Information Systems, Milan, December
16.
Voigt, C., Blömer, L., and Hoppe, U. 2020. The Course
Design Does Matter: Analyzing the Learning Success
of Students.
CSEDU 2021 - 13th International Conference on Computer Supported Education
22
