
Exploring Different User Interfaces for Velocity based Training using
Smart Gym Machines: Pilot Study
G
¨
unter Alce
1 a
, Jakob H
˚
akansson
2 b
and Andreas Espinoza
2 c
1
Design Sciences, Lund University, Sweden
2
Advagym, Sweden
Keywords:
Internet of Things, Training, Health, User Interface.
Abstract:
With the emerging technology called the Internet of Things (IoT), we can now connect computing devices
and sensors to the Internet. The IoT sensors serve to collect data, pushing it and sharing it with a whole
network of connected devices. We decided to explore how to utilize IoT data to increase the user experience
from a commercial gym application called Advagym. Advagym is a commercial solution already available in
the market, which aims to digitize the gym experience, where a retrofit solution is used to fit IoT devices on
gym machines to track performance data from users’ workouts. The main goal of this paper is to utilize IoT
data from Advagym’s IoT sensors for velocity-based training (VBT) and conduct a comparative study of three
different user interfaces presenting VBT data to increase the user experience. The main contribution of this
paper is an analysis of user preferences regarding the user interface of VBT feedback during a gym workout.
1 INTRODUCTION
It is becoming more and more common to exercise
regularly. According to a large annual health sur-
vey for the USA (Stobbe, 2018), more people exer-
cise enough each week to meet the USA’s government
recommendations for both muscle strengthening and
aerobic exercise in the USA. This trend is reflected
in the amount of new mobile applications which is
being continuously added to AppStore and Google
Play. Several smartphone applications are attempting
to help people training at a gym to log their training
progress. Examples of such applications are “Fitness
Buddy” and “JeFit” which are available both for iOS
and Android. But, most of these applications force the
user to enter the results manually, meaning that after
each performed sequence of repetition (set), the user
has to pick-up the phone and manually write their re-
sult in an application or using pen and paper. This is
a problem since it interrupts the focus of the workout.
On the other hand, if you do not take note right away,
you will most likely forget or write a more positive
number. A more intuitive way would be to log this
data automatically with the help of sensors connected
a
https://orcid.org/0000-0001-9112-2414
b
https://orcid.org/0000-0002-8309-561X
c
https://orcid.org/0000-0001-6189-0121
to the phone and the workout machines. This could
be achieved with the emerging technology called the
Internet of Things (IoT).
With IoT, we can connect computing devices and
sensors to the Internet. IoT does not have a real aca-
demic definition, but Preece et al. (2011) define IoT
as “a system of connected computing devices, me-
chanical and digital machines, objects, animals, or
people that are provided with a unique identifier and
the ability to transfer data over a network.” The IoT
sensors serve to collect data, push the data, and share
the data with a whole network of connected devices.
IoT sensors could be used to track the user’s perfor-
mance and movements (Gubbi et al., 2013), connect-
ing, and gathering all the data from and about the user.
Advagym (2015) is a commercial solution already
available in the market, which aims to use IoT de-
vices mounted on gym machines to track performance
data from user’s workouts and digitizes the gym ex-
perience. The interaction between the IoT units and
the users is mainly through its smartphone applica-
tion which runs on both iOS and Android platforms.
Currently, the IoT devices attached to the machines
are gathering many types of data, of which some, are
never used or shown for the user. For example, an
accelerometer is used to detect movement and a time-
of-flight sensor is used to measure distance, the com-
bination is used to count the number of repetitions.
Alce, G., Håkansson, J. and Espinoza, A.
Exploring Different User Interfaces for Velocity based Training using Smart Gym Machines: Pilot Study.
DOI: 10.5220/0010271301130120
In Proceedings of the 7th International Conference on Information and Communication Technologies for Ageing Well and e-Health (ICT4AWE 2021), pages 113-120
ISBN: 978-989-758-506-7
Copyright
c
2021 by SCITEPRESS – Science and Technology Publications, Lda. All rights reserved
113

However, the actual data is not shown and could be
combined for other measurements, for example, Ve-
locity Based Training (VBT). VBT focus on the ve-
locity of the performed exercise movement rather than
the weight.
The main goal of this paper is to utilize IoT data
from Advagym’s IoT sensors for VBT and conduct
a comparative study of three different user interfaces
presenting VBT data to increase the user experience.
The main contribution of this paper is to elucidate
knowledge about which UI feedback of VBT given
for the “gym-goer” was preferred.
The next section presents relevant related work.
Then the Advagym is described followed by the eval-
uation, results, discussion, and conclusions.
2 RELATED WORK
Over recent years, there is a growing awareness of the
potential power and relevance that interactive media
applications can have in influencing people’s motiva-
tion and subsequent behavior. Recent work in the area
of persuasive technology, that is, technology inten-
tionally designed to change a person’s attitude or be-
havior, testifies to this effect (IJsselsteijn et al., 2006).
One can for instance use wearables and applications
such as RunKeeper, Fitbit, and Withings which helps
you to keep track of how much you exercise. How-
ever, more than half of the individuals who purchased
a wearable device stop using it and, one-third did so
before six months (Patel et al., 2015). One reason is
that current applications often hold a simple focus on
recording data and displaying it in statistical form to
the user for post-activity viewing. Moreover, they are
relatively well developed for running, walking, and
bicycling but they are not so useful for gym workout
nor for getting feedback during a workout.
Sankaran et al. (2016), evaluated HeartHab,
which is an application developed for Coronary
Artery Disease patients. The authors managed to in-
corporate behavior change techniques and design the-
ories into their mobile application. The application
focuses on presenting patient data of medication, pre-
scription, and exercise targets for walking or running,
no gym exercises.
Another example of an application tracking walk-
ing but tailored for a certain group of people is the
“WalkWithMe” application by Geurts et al. (2019).
WalkWithMe is a mobile application that supports
people with Multiple Sclerosis (pwMS) in walking.
The application can coach pwMS in achieving a per-
sonal goal over a period of 10 weeks. Geurts et
al. (2019) evaluated the application in a 10-week
field study with 13 pwMS subjects. They found that
WalkWithMe supports pwMS in achieving their goal.
Moreover, it has been proven that physical activity has
a positive effect on most of these symptoms. How-
ever, we believe that this kind of application would
benefit from utilizing gym exercises as well.
Yang (2015) investigated the use of real-time soni-
fication as a way to improve the quality and motiva-
tion of strength exercises. In the study’s case, a biceps
curl routine was investigated with a sonification sys-
tem and with the help of electromyography (EMG)
sensors and a Microsoft Kinect camera. When exer-
cising with the system, muscular and kinematic data
were collected and used to a custom-designed soni-
fication software which then generated real-time au-
ditory feedback. An initial pilot study showed that
providing real-time sonic feedback on a biceps curl
exercise can produce useful cues to a user and influ-
ence the quality of the exercise (Yang, 2015). A lat-
itudinal experiment was later on conducted to com-
pare exercising quality between a sonification group
and a control group that does not get any feedback.
The study showed that users with sonification real-
time feedback performed consistently better in terms
of movement velocity and effort.
There are multiple benefits to being fit. Some
studies suggest physical exercise and fitness are ben-
eficial for both younger and older people (Malina,
2010). One of the ideas of the new user interface is to
add a new way of achieving fitness through exercis-
ing. Consider exercise prescriptions for older adults.
The main objective of resistance training programs
for the majority of this population is to increase func-
tional performance (Vince, 2017). Muscle power is
also a superior determinant of physical function com-
pared to muscle strength. Therefore, utilizing VBT
as a strategy to improve functional abilities in older
adults appears logical. Performing resistance train-
ing with maximal concentric velocity has been shown
to be more effective at improving functional perfor-
mance in older adults (Vince, 2017).
For the ordinary gym-goer, the main focus of
their training progress usually has its focus on which
weight and amount of repetitions are being per-
formed. This way of training is well known and sim-
ple to understand as a beginner. But there are other
innovative ways to train and instead e.g. focus on the
velocity of the lift. As already mentioned VBT fo-
cuses on the velocity rather than the weight, which
can be useful to develop athletes that need explosive
movements (Mann, 2016).
This paper focuses on utilizing unused IoT data
for VBT and present it for the “gym-goer”, during a
workout by giving feedback on how well the exercise
ICT4AWE 2021 - 7th International Conference on Information and Communication Technologies for Ageing Well and e-Health
114
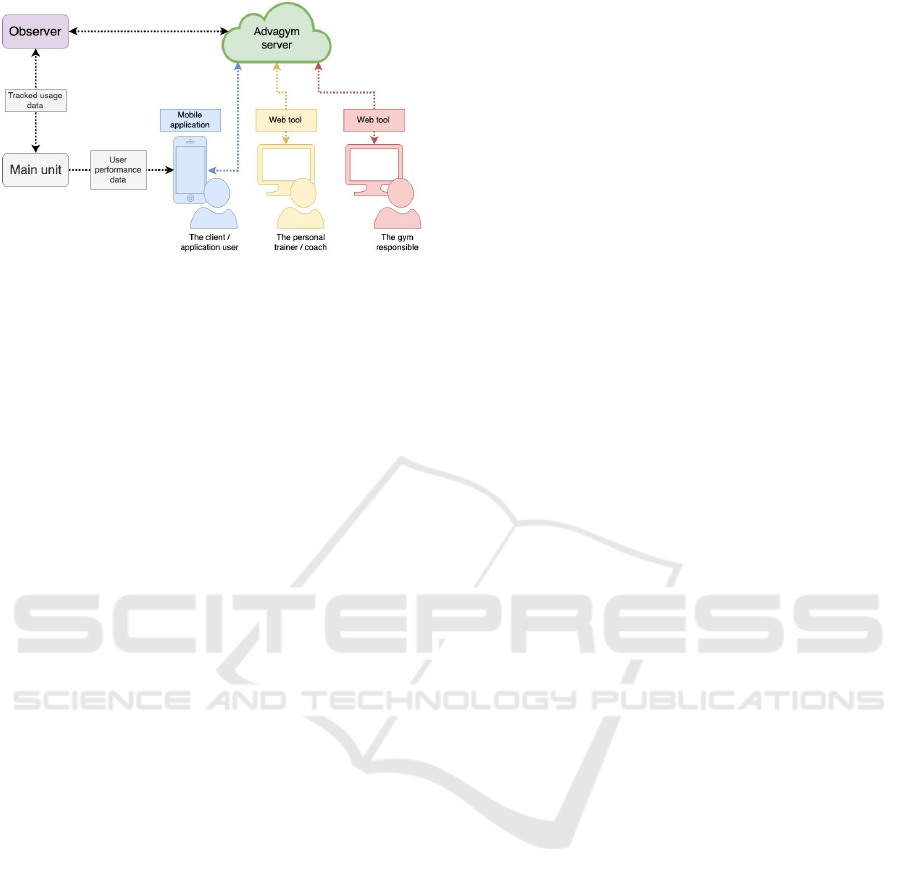
Figure 1: Illustrates the Advagym’s IoT data flow to differ-
ent users.
is performed, regarding the velocity.
3 Advagym
Advagym (2015) is a relatively new IoT solution to
digitize the gym experience, where a retrofit solution
is used to fit IoT devices on gym machines to track
performance data from users’ workouts. The system
offers different services, and there are different kinds
of users for each service. Examples of users of Ad-
vagym are The application user; The personal trainer
(PT); and The gym responsible (Figure 1). However,
this paper will focus on the application user, who with
the help of an iOS or Android application can train
and log their training automatically with exercise ma-
chines.
3.1 Advagym Hardware
In general IoT solutions often consist of three basic
components device, gateway, and cloud. The Ad-
vagym solution has a similar architectural structure.
There are three components called: main unit and
puck, observer, and Advagym server. The main unit
and puck, and the observer are connected to the Ad-
vagym server which is equivalent to the cloud. While
the observer corresponds to the gateway component,
and the main unit and puck are the IoT devices.
The main unit is the IoT device which does the
actual tracking of performed repetitions on an exer-
cise machine. Different sensors are used in the main
unit. An example of an included sensor is the ac-
celerometer, which is used to awaken the main unit
from its “sleep mode” (sleep mode is a battery con-
servative mode). Once the main unit is awake, the
firmware is booted up and starts tracking the vertical
movement with the help of the time-of-flight sensor.
By using a combination of these sensors and smart al-
gorithms, data packages for each repetition and their
movement will be broadcasted. The data package is
broadcasted multiple times through Bluetooth-Low-
Energy (BLE). The data packages sent are used both
for the user’s application to process, as well as for
the observer (Figure 1), to log. Each broadcasted
data package is dependent on two events of repeti-
tion, these events help to define the performance of a
repetition. Event 1: Occurs once the weight stack has
reached its max peak value of repetition. This means
that the max value of distance measured has been re-
ceived. Event 2: Occurs once the weight stack has
reached a lower value than the one measured in event
1 and is on its way up once again. The actual broad-
cast is also performed, at this event.
These events occur for each repetition of a set, ex-
cept for the very first repetition, where not all param-
eters of the package are set. The reason why not all
parameters of the data package are set of the first rep-
etition is due to the boot-up time of the main unit. It is
triggered by the accelerometer and it is done rapidly
but still, it will give some uncertainty on how far the
weight stack has traveled from its original position.
The movement of the main unit will only be on the
vertical axis since it is placed on the weight stack of
an exercise machine.
The puck has its main purpose to work as a con-
necting link between the main unit on the installed
machine to the user’s smartphone application. Mean-
ing that with the help of the puck, users can con-
nect their phone with the Advagym application, to the
chosen exercise machine which is connected to the
Advagym system. Depending on which smartphone
is used two different technologies are supported, For
iOS users, a BLE package is received from the puck
once the user “taps the puck”. For Android users
with near field communication (NFC) capabilities on
their smartphone, the same interaction is done, but the
package is received through NFC instead of a BLE
package. For Android users without NFC capabili-
ties, BLE is used instead. Regardless of which tech-
nology is used to receive the data packages from the
puck, the same information is provided and processed
in the smartphone application.
The observer has its main purpose of monitoring
the IoT units and acting as a gateway i.e. connecting
the gym to the Internet. The observer is placed in the
same area as the exercise machines to “listen” to all
the broadcasts which are done by the main units and
keep track of all the connected gym machines.
Exploring Different User Interfaces for Velocity based Training using Smart Gym Machines: Pilot Study
115
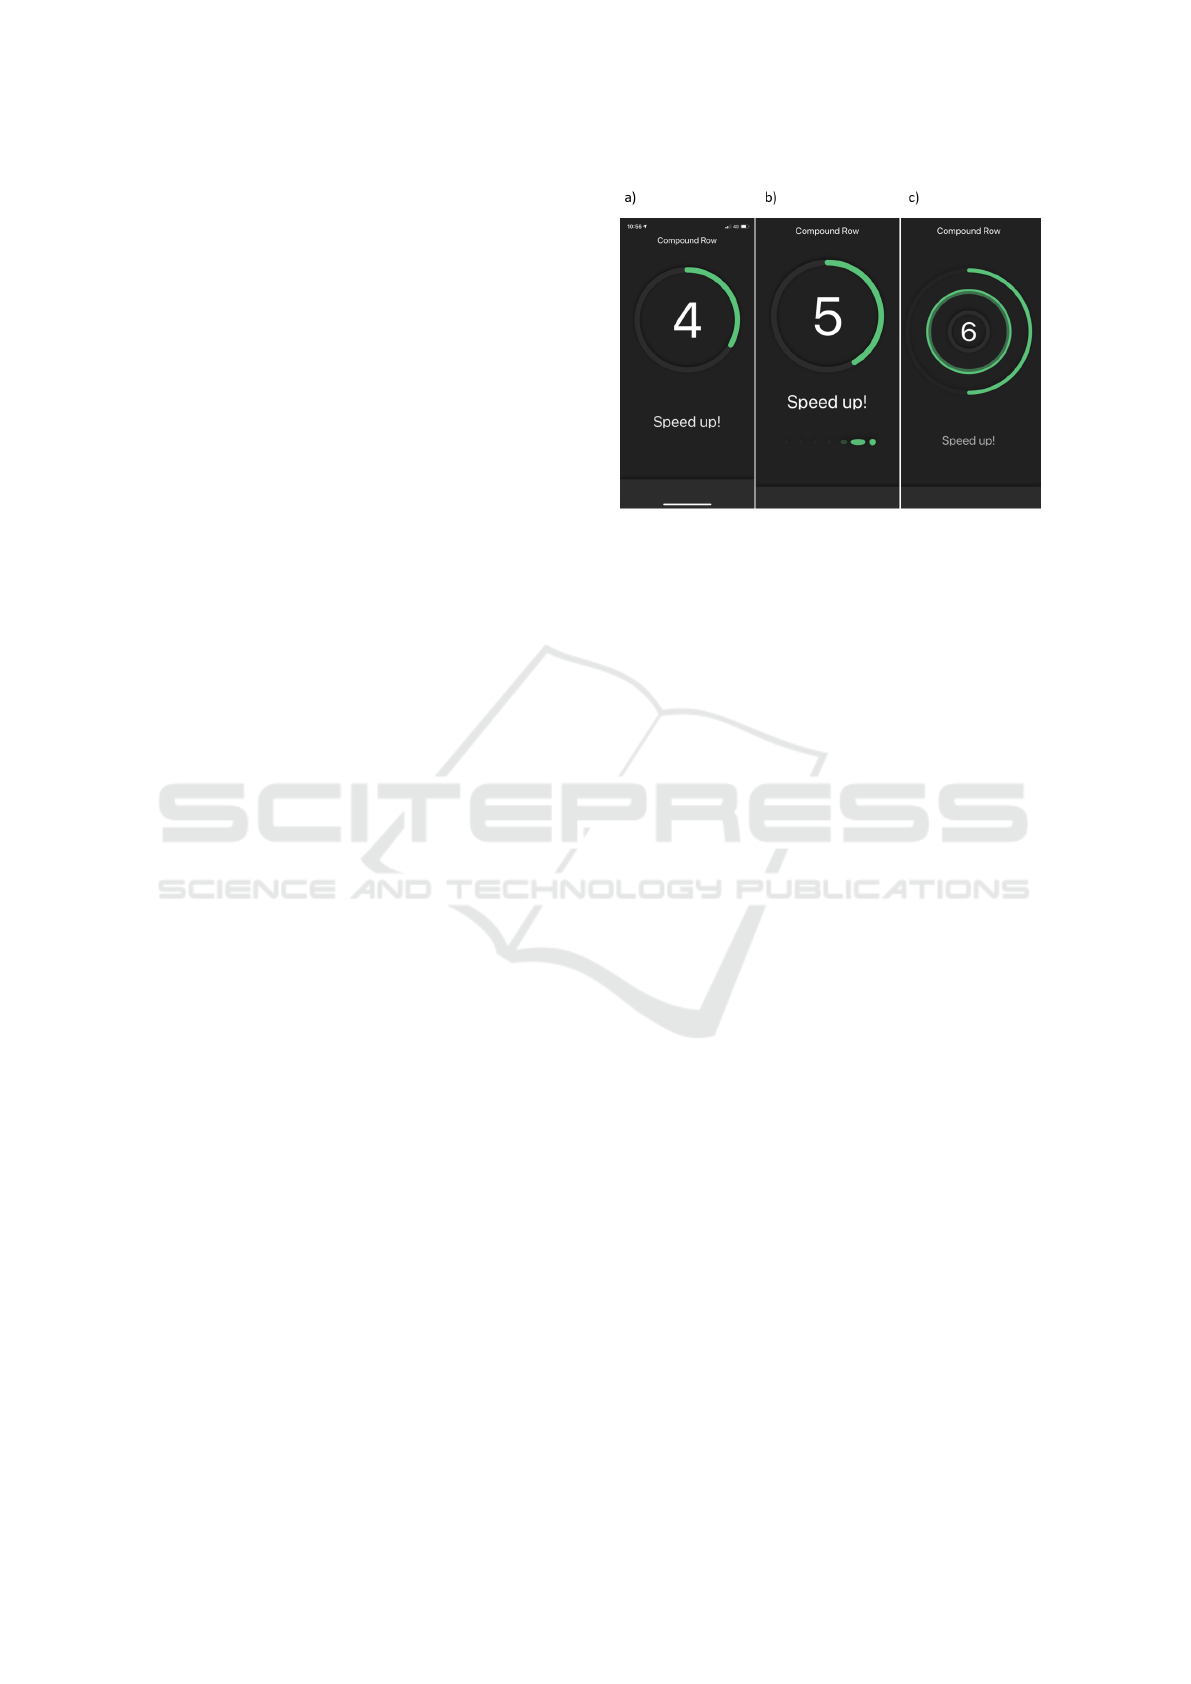
3.2 The UI for Velocity based Training
One of the main goals was to design and evaluate a set
of user interfaces (UIs) that utilize IoT data to give
feedback of the velocity to the users during a work-
out. First, a brainstorming session was conducted to
find out which IoT data was available and not used
(H
˚
akansson, 2019). During the brainstorming ses-
sion, it was noticed that the acceleration data from the
main unit was not used. This data could be used to
give feedback to the user during an exercise regarding
how fast or slow the user is performing the exercise.
The process of designing the feedback or the UIs was
performed in an iterative approach, starting with spe-
cific brainstorming sessions for the feedback and low-
fidelity prototypes, which were tested and refined. Fi-
nally, the UIs were developed and evaluated. The vi-
sual update is in the form of adding design patterns
with colors and forms which the Advagym applica-
tion uses. The reason for using resembling design
is to make the prototypes as realistic to the current
system as possible. Three different UIs were devel-
oped, referred to as “Text”, “Text and Guide Pendu-
lum” (TGP), and “Text and Guide Circle” (TGC), see
Figure 2.
3.2.1 Text
The first UI is only text feedback and is presented dur-
ing the movement of the performed repetition (Figure
2a).
3.2.2 Text and Guide Pendulum (TGP)
For the pendulum prototype, a green dot was used as
a pendulum movement. In addition, discrete dots in
the backgrounds worked as the field and outline of
the area within which the dot moved. The animation
of the movement also triggered the dots, creating a
more dynamic animation, making the pendulum feel
more like something moving with force in a direction
(Figure 2b). The repetition counter was modified to
match the design of the Advagym application. The
text feedback was positioned better in relation to the
surrounding elements as well as given an additional
animation for appearing and disappearing, where it
increases in scale and fades in, and after a predefined
time to match the repetition time, fades out (Figure
2b).
3.2.3 Text and Guide Circle (TGC)
The circle prototypes went through several iterations
until current testable versions were completed. The
outer indicator circle now serves as the repetition
Figure 2: The three Hi-Fi UIs: a) Text, b) Text and Guide
Pendulum (TGP), c) Text and Guide Circle (TGC). The
number in the center shows the repetition.
counter as well, where a percentage of the circle
stroke is filled with green color for how many repe-
titions have been performed compared to how many
are aimed to be performed. It has the same structure
as the repetition counter for the pendulum. An extra
visual was added to the circle tempo indicator, which
is an outer stroke, that gives the user a sense of which
direction the circle is going. If the circle is expand-
ing or shrinking, this would represent a concentric
movement or an eccentric movement. An extra ani-
mation was added to the outer repetition circle which
“pops” once the indicator circle meets the outer circle.
Early user studies indicated that this effect improves
the user experience and the users felt as if the motion
was more natural (Figure 2c).
4 EVALUATION
A user study was conducted to evaluate the different
prototypes, by letting all participants perform the ca-
ble row exercise in the office gym.
4.1 Setup
Both quantitative and qualitative data were col-
lected. Documentation of the active sessions was
done through video recordings from a Sony A6300
as an overview camera. Figure 3 shows an overview
of the setup.
4.2 Participants
Advagym is an application with a very broad user
group where young to old users are included. It can be
beginners as well as elite trainers. The one thing they
ICT4AWE 2021 - 7th International Conference on Information and Communication Technologies for Ageing Well and e-Health
116
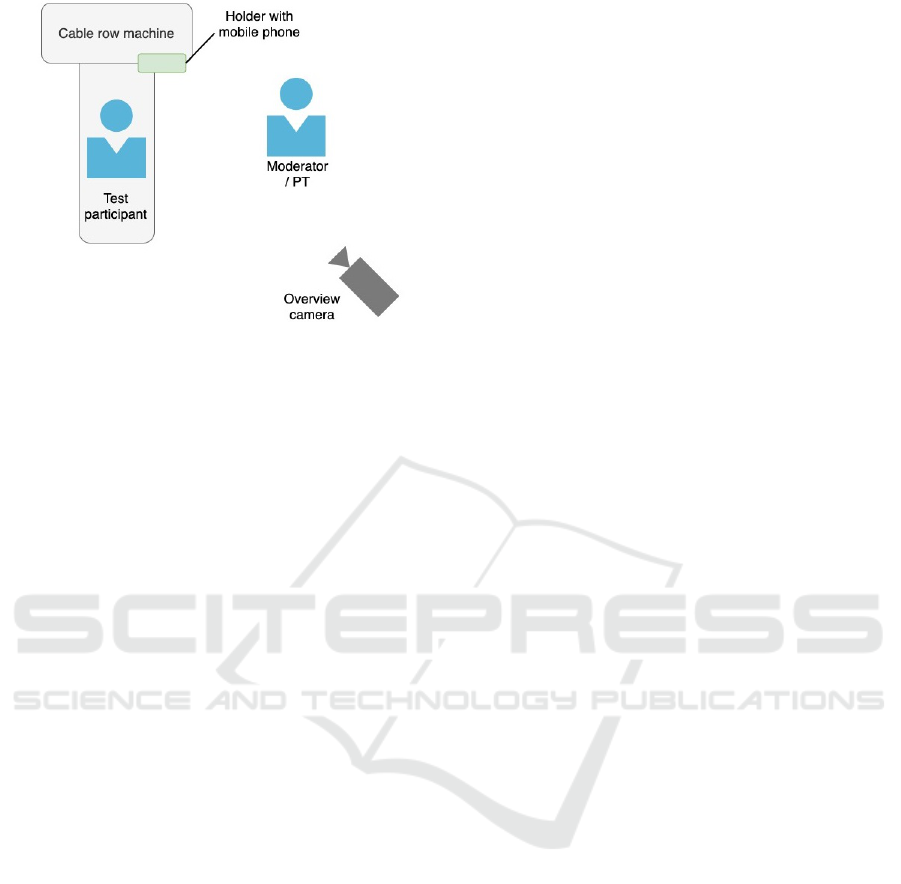
Figure 3: The setup.
have in common is that they are training at a gym.
However, we had some restrictions such as being able
to physically perform the test, i.e. the participant
should be able to perform the “cable row” exercise
on a low/moderate weight, without any pain. More-
over, having good enough sight with/without aids, to
see a 5.8” mobile screen, one meter away from the
participant.
To more easily recruit participants, an online ques-
tionnaire using Google Forms was used. The online
questionnaire served two purposes; to gather relevant
demographic data about the participant and book an
available time-slot. The sign-up questionnaire was
spread through different channels, both in digital and
physical form. The physical form were posters in-
cluding QR-code links that were placed in several
crowded areas within the campus of Lund Univer-
sity. The digital form was a link that was distributed
through Sony’s social media groups.
In total, 48 participants (20 female, 28 male) were
recruited. The age of the participants ranged from 18
to 55 years (M = 29.2, SD = 10.14). To estimate and
grade the training skill of the participants a sequence
of calculations were made, based on their sign-up
questionnaire answers. The following parameters:
weekly training frequency and time kept with current
training frequency. This was graded into a scale of
1 to 5 where the interval of 1 to 3 was graded as be-
ginner/novice training skill and 4 to 5 were graded as
advanced training skill.
4.3 Procedure
The test session was divided into three parts: Prepara-
tion stage, Test session, and Post-test (Figure 4). The
Preparation stage includes the stage of the recruitment
and initial meeting with the participants. As already
mentioned, Participants signed up for the test with the
help of an online questionnaire. The online question-
naire allowed us to have demographic data ready be-
fore the actual test. When the participant arrived at
the test location, they were welcomed and escorted
to a User Experience (UX) lab, where they signed a
Non-Disclosure-Agreement (NDA) and an informed
consent form.
Once the introduction was done, the participant
was taken to the test area which was the office gym.
The reason for using an actual gym was to get the
most realistic test possible, as well as the fact that the
office gym was already equipped with the Advagym
system. Once the participant was ready to start, the
test session continued in a certain order. There were
five different test cases for the test with the following
alphabetical labels:
- A. No System
- B. Personal Trainer (PT)
- C. System with Text feedback
- D. System with TGP feedback
- E. System with TGC feedback
Each test session started to test A i.e. no sys-
tem/no feedback in order to know how the partici-
pants’ would perform normally the exercise, followed
by B & C, but counterbalanced.
With 48 participants, each order will have 24
participants. The reason for this was to find if
there are any relations between which order of
cases/prototypes is tested. Followed by the initial se-
quences of test cases, either D or E will be tested,
meaning only four test cases per test session. More-
over, cases D and E will be tested by 24 participants
each. We have a mixed design with two within-group
measurements (ABC and ACB) and between-group
measurements (DE and ED). The independent vari-
ables are the three user interfaces and the PT. The de-
pendent variable is the performance score. To avoid
sequence effects, the order in which the test sequences
were presented was fully counterbalanced, i.e. each of
the four possible orders was shown to equally many
participants.
For each case, the participant was asked to per-
form twelve repetitions on three different sets with a
low/moderate weight and a rest time of their choice in
between. The reason for this was to get sufficient data
points to see any significant patterns. When one test
case was complete, the next test case followed with
the same test structure, continuing throughout the test.
Example: A ⇒ B ⇒ C ⇒ E ⇒ Done!
After the test, the participant was taken back to the
UX lab and was asked to fill out the System Usabil-
ity Scale (SUS) questionnaire (Brooke, 2014). In an
attempt to do a usability assessment of the user inter-
face, SUS was used. It attempts to measure cognitive
Exploring Different User Interfaces for Velocity based Training using Smart Gym Machines: Pilot Study
117
Figure 4: Test session procedure.
attributes such as learnability and perceived ease of
use (Brooke, 2014). The questionnaire was followed
by a short structured interview to see if the partici-
pants understood the user interface, and to see which
one they preferred.
Each session lasted about 30 min, and as a reward,
the participant was given a movie ticket. The whole
procedure of the test session is visualized in a block
diagram (Figure 4).
4.4 Results
In the following section, the results from the objective
performance score, SUS scale, and the structured in-
terview are presented. All of the 48 participants man-
aged to accomplish the exercises.
We used an alpha level of .05 for all statistical
tests.
Performance Score. The performance for all 48
participant test cases was logged and summarized.
The performance data is based on the velocity of the
concentric (v
c
) and eccentric (v
e
) lift for a repetition,
which was summarized and made into an average (v
a
)
velocity of the lift.
v
c
+ v
e
2
= v
a
(1)
The velocity v
a
was then graded as either slow,
good or fast, based on the targeted velocity v
tar
=
0.335 m/s with a tolerance of v
tol
= 0.05 m/s, which
is a sensitivity of 15%, i.e. v
a
could be in the inter-
val of (0.330 m/s ≤ v
a
≤ 0.340 m/s) to be graded
as “good.” As mentioned, for each test case twelve
repetitions on three sets were performed. Because of
hardware constraints, the very first repetition was ig-
nored since no data was given for that repetition by
the system. Meaning that for three sets eleven repeti-
tions give a total of 33 data points for every test case
on every participant. The performance is represented
in percentage of each test case, i.e. how many repe-
titions per data points were graded “good” out of the
performed repetition on this test case. The number
of performed repetitions should be 33, but in some
cases, the participants missed a repetition. This was
taken into account for the calculation of the percent-
age score.
A one-way ANOVA for dependent measures be-
tween personal trainer (PT), Text and TGP showed a
Figure 5: Performance score illustrated in a boxplot, rela-
tions between TGP, PT and Text. N = 24.
Figure 6: Performance score illustrated in a boxplot, rela-
tions between TGC, PT and Text. N = 24.
significant relation: F(2,69) = 5.34, p = .0070. Multi-
ple pairwise-comparison showed a significant differ-
ence between the PT and TGP with an adjusted p-
value of p = 0.0057 (Figure 5). Moreover, it was close
to the margin of statistical significance between PT
and Text with an adjusted p-value of p = .089.
When it comes to the dependent measures be-
tween PT, Text and TGC, again one-way ANOVA
showed a significant relation: F(2,69) = 3.50, p =
.036. Multiple pairwise-comparison showed close to
the margin of significant difference between PT and
Text with an adjusted p-value of p = .052 (Figure 6).
Moreover, it was close to the margin of statistical sig-
nificance between PT and TGC UI with an adjusted
p-value of p = .080.
Since the test sessions were divided into four parts
which followed in a sequence of sessions, it could be
seen as a learning curve of how to find the targeted
velocity. This is presented in Figure 7, where every
test case is displayed from the first test case to the
fourth and last test case.
Based on the demographic data, we analyzed the
participants split into two groups to see if we could
see any statistical differences based on their training
skill: beginner/novice and advanced. The difference
in the learning curve of these groups can be seen in
ICT4AWE 2021 - 7th International Conference on Information and Communication Technologies for Ageing Well and e-Health
118

Figure 7: Learning score curve of the four different test
sequences, from 1
st
to 4
th
(last). N
ABCD
= 12, N
ACBD
=
12,N
ABCE
= 12,N
ACBE
= 12.
Figure 8: Learning score curve difference between partic-
ipants graded as beginners/novice and advanced in their
training skill. N
advanced
= 19,N
beginners/novice
= 29.
Figure 8.
SUS Score. The results obtained from the SUS
questionnaire for the TGP present a mean score of
M = 82.2, SD = 12.07 with a minimum score of 55
and a maximum score of 97.5. For the TGC, a mean
score of M = 80.7, SD = 8.42 with a minimum score
of 62.5 and a maximum score of 95. A paired t-test
was used to explore the difference between the TGP
versus TGC but no statistically significant difference
was found t(41.1) = -.41, p = .68. There were no sta-
tistically significant differences between beginner and
advanced participants either t(33.9) = -.43, p = .67.
Structured Interview. During the interview of
the participants, questions regarding each tested pro-
totype were asked.
Each participant was also asked which test case
they preferred in the sense of which test case they
would prefer to use in their daily training, when train-
ing with an exercise machine, regardless of external
influences, e.g. money for a PT. The answers for the
test cases with the TGP are summarized in Table 1
and for the test cases with the TGC in Table 2.
Table 1: Preferred UI, TGP, Text, PT and No System
(N=24).
UI Nbr of participants
TGP 8
Text 5
PT 7
No system 4
Table 2: Preferred UI, TGC, Text, PT and No System
(N=24).
UI Nbr of participants
TGC 5
Text 5
PT 10
No system 4
5 DISCUSSION
In this section, we will discuss the “take-aways” of
the user study and the limitations of the prototypes.
Performance Score. Compared with a personal
trainer, trying to give feedback on the speed of a user’s
lift, all the prototypes performed significantly better
in the sense of being close to the targeted velocity of
the lift. It also seems as if the participants who tested
the Text UI first, rather than receiving feedback from a
PT first, found it easier to adjust to target velocity. It is
also shown that participants using any prototype with
a beginner level of training skill can perform as well
as participants with advanced training skills, where
the skill level is an indication of physical body con-
trol for the participant. However, the advanced par-
ticipants had better performance than the novice par-
ticipants during the first test which did not have any
feedback at all. So the advanced participants started
with better performance but with the help of different
prototypes, the performance score was leveled up.
SUS Score. There was no significant difference
regarding the SUS score. Both UIs had a SUS score
larger than 68, which is considered to be above av-
erage (Brooke, 2014). The TGP UI had a slightly
higher mean SUS score value M = 82.2 than the TGC
UI which had a mean SUS score value M = 80.7.
The SUS score measures cognitive attributes such as
learnability and perceived ease of use, the result indi-
cates that both UIs are considered to be easy to use,
and easy to learn.
The Structured Interview. One of the main rea-
sons why the participants preferred to train with a per-
sonal trainer rather than with an application, might
be because of the human connection. Another reason
can also be that the participant wants more feedback
Exploring Different User Interfaces for Velocity based Training using Smart Gym Machines: Pilot Study
119

on their performance than just the velocity of the lift.
Feedback such things as the user’s positioning in the
exercise, range of motion, movement, and other rel-
evant information that the prototypes could not cur-
rently provide.
Limitations. An example of a hardware limita-
tion or constraint is the fact that it only broadcasts two
events per repetition, having a continuous real-time
data stream would enable more alternatives of UI ele-
ments. Another limitation of this study is that we only
focused on the visual modality. However, there are
plans to continue the research and add other elements
such as audio feedback and gamification. For exam-
ple, having the indicators being moved with matching
audio or even just audio feedback. Regarding gami-
fication, which according to Deterding et al. (2014),
is defined as the use of game design elements in non-
game contexts. An example of gamification can be
the use of points, badges, levels, and leaderboards.
In this case, every time the velocity of the exercise
was performed correctly could lead to some achieve-
ment. For example, the gym could offer something
from their shop.
6 CONCLUSION
The findings presented in this paper expand the ex-
isting knowledge-base of HCI research in the sphere
of using a mobile application to support VBT. The
result of the prototypes has been overall very impres-
sive. Especially in the objective sense that an applica-
tion can help a user perform a physical movement at a
particular speed. All of the prototypes have also per-
formed very well regarding to the usability scores. All
of the prototypes were above the average score of 68
for the SUS-based questionnaire, which indicates that
the proposed user interfaces are easy to understand
and use. The majority of participants would also pre-
fer to use one of the prototypes in their daily training
with exercise machines. This is a good indication that
the feature itself is interesting for users.
ACKNOWLEDGEMENTS
Advagym team for supporting this research.
REFERENCES
Advagym (2015). Advagym - for a connected gym experi-
ence. http://advagymsolutions.com.
Brooke, J. (2014). Sus—a quick and dirty usability
scale. 1996. URL: http://cui. unige. ch/isi/icle-
wiki/ media/ipm: test-suschapt. pdf [accessed 2015-
10-14][WebCite Cache ID 6cGs6wGeu].
Deterding, S., Dixon, D., Khaled, R., and Nacke, L. (2014).
Du game design au gamefulness: d
´
efinir la gamifica-
tion. Sciences du jeu, 2.
Geurts, E., Van Geel, F., Feys, P., and Coninx, K. (2019).
Walkwithme: Personalized goal setting and coaching
for walking in people with multiple sclerosis. In Pro-
ceedings of the 27th ACM Conference on User Mod-
eling, Adaptation and Personalization, pages 51–60.
Gubbi, J., Buyya, R., Marusic, S., and Palaniswami, M.
(2013). Internet of things (iot): A vision, architec-
tural elements, and future directions. Future genera-
tion computer systems, 29(7):1645–1660.
H
˚
akansson, J. (2019). Interaction with iot data to
help users train smarter. https://lup.lub.lu.se/student-
papers/search/publication?q=author+exact+dat13jha.
IJsselsteijn, W., De Kort, Y., Midden, C., Eggen, B., and
Van Den Hoven, E. (2006). Persuasive technology
for human well-being: setting the scene. In Inter-
national conference on persuasive technology, pages
1–5. Springer.
Malina, R. M. (2010). Physical activity and health of youth.
Ovidius University Annals, Series Physical Education
& Sport/Science, Movement & Health, 10(2).
Mann, B. (2016). Developing Explosive Athletes: Use of
Velocity Based Training in Athletes. Ultimate Athlete
Concepts.
Patel, M. S., Asch, D. A., and Volpp, K. G. (2015). Wear-
able devices as facilitators, not drivers, of health be-
havior change. Jama, 313(5):459–460.
Preece, J., Rogers, Y., and Sharp, H. (2011). Interaction
design - beyond human-computer interaction. John
Wiley & Sons Ltd.
Sankaran, S., Frederix, I., Haesen, M., Dendale, P., Luyten,
K., and Coninx, K. (2016). A grounded approach
for applying behavior change techniques in mobile
cardiac tele-rehabilitation. In Proceedings of the 9th
ACM International Conf. on PErvasive Technologies
Related to Assistive Environments, pages 1–8.
Stobbe, M. (2018). More americans exercise, but more
u.s. adults also edge closer to obesity, survey
says. https://www.pbs.org/newshour/nation/more-
americans-exercise-but-more-u-s-adults-also-edge-
closer-to-obesity-survey-says.
Vince, R. V. (2017). Velocity based training &
non-athlete populations. https://www.trainwith
push.com/blog/velocity-based-training-non-athlete-
populations.
Yang, J. (2015). Enhancing the quality and motivation of
physical exercise using real-time sonification. PhD
thesis, University of York.
ICT4AWE 2021 - 7th International Conference on Information and Communication Technologies for Ageing Well and e-Health
120
