
Categorizing Quantities using an Interactive
Fuzzy Membership Function
Liqun Liu and Romain Vuillemot
´
Ecole Centrale de Lyon, Univ. Lyon, LIRIS CNRS, France
Keywords:
Membership Function, Fuzzy Logic, Categorization.
Abstract:
In this paper, we investigate how an interactive version of the membership function from the Fuzzy Logic Theory
can be used to categorize quantitative data. This function is simple and similar to a line chart and provides
an explicit mapping of the categorization process. We first review the requirements for such quantitative
values partitioning process and provide the fuzzy logic mathematical foundations related to the membership
function. We then report on the implementation of the interactive function for several quantitative datasets case
studies (e. g., age, temperature, speed). We expect this interactive function to provide more control over the
categorization process, as well as a way to make the categorization more explicit.
1 INTRODUCTION
When reasoning on quantitative values—like people’s
age—analysts tend to use categories like
YOUNG
and
OLD
. Such a categorization process aims at mimicking
the logic of human thoughts and reasoning (Clifford
et al., 1975). In the situation where such categories
are not in the dataset, it is likely they are subjective,
from the analyst’s head, based on familiarity with the
domain or prior knowledge. Such a process raises the
following issues:
•
An explicit mapping for those categories is miss-
ing: the mapping function between quantities and
categories should be clearly defined.
•
The mapping properties may vary across analy-
sis sessions and analysts: the mapping should be
consistent and may not change.
•
The transfer between analysts and a user should
be possible: by some means of communication
like a legend or a visual representation.
Besides, there are also some alternative automatic
categorization methods and clustering. Those meth-
ods categorize quantities based on the distribution of
quantitative values, e. g., KNN (Cover and Hart, 1967),
K-Means (MacQueen et al., 1967), DBSCAN (Ester
et al., ). However, those approaches do not provide
enough control over the mapping process to let humans
customize and capture uncertainty.
In this paper, our goal is to address those issues
with an interactive visualization that captures such
knowledge. It relies upon Fuzzy Logic Theory, created
back in the 1960s to model domains with imprecise
information (Zadeh, 1965; Pedrycz and Gomide, 2007)
which we argue provides the theoretical framework to
address the above issues. In particular, we rely upon
a visual representation from this theory called mem-
bership function which is a line chart of the mapping
function between a quantitative scale and categories,
which makes this mapping explicit, which captures
various points of view using a confidence factor and
finally which visual can easily be transferred.
Our main contribution is that we designed an in-
teractive version of fuzzy membership function as an
interactive chart (Fig. 1), which is able to help users
categorize quantitative values with confidence belong-
ing to categories. We provide an implementation that
demonstrates how it supports the categorization of
multiple datasets. Our implementation exposes many
parameters of the function that can be adjusted to gen-
erate new shapes of membership function for fine-
grained categorization. The generated categories from
this membership function can be assigned names that
are then used as category names in the updated dataset.
We conclude with an experimental design for further
evaluation of this tool to validate its usability. We ex-
pect this technique to be not only used as a categories-
generation tool, but also as an interactive legend (Riche
et al., 2010) to communicate the generated categories
properties and let the user adjust them dynamically
when analyzing a visual representation.
Liu, L. and Vuillemot, R.
Categorizing Quantities using an Interactive Fuzzy Membership Function.
DOI: 10.5220/0010270801950202
In Proceedings of the 16th International Joint Conference on Computer Vision, Imaging and Computer Graphics Theory and Applications (VISIGRAPP 2021) - Volume 3: IVAPP, pages
195-202
ISBN: 978-989-758-488-6
Copyright
c
2021 by SCITEPRESS – Science and Technology Publications, Lda. All rights reserved
195

2 RELATED WORK
This paper focuses on how to categorize quantities
with fuzzy logic theory and quantify those generated
categories with membership degree. In this section,
we review papers in probabilistic classification, fuzzy
visualization, and uncertainty visualization.
2.1 Visualization of Probabilistic
Classification
(Alsallakh et al., 2014) proposed a visual interactive
analysis tool to evaluate the effectiveness of classifiers
to help machine learning experts find out the possible
reasons for incorrect classification. This tool is able to
emphasize the classification probabilities of items and
make relations with a false negative and false positive.
Similar to Alsallakh’s study, Cao and Lin proposed
UnTangle Map (Cao et al., 2015; Lin et al., 2014)
by a web of the connected triangles, which is able
to make the efficient relation between data items and
their probabilistic labels. Based on RadViz, Seifert pro-
posed a visual system to help understand the process
of classification and results, which handles multiple
classes, nominal and numeral data format (Seifert and
Lex, 2009). Zhao conducted an experiment to eval-
uate the effectiveness and efficiency of fuzzy cluster
analysis, objective questionnaires are designed to com-
pare the accuracy and subjective questionnaires are
designed to collect the experience of a user based on
using four-dimensional visualization technique (Zhao
et al., 2018). (Rheingans and Desjardins, 2000) is de-
signed to visualize high-dimensional predictive results
with richer representation, e.g., classification accuracy
and confusion matrices to help a user understand high-
dimensional data space.
2.2 Fuzzy Visualization
There exist alternatives to the membership function
to capture categorization. Fuzzy representations and
uncertainty visualization are suitable solutions like the
Disk diagrams (Park and Park, 2010a; Park and Park,
2010b) proposed by Yeseul Park, to visualize fuzzy
set operations. It can describe the complexity of fuzzy
sets by showing the degree among sets with the layout
of star coordinates, etc. (Zhu et al., 2018) extended
the circular disk diagram layouts to improve sets mem-
bership analysis, by using color opacity and optimized
layout to convey fuzzy sets membership and reveal the
uncertain owner-member relationship. Besides, they
also designed a computational framework by combin-
ing physical simulation and geometric interpolation.
However, those works focus on communicating cate-
gories rather than supporting their creation.
2.3 Uncertainty Visualization
Research on uncertainty visualization also offers some
solutions for the presentation of ambiguity while cate-
gorization. In this field, Works related to uncertainty
visualization provide guidance on advanced properties
in the data, i. e. incorrectness, incompleteness, and
ambiguity (Dressel and Nori, 2014). Brodlie (Brodlie
et al., 2012) reviewed state of the art in uncertainty
visualization according to different data, for example,
point data, scalar data, multi-field scalar data, and vec-
tor data. At the same time, they also concluded the
uncertainty visualization in the various dimensional
datasets. Skeels proposed a classification of uncer-
tainty (Skeels et al., 2010) for information visualiza-
tion. (Dong and Hayes, 2012) designed an interactive
tool to help users recognize the situations and com-
prehend the ambiguity, which is able to evaluate the
domain-dependent decision support system (DSS).
3 DEFINING CRISP AND FUZZY
MEMBERSHIP FUNCTIONS
Table 1: Dataset with quantities and categories.
Name Age Group Profession
Lisa 8 Children Student
Barney 39 Adult Engineer
Smithers 33 Adolescent Professor
Mr. Burns 90 Senior Retired
The challenge we address is the explicit mapping be-
tween quantities and categories. While most visualiza-
tion techniques and tools usually address it during the
visual encoding of data, it remains internal—or at best
using a legend—without providing a fully explicit set
of properties for this mapping.
To introduce our approach, we progressively intro-
duce the definitions by first stating our challenge as
finding the relationship between Q (Quantitative) and
C (Categories) as a mapping function:
Quantity → Category (1)
Quantities are the measures of counts or values,
which is able to be expressed by numbers and also can
be compared in terms of ”more”, ”less”, or ”equal”,
like attribute Age showed in Table. 1. On the contrary,
categories are measures of type and can be expressed
by a symbol, name, or label, which is categories, like
IVAPP 2021 - 12th International Conference on Information Visualization Theory and Applications
196
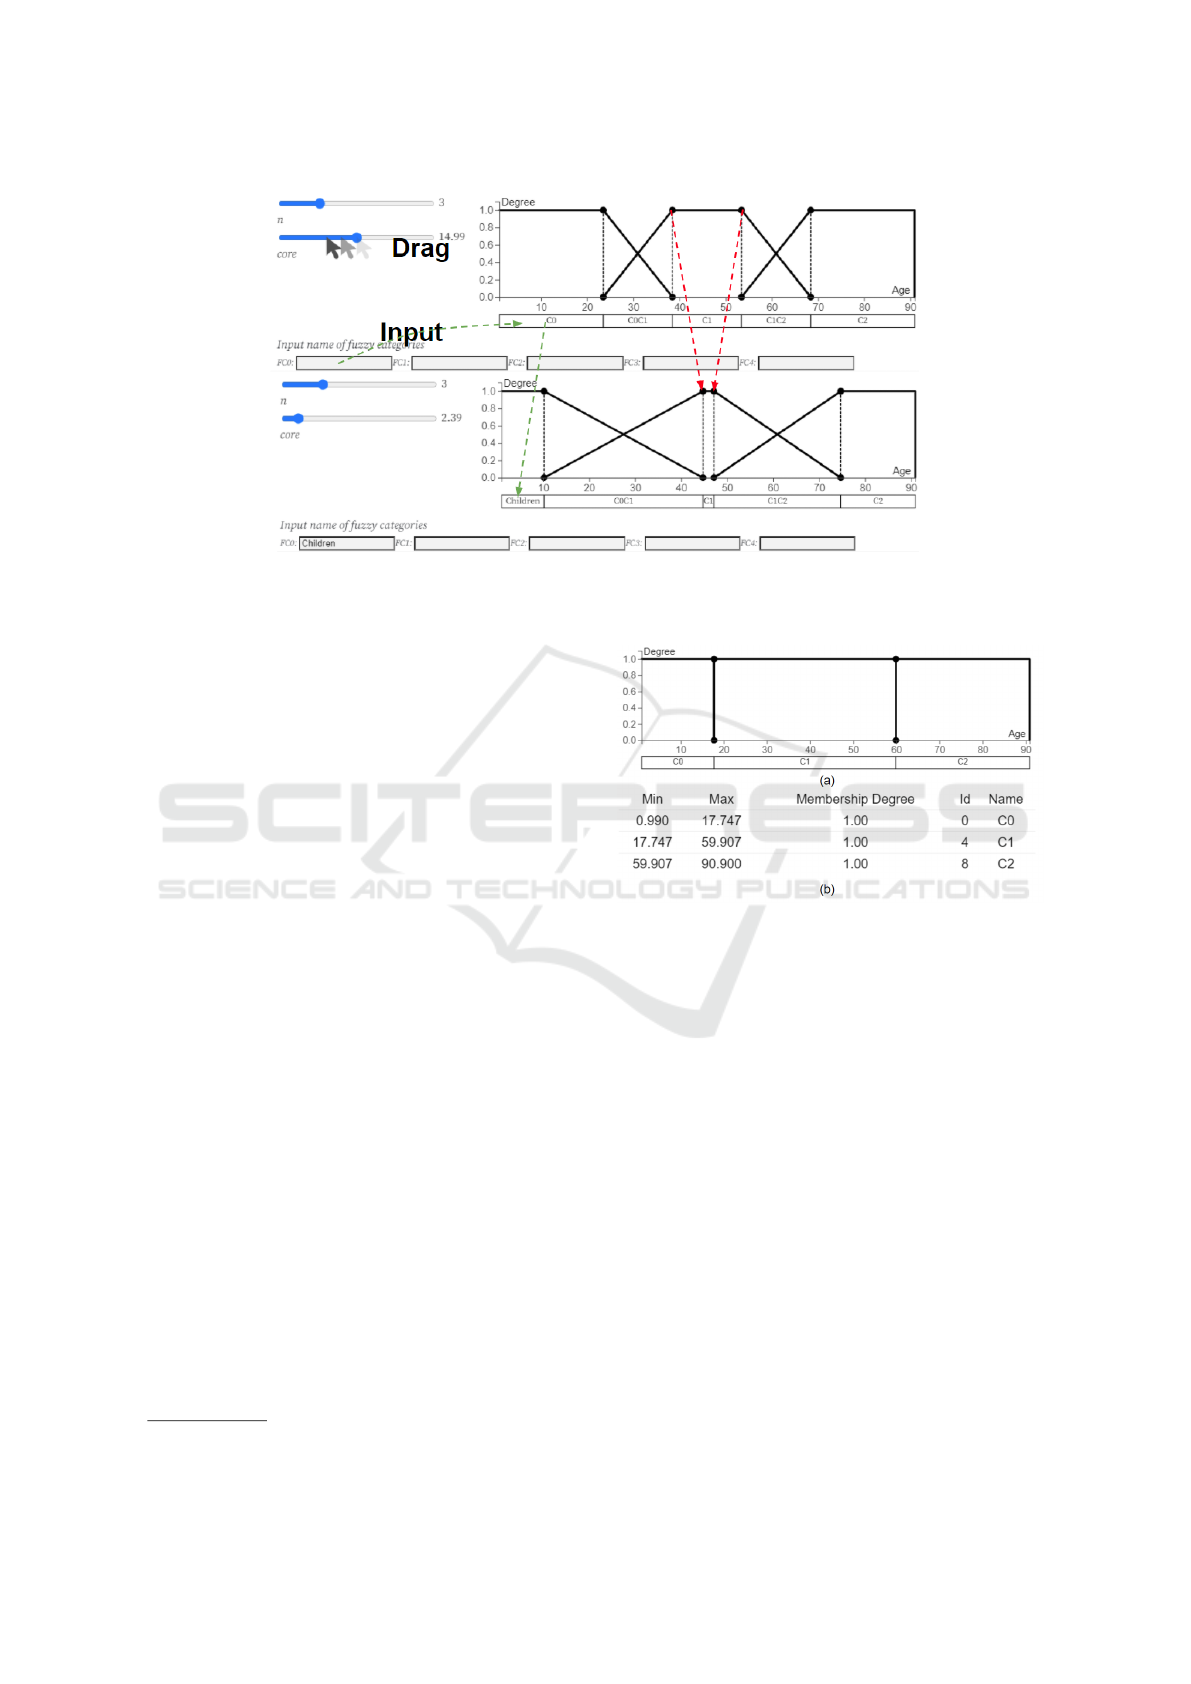
Figure 1: Manipulation of the interactive membership function. By adjusting the parameter core, the membership function
is changed along with the new value of core, which is shown as the red dot line; Another interaction is defining the name of
categories by inputting action and it is shown as the green dot line.
attribute Age group in Table. 1. Mapping function con-
nect quantities (
Q
) and categories (
C
), e. g., the quan-
tity ”age” is separated into ordinal range, showed as
[0,:] →< YOUNG,ADULT,OLD >
. Thus the trans-
formation from quantities to categories is defined as
Eq. (2):
x →
Y OUNG i f age(x) ≤ 20
ADULT i f 20 < age(x) ≤ 60
OLD i f 60 < age(x).
(2)
We implemented a prototype
1
of the mapping func-
tion above from quantitative scales to a domain of
user-defined categories. Fig. 2 illustrates the user in-
terface that represents the mapping of each value to
categories. A user can change the value parameter
n
by
adjusting the slider, which is able to change the num-
ber of bars of the mapping function. A user can also
drag the vertical bars using circles so he can adjust the
categories. A table below indicates the categorization
result for each category.
This mapping relates to the classical sets theory,
where the categorization is a crisp process that splits
quantities into categories with a binary function: ac-
cepting or rejecting the object belonging to a cate-
gory (Massad et al., 2009). An element
x
either be-
longs to a category or not. Those are strict perimeters
and each element only belongs to a single category.
Such a mapping function can be combined using in-
tervals that often converts a whole range of values. If
there is a set
W
that is not empty and a set
S ⊂ W
, the
characteristic function of S will be shown as follows:
f
S
(x) =
1 i f x ∈ S
0 i f x /∈ S
(3)
1
https://observablehq.com/d/4560d69baca4663c
Figure 2: Categorization using crisp membership function,
there are three crisp categories generated from the crisp mem-
bership function showed in (a) and the detail information of
categories in (b).
f
S
(x)
is the function, the domain of which is
W
. The
value of
f
a
(x)
is included in set
{0,1}
. With
f
S
(x)
= 1, it means element
x
belongs to set
S
; if
f
S
(x)
=
0, it illustrates element
x
does not belong to set
S
so
that this mapping function
f
S
(x) → {0,1}
are able to
completely represent the relationship between element
x and set S.
However, previous mapping function has a limi-
tation on splitting ambiguous sets. For example, it
can not represent the children, adolescent and adult,
because adolescent normally has overlap with children
and adult. Thus, it is not any more suitable for sepa-
rating quantitative values when there is ambiguity or
there are more than one quantitative scale. In order to
solve the problem that does not have sharp boundaries
while categorizing, Zadeh proposed the membership
degree that means an element can partially belong to a
set (Zadeh et al., 1996).
In order to implement the fuzzy membership func-
Categorizing Quantities using an Interactive Fuzzy Membership Function
197

tion into interactive categorization, we implemented
the second prototype
2
to map quantities to categories
based on fuzzy logic. Fig. 3(a) shows the interface
for a user to adjust parameters. In this figure, x-axis
represents quantitative values and y-axis shows the dis-
tribution of membership degree(
µ
). Compared to the
first prototype, this one is able to be adjusted among
fuzzy logic parameters core and n by manipulating
the sliders. Besides, a user also can adjust core by
dragging small black circles on the fuzzy membership
function and make them different from other fuzzy
categories. Finally, he can also define the name of
generated categories by inputting texts so that a user
can generate any fuzzy categories that they want with
membership values and specific names. The member-
ship values and names are illustrated in Fig. 2(b).
Fuzzy category is defined with relaxing belonging
constraints, which proposes an intermediate member-
ship value as interval
[0,1]
. This value represent the
degree how many possibility element x belongs to set
A
. Thus, the membership function can be described as
f
a
(x) → [0,1]
. The value of
f
a
(x)
means the member-
ship degree of membership function. With
f
a
(x) = 1
, it
represents the complete belongingness while
f
a
(x) = 0
shows the complete non-belongingness. Let
X =
{x
1
,x
2
,..}
denote the set
X
of elements
x
i
. A fuzzy
category is then a pair
(X,µ)
. So fuzzy category is
denoted as
{µ(x
1
)/x
1
,...,µ(x
n
)/x
n
}
. The core and
support respectively represent all elements that belong
to a set are denoted
Core(A) = {x ∈ X|A(x) = 1}
and
all the elements which membership degree is
> 0
such
as Supp(A) = {x ∈ X |A(x) > 0}.
Any function
f
a
(x) → [0,1]
is membership func-
tion framework, instead of accurate representation.
The real membership function depends on its shapes.
Those membership functions with specific shapes are
composed of specific properties and they are chosen
based on different data and applied fields, e. g., trian-
gular, trapezoidal, Gaussian and sigmoidal functions.
In this paper, we chose the trapezoidal membership
function and it is given by:
f (x) =
0 i f x < a
(x − a)/(b − a) i f a ≤ x < b
1 i f b ≤ x < c
(d − x)/(d − c) i f c ≤ x < c
0 i f x > c
(4)
Where,
a,b,c,d
are the parameters of trapezoidal
membership function. The membership functions can
be displayed over a line chart in which x-axis is the
quantitative value and the y-axis is the membership
degrees. Each line is a category, and their membership
degrees are from 0 or 1.
2
https://observablehq.com/d/b887da8c1dfdb975
Figure 3: The mapping function based on fuzzy logic theory
generates both crisp categories and fuzzy categories in (a)
and all those categories and its information are in (b).
4 INTERACTIVE MEMBERSHIP
FUNCTION
4.1 Interaction
We introduce how to use the interactive membership
function in this section. There are two general param-
eters of membership function:
n
and
core
are shown
as the sliders in Fig. 1. In this visual tool, a user can
adjust the two parameters to generate different shapes
of membership functions. By adjusting parameters in
the control panel, all categories generated would be
changed with the same value of core.
If a user would like to operate it more specifically,
he can build a new shape of membership function by
dragging those little circles showed in Fig. 4(a), for
example, A user can change the parameter
core
of spe-
cific categories by dragging black circle showed in the
left of Fig. 4(a). And then, the membership function
is able to be changed as the right of Fig. 4(a), the first
category in this membership function is changed. Fi-
nally, this membership function also offers the naming
method. By inputting texts in the input fields shown in
Fig. 4(b), the categories are able to be related to input
labels and appear as new categories in the underlying
dataset.
4.2 Implementation Details
This membership function is implemented in Observ-
able, using library D3 (Bostock et al., ) and is bundled
as a JavaScript ES6 module compliant with modern
Web standards. An online prototype
3
is available
along with the datasets described in this paper. Addi-
3
https://observablehq.com/d/12575cfbd09fe8e8
IVAPP 2021 - 12th International Conference on Information Visualization Theory and Applications
198

Table 2: Summary of case studies illustrating interesting configurations constructed in the three case studies datasets.
Data FUZZYCUT # of sets Name Interval
Age 5 Children, Teenager, Adult, Less old, Old [0.99, 90.90]
Temperature 3 Cold, Warm, Hot [-12.98, 68.58]
Speed 5 Low, Low-Middle, Middle, Mid-High, High [0,104.04]
Figure 4: The top circles on membership function are able to
be dragged to change the parameter core of a specific cate-
gory in (a); The labels of categories are defined by inputting
texts in input field in (b).
tional datasets can be added using a JSON file spec-
ification that captures the configurations that a user-
defined. The parameters of configurations include the
parameters of specific membership function and cate-
gories’ names are showed as follows:
{
"title": "Temperature",
"attribute": "0",
"parameters": [{
"n": "3",
"Core": "13.6",
"Support": "27.2",
"names": [
"Cold",
"Warm",
"Hot"
]}]}
Such configuration enables the rapid export and
sharing of the parameters, so they can be used in a
different tool and can further be analyzed to understand
the categorization process of multiple users.
5 CASE STUDIES
In this section, we introduce three typical quantitative
datasets and the categorization we generated using
our interactive visual tool. The datasets we used in-
clude age datasets, temperature datasets, and taxi speed
datasets.
5.1 Case Study with Age Dataset
A typical age dataset consists of a semi-bounded in-
terval and rounded values, there exists a minimum
value but no fixed maximum value. The dataset we
used, in this case, is The Simpsons, a popular U.S.
TV Series. The dataset includes 24 characters with an
age attribute. Age range from 0 to 90. The dataset
is shown in Fig. 5 where ages are represented on the
x-axis. The y-axis shows the membership degree for
every category so that a user can easily check cate-
gories and their membership degrees. The table list
below shows the categories and their properties. Mem-
bership values and the range of categories are shown
in the table shown in Fig. 5(b), which is corresponding
to the membership function and has 5 categories. We
can see that the membership degrees of category 1 and
category 3 are equal to 0.5, and other categories are
equal to 1. The name of every category is shown on the
table where each character now has an age category.
5.2 Case Study with Temperature
Dataset
We use a temperature dataset of the United State in this
second case study. As such temperature value does not
have a clear maximum value and minimum value, the
data is non-bounded and continuous. The dataset we
used consists of temperatures from 357 divisions in
the USA for 12 months. The categorization is shown
in Fig. 6. Fig. 6(a) represents the fuzzy membership
function and Fig. 6(b) is the table list of categories.
In Fig. 6(a), temperature degrees are distributed along
with the x-axis and the y-axis are membership values
for each category. In this prototype, temperature values
Categorizing Quantities using an Interactive Fuzzy Membership Function
199
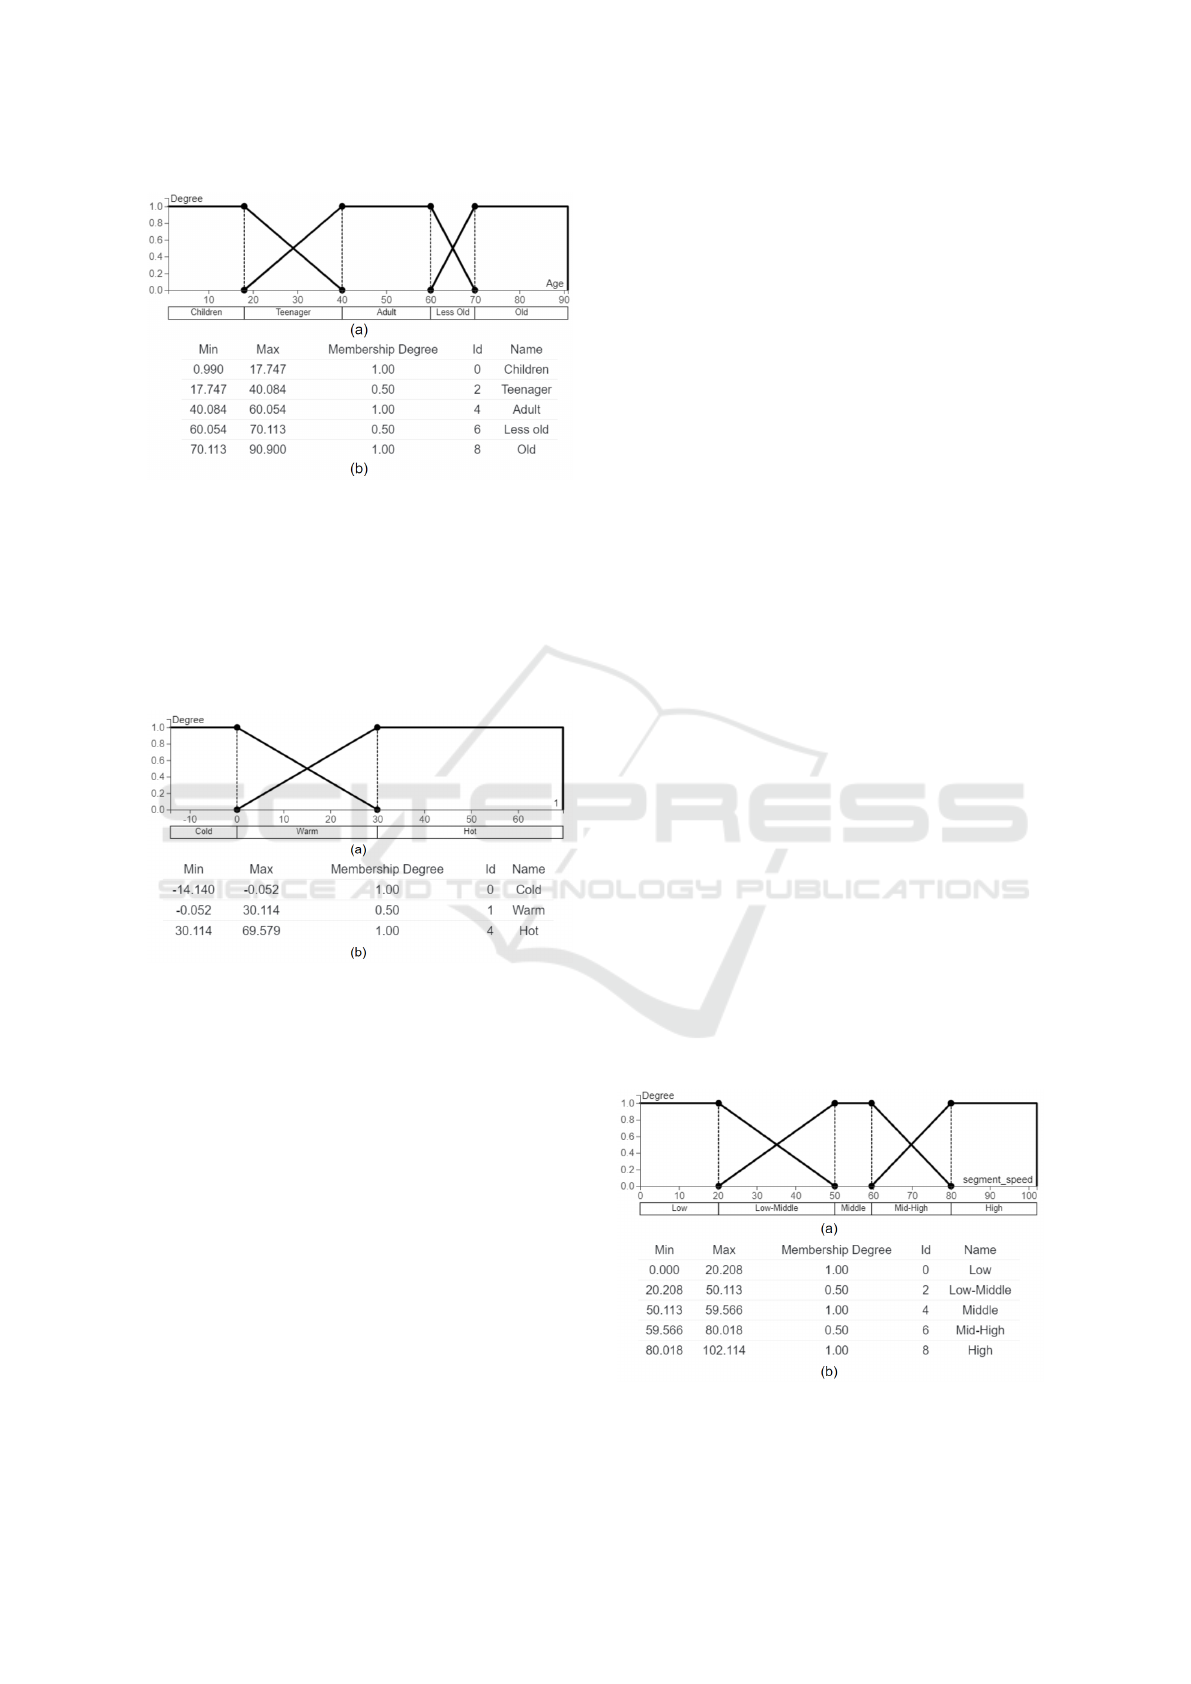
Figure 5: The age data are from 0 to 90, there are three
main categories with name Chidren, Adult and Old. Mean-
while, two fuzzy categories created and they are named with
Teenager and Less old.
are separated into three categories, which are from -
12.98 to 68.56. The name of those three categories
are Cold, Warm and Hot. But the Warm category is
derived from Cold and Hot, membership degree of
which is 0.5.
Figure 6: Temperature data are separated with two main
categories Cold and Hot. The intermediate category Warm
is created.
5.3 Case Study with Taxi Speed Dataset
We conduct the third case using a taxi speed dataset.
The speed data are semi-rounded and continuous
values types. Traffic analysts usually are interested
in characterizing taxi drivers’ characteristics, which
is helpful for them to identify driving behaviors. Ob-
viously, speed is a very essential parameter to define
categories, as it reflects many characteristics of drivers.
The prototype of taxi speed is showed in Fig. 7(a)
and the table list is showed in Fig. 7(b). In this case,
speed is separated into five categories and their main
categories are Low, Middle and High. Besides, there
are two fuzzy categories with membership degrees less
than 1, named Low-Middle and Mid-High. Other cate-
gories, more domain-specific, could have been used,
e.g. Slow, Fast by editing the label input field
in the prototype.
6 DISCUSSION AND
PERSPECTIVES
In this paper, we designed an interactive tool to catego-
rize quantities into categories. By using Fuzzy Logic,
it enables splitting quantitative values into categories
with a degree called membership degrees. We are able
to present uncertainties with membership degrees to
better capture user knowledge and demonstrated its ap-
plication using three datasets included in an interactive
prototype.
The summary of case studies is shown in Table 2.
The results suggest that, in most situations, users are
likely to categorize quantities into 3 - 5 categories
with particular names for each category. First, naming
generated categories is usually based on social basic
knowledge, e. g., the name of age categories, which
includes Children, Adult and Old. But when the cat-
egories are complicated, the name of categories tend
to be Very ... or Super ... There is also another naming
method, which combines the basic categories, e. g., the
name Mid-High is derived from Middle and High in
speed data. Our tool supports an extensive number of
categories, up to several dozens. Beyond this number,
it may however become difficult to read the category’s
names and interact with them.
We identified the following limits in our current
work.
It does not consider the distribution of quan-
titative values.
The trapezoid membership function
can not consider the real distribution of the dataset,
instead of building a membership function based on
the maximum value, minimum value, and the num-
ber of categories. The distribution is not considered
in this method.
Only categorize dataset with clear
Figure 7: Taxi speed are separated with three main categories
and two fuzzy categories. Those two categories are named
Low-Middle and Mid-High.
IVAPP 2021 - 12th International Conference on Information Visualization Theory and Applications
200

maximum value and minimum value.
Currently, we
can only use the maximum value existed in the dataset
or dataset with a clear boundary. For example, in the
age dataset, the maximum value is
90
, so the maxi-
mum value in this prototype is 90, it is totally based on
the range of the dataset.
Limitation in categorizing
quantities with rounded values
: When we catego-
rize age dataset, the results of categories are not integer,
which leads to the abnormal categories e. g., category
Children is from 0.99 years old to 17.97 years old.
Our main perspective is to validate our approach
using a formal evaluation process to assess how the
fuzzy membership function helps a user categorizing
quantities. The evaluation includes three steps:
1)
manual categories creation; 2) using fuzzy mem-
bership function and 3) post-study questionnaire.
In manual categories creation, investigating How
does a user create categories for datasets such as the
characters in The Simpsons would be a major question
to be answered as in this paper we only reported on
typically used manually created to illustrate our ap-
proach. In this evaluation step, a user will be asked
by questionnaire to focus on the number of categories,
the intervals, and the name of categories, and we will
log the results for remote analysis.
Our study protocol will be as follows (using the
prototype shown in Fig. 3(a)):
Step 1:
we introduce
FUZZYCUT to participants and tell them how to use
and operate FUZZYCUT which will last 10 minutes.
In this part, the user is able to know how to change
parameters of fuzzy membership function and inter-
act with FUZZYCUT to generate and adjust categories.
Step 2:
those parameters, categories, and their inter-
vals are saved remotely by recording every interaction.
Step 3:
all those information collected from a user
are organized and analyzed to support a formalized
function, which is very important for future work to de-
velop specific mapping function because the collected
information will be the major proof of mapping spe-
cific quantities. A post-study questionnaire will collect
feedback, the content of which aims to illustrate if this
tool influences participants’ original intent, and how
those categories change after using this tool.
7 CONCLUSION
This paper introduced an interactive visualization tech-
nique to assist a user in categorizing quantities into
categories. We relied upon a well-known function, the
fuzzy membership function from fuzzy logic theory,
which we implemented as an interactive prototype. We
illustrated its use for 3 case studies: age, temperature,
and taxi speed data. As the prototype enables an ex-
plicit mapping of the categorization function, we plan
to use it to trace the process a user follows when cre-
ating categories. In particular to understand if there
is consensus between groups of users regarding the
choice of categories values interval, labeling, and con-
fidence. We also plan to use the interactive function
to communicate this mapping, e. g., as an interactive
legend (Park and Park, 2010b) for both visual commu-
nication and exploration of datasets.
ACKNOWLEDGMENTS
This work was partially supported by Chinese Schol-
arship Council (CSC). This work was also partially
supported by the M2I project on Urban Mobility
funded by the French Agency for Durable Develop-
ment (ADEME).
REFERENCES
Alsallakh, B., Hanbury, A., Hauser, H., Miksch, S., and
Rauber, A. (2014). Visual methods for analyzing prob-
abilistic classification data. IEEE transactions on visu-
alization and computer graphics, 20(12):1703–1712.
Bostock, M., Ogievetsky, V., and Heer, J. D
³
data-driven
documents. 17(12):2301–2309.
Brodlie, K., Osorio, R. A., and Lopes, A. (2012). A review
of uncertainty in data visualization. In Expanding the
frontiers of visual analytics and visualization, pages
81–109. Springer.
Cao, N., Lin, Y.-R., and Gotz, D. (2015). Untangle map:
Visual analysis of probabilistic multi-label data. IEEE
transactions on visualization and computer graphics,
22(2):1149–1163.
Clifford, H. T., Stephenson, W., Clifford, H., and Stephenson,
W. (1975). An introduction to numerical classification,
volume 240. Academic Press New York.
Cover, T. and Hart, P. (1967). Nearest neighbor pattern clas-
sification. IEEE transactions on information theory,
13(1):21–27.
Dong, X. and Hayes, C. C. (2012). Uncertainty visualiza-
tions: Helping decision makers become more aware of
uncertainty and its implications. Journal of Cognitive
Engineering and Decision Making, 6(1):30–56.
Dressel, J. and Nori, F. (2014). Certainty in heisenberg’s
uncertainty principle: revisiting definitions for esti-
mation errors and disturbance. Physical Review A,
89(2):022106.
Ester, M., Kriegel, H.-P., Sander, J., and Xu, X. Dbscan:
A density-based algorithm for discovering clusters in
large spatial databases with noise. In Proc. 1996
Int. Conf. Knowledge Discovery and Data Mining
(KDD’96), pages 226–231.
Lin, Y.-R., Cao, N., Gotz, D., and Lu, L. (2014). Untangle:
visual mining for data with uncertain multi-labels via
Categorizing Quantities using an Interactive Fuzzy Membership Function
201

triangle map. In 2014 IEEE International Conference
on Data Mining, pages 340–349. IEEE.
MacQueen, J. et al. (1967). Some methods for classification
and analysis of multivariate observations. In Proceed-
ings of the fifth Berkeley symposium on mathematical
statistics and probability, volume 1, pages 281–297.
Oakland, CA, USA.
Massad, E., Ortega, N. R. S., de Barros, L. C., and Struchiner,
C. J. (2009). Fuzzy logic in action: Applications in epi-
demiology and beyond, volume 232. Springer Science
& Business Media.
Park, Y. and Park, J. (2010a). Disk diagram: An interac-
tive visualization technique of fuzzy set operations for
the analysis of fuzzy data. Information Visualization,
9(3):220–232.
Park, Y. and Park, J. (2010b). Interactive visualization of
fuzzy set operations. In Visualization and Data Anal-
ysis 2010, volume 7530, page 753002. International
Society for Optics and Photonics.
Pedrycz, W. and Gomide, F. (2007). Fuzzy systems engineer-
ing: toward human-centric computing. John Wiley &
Sons.
Rheingans, P. and Desjardins, M. (2000). Visualizing high-
dimensional predictive model quality. In Proceedings
Visualization 2000. VIS 2000 (Cat. No. 00CH37145),
pages 493–496. IEEE.
Riche, N. H., Lee, B., and Plaisant, C. (2010). Understanding
interactive legends: a comparative evaluation with stan-
dard widgets. In Computer graphics forum, volume 29,
pages 1193–1202. Wiley Online Library.
Seifert, C. and Lex, E. (2009). A novel visualization ap-
proach for data-mining-related classification. In 2009
13th International Conference Information Visualisa-
tion, pages 490–495. IEEE.
Skeels, M., Lee, B., Smith, G., and Robertson, G. G. (2010).
Revealing uncertainty for information visualization.
Information Visualization, 9(1):70–81.
Zadeh, L. A. (1965). Fuzzy sets. Information and control,
8(3):338–353.
Zadeh, L. A., Klir, G. J., and Yuan, B. (1996). Fuzzy sets,
fuzzy logic, and fuzzy systems: selected papers, vol-
ume 6. World Scientific.
Zhao, Y., Luo, F., Chen, M., Wang, Y., Xia, J., Zhou, F.,
Wang, Y., Chen, Y., and Chen, W. (2018). Evaluat-
ing multi-dimensional visualizations for understanding
fuzzy clusters. IEEE transactions on visualization and
computer graphics, 25(1):12–21.
Zhu, L., Xia, W., Liu, J., and Song, A. (2018). Visualizing
fuzzy sets using opacity-varying freeform diagrams.
Information Visualization, 17(2):146–160.
IVAPP 2021 - 12th International Conference on Information Visualization Theory and Applications
202
