
Automatic Real-time Beat-to-beat Detection of Arrhythmia Conditions
Giovanni Rosa
1 a
, Gennaro Laudato
1 b
, Angela Rita Colavita
2
,
Simone Scalabrino
1 c
and Rocco Oliveto
1 d
1
STAKE Lab, University of Molise, Pesche (IS), Italy
2
ASREM, Regione Molise, Italy
angelaritacolavita@asrem.molise.it
Keywords:
Arrhythmia, ECG, Machine Learning, Decision Support Systems.
Abstract:
With the spread of Internet of Medical Things (IoMT) systems, the scientific community has dedicated a lot of
effort in the definition of approaches for supporting specialized staff in the early diagnosis of pathological con-
ditions and diseases. Several approaches have been defined for the identification of arrhythmia, a pathological
condition that can be detected from an electrocardiogram (ECG) trace. There exist many types of arrhythmia
and some of them present a great impact on the patients in terms of worsening of physical conditions or even
mortality. In this work we present NEAPOLIS, a novel approach for the accurate detection of arrhythmia con-
ditions. NEAPOLIS takes as input a heartbeat signal, extracted from an ECG trace, and provides as output a
5-class classification of the beat, namely normal sinus rhythm and four main types of arrhythmia conditions.
NEAPOLIS is based on ECG characteristics that do not need a long-term observation of an ECG for the classi-
fication of the beat. This choice makes NEAPOLIS a (near) real-time detector of arrhythmia because it allows
the detection within few seconds of ECG observation. The accuracy of NEAPOLIS has been compared to one
of the best and most recent work from the literature. The achieved results show that NEAPOLIS provides a
more accurate detection of arrhythmia conditions.
1 INTRODUCTION
The Internet of Things (IoT) is a neologism referring
to the extension of the Internet to the world of objects
allowing them to collect and exchange data. In the
healthcare sector, IoT plays an important role and rep-
resents a fertile ground. Indeed, healthcare is evolv-
ing, moving from a traditional model in which care
was only provided in hospital centers, to a new model,
where care is accessible from anywhere. This tran-
sition is supported by sensor technology. Nowadays
sensors are able to track almost every parameter of
the human body, such as blood oxygen level, insulin
level, blood pressure, temperature or even chemical
balance, and they can be easily used by patients since
they do not require special training for use (Dimitrov,
2016).
The main advantages of using IoMT (Internet of
Medical Things) are (i) preventive care, because the
a
https://orcid.org/0000-0002-5241-1608
b
https://orcid.org/0000-0002-3776-2848
c
https://orcid.org/0000-0003-1764-9685
d
https://orcid.org/0000-0002-7995-8582
data collected from patients can help to identify the
first symptoms and possible health risks, allowing to
act promptly, and (ii) long-term care and chronic dis-
eases, because the fact of being able to collect patient
data and make them available to health professionals
makes treatment procedures much easier, faster and
more comfortable. In cases of chronic diseases, being
connected is of great help because the devices allow
patients to constantly monitor health status indicators,
follow therapy independently with higher security and
collect biometric data in real-time during therapy.
ATTICUS is an example of IoMT system—
recently proposed by Balestrieri et al. (2019)—that
constantly monitors electrocardiogram (ECG), respi-
ration, temperature, skin response and dynamics of a
patient. In ATTICUS vital signals are acquired by a
smart wearable and automatically analyzed by an Ar-
tificial Intelligence (AI) component to detect anoma-
lies and critical health conditions. Such alarms are
forwarded to a specialist doctor or can even alert a
prompt intervention of hospital staff. Thus, it is of
vital importance in ATTICUS to have accurate and
real-time analysis of the acquired data.
212
Rosa, G., Laudato, G., Colavita, A., Scalabrino, S. and Oliveto, R.
Automatic Real-time Beat-to-beat Detection of Arrhythmia Conditions.
DOI: 10.5220/0010267902120222
In Proceedings of the 14th International Joint Conference on Biomedical Engineering Systems and Technologies (BIOSTEC 2021) - Volume 5: HEALTHINF, pages 212-222
ISBN: 978-989-758-490-9
Copyright
c
2021 by SCITEPRESS – Science and Technology Publications, Lda. All rights reserved

In the context of ATTICUS we devised NEAPO-
LIS, a NovEl APproach for the autOmatic reaL-time
beat-to-beat detectIon of arrhythmia conditionS, such
as Bundle Branch Block (BBB), Premature Ventric-
ular Contractions (PVC) and Atrial Premature Beats
(APB). Arrhythmia can describe a disorder that af-
fects the regularity of the heart rhythm, by observing
too fast or too slow rhythm. Arrhythmia can be cat-
egorized into two types: atrial and ventricular. Es-
pecially this latter kind of arrhythmia may be very
dangerous. Therefore, without a continuous monitor-
ing and the right attention, ventricular arrhythmia can
lead to sudden cardiac arrest (Elhaj et al., 2016).
NEAPOLIS performs the classification of heart
beat by extracting a set of features from an ECG trace
and providing them to a machine learning component.
The common characteristic among all the features that
NEAPOLIS extracts from the ECG is that they are
real-time, i.e., they do not need any long-term obser-
vation of the ECG.
A lot of effort has been dedicated by the sci-
entific community to the definition of methods for
the automatic detection of arrhythmia conditions (Bai
et al., 2019; Jung and Kim, 2017; Pandey and Janghel,
2020; Smisek et al., 2018; Talbi and Ravier, 2016).
The accuracy of NEAPOLIS has been compared to
the approach proposed by Pandey and Janghel (2020)
since—to the best of our knowledge—this approach
is one of the most accurate in the literature and pro-
vides the same 5-class classification of heart beat
of NEAPOLIS. However, the method proposed by
Pandey and Janghel (2020) requires a long-term ob-
servation of the ECG, by extracting from features the
ECG trace that are computed on the past 20 minutes
of the ECG. The unique characteristics of NEAPO-
LIS allows to obtain a classification in a much shorter
time. Indeed, in NEAPOLIS eleven beats are required
to compute all the features used by our approach to
perform the classification. Therefore, for a subject
with a heart rate value of 60 bpm the first classifi-
cation can be performed after 11 seconds + t, where
t represents the computational time of NEAPOLIS to
build and classify the features vector (that is, however,
negligible). An empirical evaluation conducted on the
Physionet MIT-BIH arrhythmia database provides ev-
idence of the benefits provided by NEAPOLIS also in
terms of classification accuracy.
The rest of the paper is structured as follows.
Section 2 provides background information on ap-
proaches for heart beat classification. Section 3
presents NEAPOLIS, while Section 4 and Section 5
report the design and the results of the empirical study
we conducted to evaluate NEAPOLIS, respectively.
Finally, Section 6 concludes the paper.
2 BACKGROUND
This section discusses (i) the incidence of arrhythmia
conditions on the health status; and (ii) the approaches
proposed in the literature for the automatic classifica-
tion of arrhythmia conditions. The chosen baseline
method used in the evaluation of NEAPOLIS is de-
scribed in more details in a dedicated subsection.
2.1 Incidence of Arrhythmia Conditions
A bundle branch block can be defined as an abnor-
mality of the electrical conduction system of the heart
(Fahy et al., 1996). In case the defect is originated
in the left or right ventricles the blocks are further
classified into Right BBB (RBBB) and Left BBB
(LBBB). Scientific research studies have reported that
BBB has been observed in 8% to 18% of subjects
with acute myocardial infarction. It has also been
associated with an increased risk of complete heart
block and sudden death (Kones and Phillips, 1980;
Newby et al., 1996). Before the involvement of
thrombolytic treatment—that limits infarct size, im-
proves ventricular morphology and function, and de-
creases mortality—several studies had reported on the
incidence of RBBB in patients with acute myocar-
dial infarction (Melgarejo-Moreno et al., 1997). The
range of incidence rate was found to be between the
3% and 29% (Col and Weinberg, 1972; Julian et al.,
1964).
It was also found that RBBB is usually the mani-
festation of infarctions. These latter are often accom-
panied by heart failure, complete AV block, arrhyth-
mias, and a high mortality rate (Atkins et al., 1973;
Mullins and Atkins, 1976; Rizzon et al., 1974). With
regard to the LBBB, the incidence in the general pop-
ulation is low, approximately 0.6% of subjects devel-
oping it over 40 years (Clark et al., 2008; Imanishi
et al., 2006). The incidence rate changes if consid-
ering patients with chronic heart failure. Indeed, ap-
proximately one third of these patients have left bun-
dle branch block (LBBB) on their 12-lead ECG (Bal-
dasseroni et al., 2002; Shenkman et al., 2002).
In the absence of structural heart disease, frequent
PVCs have traditionally been considered a benign
phenomenon, only requiring medical attention when
symptomatic. This understanding has undergone a
substantive evolution over the last decade. So-called
benign PVCs are now known to have malignant po-
tential in susceptible patients and can manifest as trig-
gers for ventricular fibrillation (VF) and sudden car-
diac death (Ip and Lerman, 2018).
Ranging from 20% to 25% of ischemic strokes
occur due to embolic complications caused by atrial
Automatic Real-time Beat-to-beat Detection of Arrhythmia Conditions
213

fibrillation (Evans et al., 2000; Hart, 2003). In ad-
dition, for patients that have experienced ischemic
stroke or transient ischemic attacks, in presence of AF
they can be exposed to recurrent strokes (Wallmann
et al., 2007). Therefore, it is vital to detect paroxys-
mal atrial fibrillation after stroke or transient ischemic
attack and involve anticoagulation treatment in such
patients (Hart et al., 2003; van Walraven et al., 2003).
This diagnose typically includes a 24 hours continu-
ously monitoring. One of the clues that can lead to a
early diagnosis of paroxysmal atrial fibrillation are the
occurrence of atrial premature beats (APB). Indeed,
in 24-hour ECG recordings frequent APB are corre-
lated to an increased incidence of paroxysmal AF in
patients with ischemic stroke(Wallmann et al., 2003).
2.2 Classification of Heartbeats
Zhao and Zhang (2005) proposed an approach for
the extraction of features that allows a reliable heart
rhythm recognition. They basically used two tech-
niques for the features generation: wavelet was used
to extract the coefficients of the transform and au-
toregressive modelling (AR) to obtain the temporal
structures of ECG waveforms. Then, wavelet and AR
coefficients were concatenated together to form the
feature vector for the classification. They evaluated a
large set of outputs that include also our target con-
ditions, but they chose to experiment the method on
a subset of the available recordings from the MIT-
BIH Arrhythmia
1
, a freely accessible and common
database of the scientific literature with annotation at
heartbeat level. The results showed that the approach
provided good performances of classification reach-
ing an accuracy of 99.68%.
Li and Zhou (2016) proposed a method for ECG
classification using entropy on Wavelet packet de-
composition (WPD) and random forests. The au-
thors also experimented the devised method on the
MIT-BIH Arrhythmia database but with a differ-
ent output because they conducted another kind of
experiment, focused on a medical standard, i.e.,
the EC57:1998 standard (ANSI/AAMI-EC57, 1998).
The authors stated that although the coefficients by
Discrete Wavelet Transform (DWT) or WPD can re-
veal the local characteristics of an ECG signal, the
number of such coefficients is usually so huge that
it is hard to use them as features for classification
directly. Therefore, they extracted some high-level
features from these coefficients for better classifica-
tion. In the proposed method, they chose the entropy
as high level features extractor from a DWT. The re-
1
https://archive.physionet.org/physiobank/database/mitdb/
sults reported on an obtained overall accuracy approx-
imately equal to 94.5%.
Another very important set of features is the one
proposed by Leonarduzzi et al. (2010), i.e., a set of
features derived from the multifractal analysis. The
authors stated that this analysis highly suits the anal-
ysis of the Heart Rate Variability (HRV) fluctuations,
since it gives a description of the singular behavior of
a signal. Therefore, the main features of this work are
based on the multifractal wavelet leader estimates of
the second cumulant of the scaling exponents and the
range of Holder exponents, or singularity spectrum.
The results demonstrated how these features can be
involved in a tool for a precise detection of myocar-
dial ischemia.
Many works from the scientific literature have
involved the Fast Fourier Transform (FFT) in their
methods for the classification of ECG segments. For
instance, Haque et al. (2009) proposed a combination
of FFT-based and wavelet features. The main findings
achieved by the authors was that the wavelet can pro-
vide better indicators—rather than the FFT—of small
abnormalities in ECG signals.
2.3 The Selected Baseline
We chose as baseline for the evaluation of NEAPOLIS
the approach proposed by Pandey and Janghel (2020).
The choice is not random: the selected approach pro-
vides a complete automatic detection of heartbeats in
five heartbeat types, including the LBBB, RBBB and
PVC, i.e., the same of NEAPOLIS. The selected ap-
proach is based on a single Long Short-Term Memory
(LSTM) Neural Network as model. The inputs to the
model were based on higher-order statistics, wavelets,
morphological descriptors, and R–R intervals. Thus,
45 features were in charge of describing the electro-
cardiogram signals. In details, to extract the features,
the authors designed a temporal window of 180 sam-
ples sized (half of a second on the MIT-BIH Arrhyth-
mia). The window was centered on each R peak, pre-
viously obtained thanks to the annotations of each R
wave position available from this database. The fea-
tures have been evaluated only inside this interval.
A 2-fold cross validation was used to evaluate the
accuracy of the classification: The entire MIT-BIH ar-
rhythmia database was divided in two folds, i.e., two
sub-dataset. Their LSTM model was trained on 40 %
(80 % of 50 %) sub-dataset, and 10 % (20 % of 50
%) sub-dataset was dedicated to a preliminary valida-
tion phase. The remaining 50 % of the data set was
used for testing. After the performance evaluation, the
model obtained an overall accuracy equal to 99.37%.
HEALTHINF 2021 - 14th International Conference on Health Informatics
214
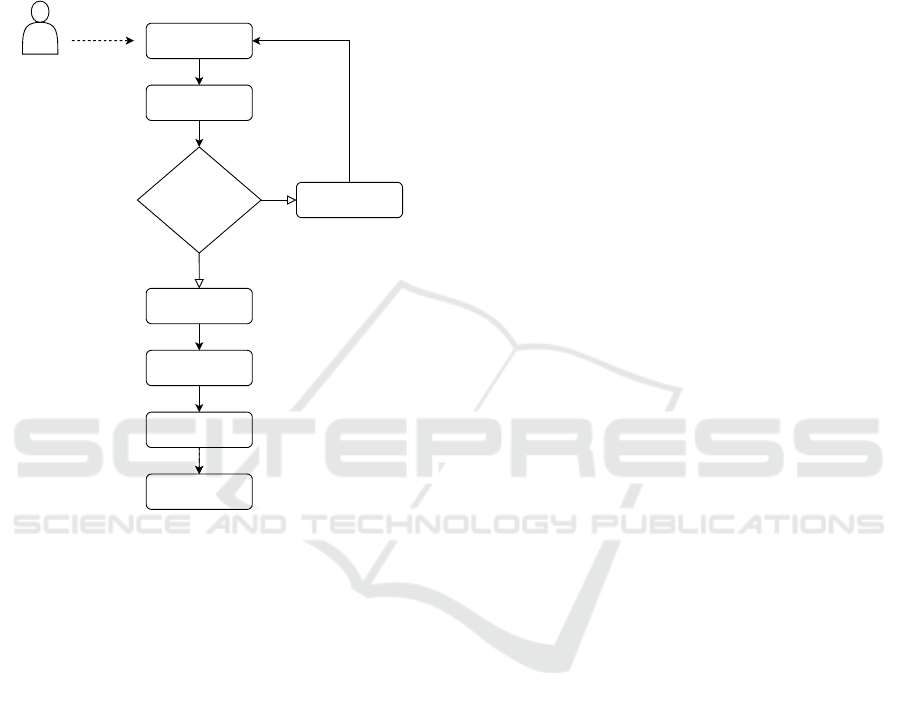
3 NEAPOLIS IN A NUTSHELL
In this section, we present NEAPOLIS, an online de-
tector of important arrhythmia conditions, such as
BBB and PVC, based on the analysis of heartbeat sig-
nals. The high-level workflow of NEAPOLIS is de-
picted in Figure 1.
Input ECG signal
No
Count of R-peaks in
input signal> 11 ?
Buffering
Feature extraction
Beat segmentation
QRS detector for
R-peaks
Yes
2-step median filter
Patient
Beat classification
Figure 1: The workflow of NEAPOLIS for online beat clas-
sification.
Once buffered a small segment—i.e., at least
11 heartbeats—of a single lead digital ECG signal,
NEAPOLIS operates to compute a beat-to-beat seg-
mentation. Then, a 2-step median filter is applied
to get rid of baseline drifts. Finally, NEAPOLIS—
through specific algorithms—evaluates the features
on the signal, scale them and creates the final feature
vector to be submitted to the machine learning model
as input. Last task of NEAPOLIS is to provide a label
for the most probable classification among N (Normal
Sinus Rhythm), RBBB (Right Bundle Branch Block),
LBBB (Left Bundle Branch Block), PVC (Premature
Ventricular Contraction), and APB (Atrial Premature
Beat). Next subsections describe the main compo-
nents of NEAPOLIS in detail.
3.1 ECG Digital Processing
The digital signal processing embedded in NEAPO-
LIS can be conceptually divided in preprocessing and
main processing. Both these procedures are triggered
only when a long enough portion of a digital single
lead ECG is buffered. Once these two steps are com-
pleted, the features can be extracted from the obtained
signal.
3.1.1 Preprocessing
The preprocessing step of NEAPOLIS is the same pro-
posed by Pandey and Janghel (2020). Therefore, only
the baseline removal has been performed. Specifi-
cally, it concerns with the application of two median
filters: a median filter of 200 ms is applied on the raw
signal, a second median filter of 600ms is applied on
the resulting signal from the previous step.
3.1.2 Beat-to-beat Segmentation
This procedure is the same proposed by Pandey and
Janghel (2020). Especially, NEAPOLIS needs to em-
bed a QRS detector, such as the consolidated algo-
rithm proposed by Pan and Tompkins (1985). Once
evaluated each R peak position in the buffered ECG,
the segmentation process can start. The procedure is
based on the evaluation of a window of 180 samples to
be centered on an R peak. After, the selection of the
samples included in the window is performed. This
leads to the definition of a heartbeat signal, i.e., a sam-
ple vector of length 180 centered on an R peak.
3.2 Heartbeat Features
Due to their promising performance in prior simi-
lar works, we combined a set of morphological fea-
tures already used in literature for ECG classification.
NEAPOLIS differs from the state of the art approaches
because of the constraint on the real-time detection.
Indeed, only a very limited buffering of an ECG sig-
nal is needed so that the detection of arrhythmia is
promptly offered. Next subsections describe in detail
the features extracted by NEAPOLIS.
3.2.1 Energy of Maximal Overlap Discrete
Wavelet Transform
The wavelet transform (WT) is a mathematical oper-
ator that can be used for the decomposition of time
series signals into distinct subsignals. One of the
two forms of WT is the DWT. The maximum overlap
discrete wavelet transform (MODWT) is a modified
DWT. In the MODWT, there is no process of subsam-
pling, therefore leading to a higher level of informa-
tion in the resulting wavelet and scaling coefficients,
when compared to the DWT (Ghaemi et al., 2019).
For our purposes, we evaluated the MODWT and then
extracted the energy features according to the follow-
ing steps: (i) selection of a mother wavelet function W
Automatic Real-time Beat-to-beat Detection of Arrhythmia Conditions
215

and the decomposition level L; (ii) decomposition of
the original heartbeat signals according to the spec-
ified W and L; and (iii) calculation of the energy of
each coefficient in each node in the last level L. This
procedure has also been partially considered in the
feature extractor proposed by Li and Zhou (2016). In
our case, we used db2 as Daubechies wavelet function
and three levels of decomposition.
3.2.2 Autoregressive Model (AR)
As suggested in the method proposed by Zhao and
Zhang (2005), we involved the calculation of the Au-
toregressive model (AR) coefficients of order 4. As
outcomes, we evaluated the AR coefficients and the
reflection coefficients, using the Yule-Walker estima-
tor (Friedlander and Porat, 1984).
3.2.3 Multifractal Wavelet Leader
The goal of multifractal analysis is to study signals
that present a point-wise Holder regularity variable,
i.e., that may largely vary from point to point. When
dealing with a signal, performing the multifractal
analysis refers to the estimation of its spectrum of sin-
gularities. Therefore, the determination of the spec-
trum of singularities of a signal is important to an-
alyze its singularities (Leonarduzzi et al., 2010). In
case of a real-life signal, it cannot be numerically
evaluated due to constraint like finite resolution and
the sampling of signals (Lashermes et al., 2005). To
overtake this limitation, a multifractal formalism was
introduced: the wavelet leaders (Jaffard et al., 2006).
In NEAPOLIS, we involved the multifractal wavelet
leader estimates of the log-cumulants of the scaling
exponents.
3.2.4 Fast Fourier Transform
Our approach embeds the evaluation of the Fast
Fourier Transform on the heartbeat signal. Indeed,
FFT represents a method for extracting helpful infor-
mation out of statistical features of ECG signal.
3.2.5 R-R Interval Descriptors
This set of features is basically composed of three fea-
tures:
• pre-RR interval: the distance between the actual
and previous heartbeat;
• post-RR interval: the distance between the actual
and next heartbeat;
• local-RR interval: the average of 10 previous pre-
RR values.
These features have been proposed by Pandey and
Janghel (2020), where they belonged to a larger set
of R-R statistical descriptors. We opted to embed in
NEAPOLIS only the features with an acceptable ECG
buffering. Indeed, we avoid to integrate in NEAPO-
LIS the global-RR interval presented by Pandey and
Janghel (2020) because it represented the average of
all the pre-RR values present in the last 20 min. This
would have compromised the constraint of NEAPO-
LIS to be a real-time detector.
3.3 Beat Classification
Once extracted, the features described in Section 3.2
are normalized, in order to transform the features in
a predefined range of values. We also apply a tech-
nique of sampling of the instances to deal with data
unbalance.
After these further elaborations, the features are
provided to a machine learning classifier for the fi-
nal classification of the heartbeat in N (Normal Si-
nus Rhythm), RBBB (Right Bundle Branch Block),
LBBB (Left Bundle Branch Block), PVC (Prema-
ture Ventricular Contraction), and APB (Atrial Pre-
mature Beat). NEAPOLIS has not been designed for
a specific machine learning technique. The only con-
straint is represented by the use of a supervised tech-
nique. During the evaluation of NEAPOLIS we exper-
imented several machine learning techniques.
4 STUDY DESIGN
The goals of this study are (i) understanding which
are the most important descriptors of a heartbeat sig-
nal in applications of automatic detection of arrhyth-
mia conditions, such as the LBBB, RBBB, PVC and
APB and (ii) comparing NEAPOLIS with the selected
baseline. Thus, our study is steered by the following
research questions:
RQ
1
: What are the most important features
for the beat-to-beat classification of arrhyth-
mia conditions?
RQ
2
: Which is the accuracy of NEAPOLIS?
With these research questions, we can distinguish
two objectives. With RQ
1
, we want to understand if
some of the features we define can be discarded to ob-
tain a higher classification accuracy while with RQ
2
we want to see if NEAPOLIS can reach a classifica-
tion accuracy comparable to similar state of the art
methods, especially to those that can be classified as
off-line approaches, i.e., that embed features requir-
ing a long-term observation of an ECG.
HEALTHINF 2021 - 14th International Conference on Health Informatics
216
4.1 Context of the Study
The context of our study is represented by the Phy-
sionet MIT-BIH arrhythmia database (Goldberger
et al., 2000; Moody and Mark, 2001), a state-of-art
database widely used in literature as reference data
set for arrhythmia detection (Moody and Mark, 2001).
It is composed of 48 ambulatory ECG recordings.
The acquisition was performed with a sampling fre-
quency of 360 Hz. Each recording has two channels
available: one is the modified lead II (MLII) and the
other can vary between V1, V2, V4 or V5. Heart-
beat annotations were provided by cardiologists. The
total number of labelled heartbeats is approximately
110,000 divided into 15 different beat types.
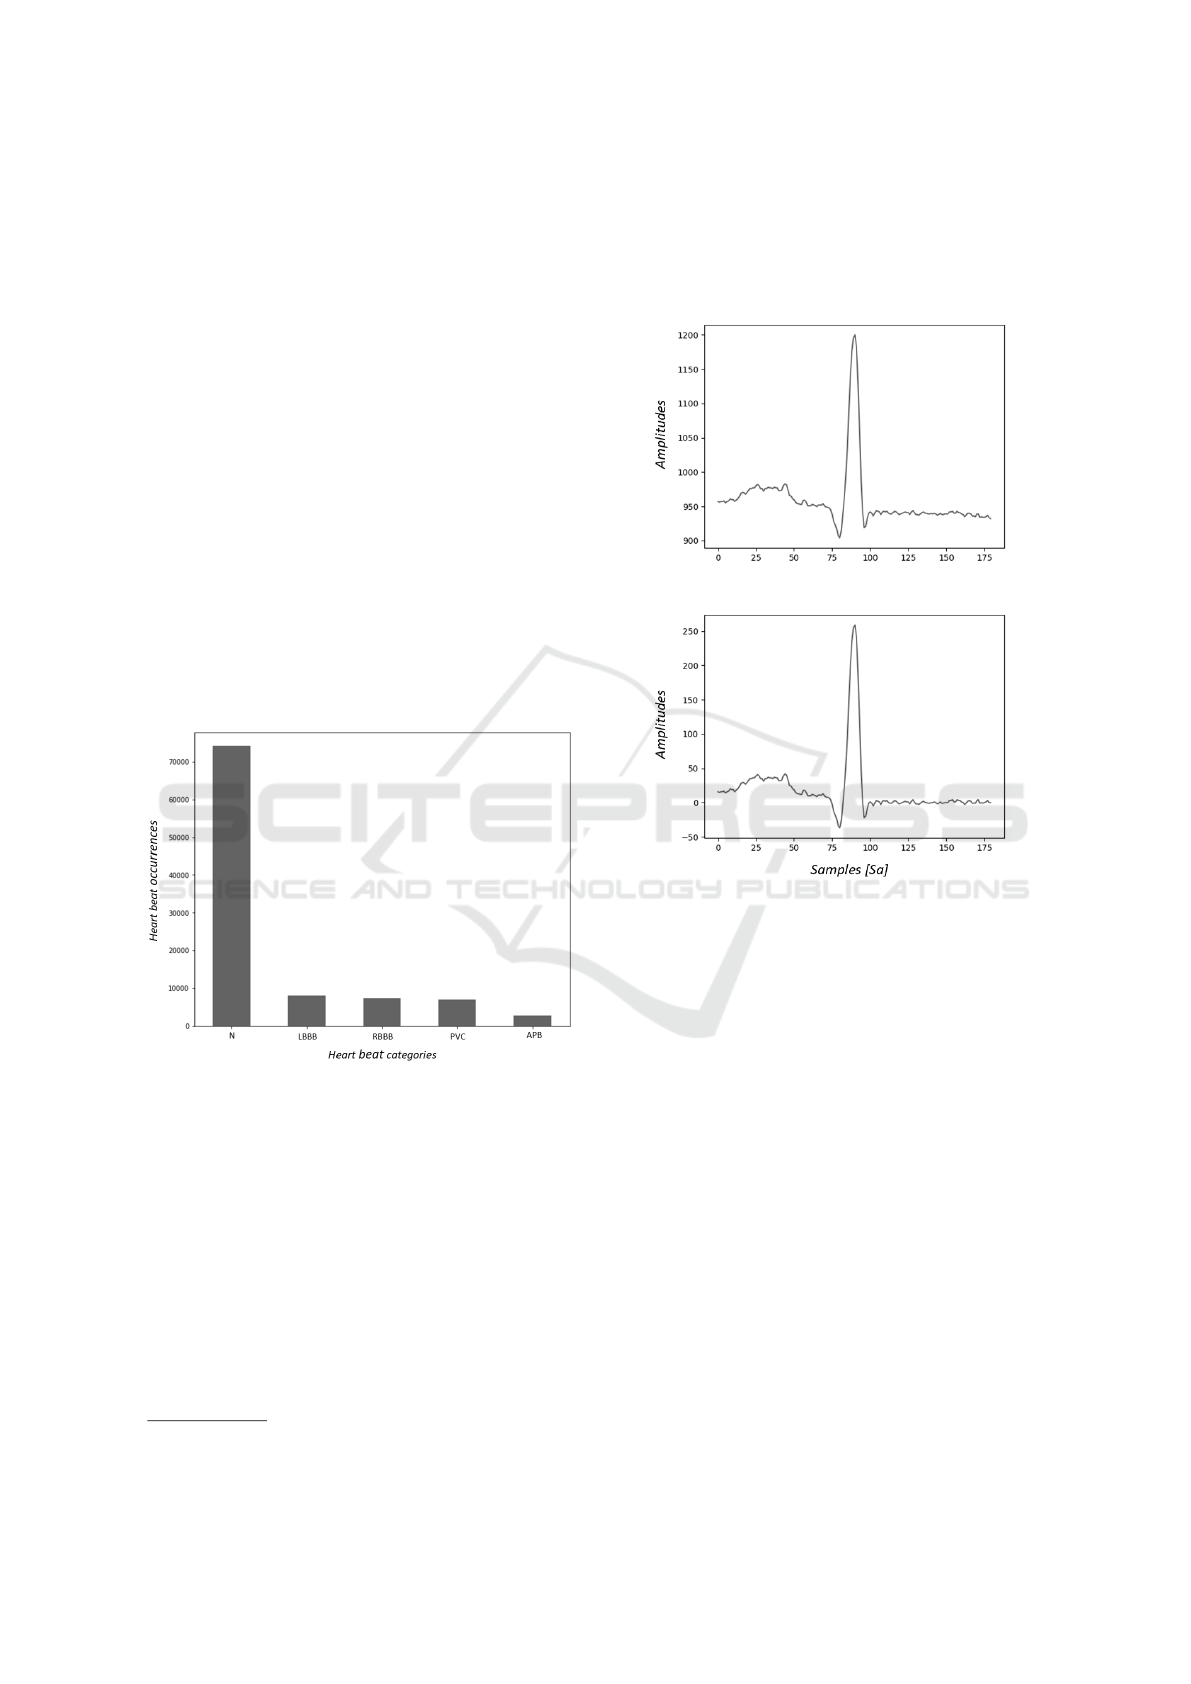
According to a consolidated procedure on this
database (Xu et al., 2018), the records with paced
beats, namely 102, 104, 107 and 217 have been ex-
cluded from the study. The experiment was conducted
on the remaining 44 records and considering 5 types
of beats annotations: N, LBBB, RBBB, APB and
PVC. Figure 2 shows the distribution of such types
of beats in the dataset.
Figure 2: Count of selected heartbeat types from the MIT-
BIH arrhythmia database (Moody and Mark, 2001).
4.2 Experimental Procedure
This section details the experimental procedure we
follow to answer our research questions.
4.2.1 RQ
1
: Feature Analysis
Using wfdb
2
toolkit we extracted raw signals and an-
notations from the arrhythmia database. Since the
annotations contain both R-peak positions and beat
types, we used the former information to split the sig-
nals in beat segments and the latter to filter beats by
2
https://archive.physionet.org/physiotools/wfdb.shtml
the selected types for this study. After this, we pre-
processed the signals following the procedure detailed
in Section 3.1.1. Finally, we subtracted the filtered
signal from the raw one, obtaining a signal with cor-
rected baseline, as depicted in Figure 3.
Figure 3: An example of a raw beat (on top) and the same
beat with the 2-step median filter applied.
For each ECG segment obtained from the above
elaboration steps, we computed the features gener-
ation through the algorithms described in section 3.
The features vector was therefore composed of the
record id (a code used by Physionet to indicate a pa-
tient), the computed features and the label indicating
the heartbeat class.
To answer RQ
1
, we conducted a features analysis
on this data set. The first step has been focused on an
analysis based on the Pearson correlation coefficient
r. Indeed, we removed the features having r greater
than 0.9. Afterwards, we did another step of features
selection based on importance weights using a tree-
based classifier as estimator. The features importance
is computed as the contribution of a feature to max-
imize the split criterion used by the algorithm, also
defined as the minimization of the impurity of child
nodes, i.e., Gini impurity (Breiman et al., 1984).
In this way, starting from an initial set of 160 fea-
tures, we selected only 39 and filtered the data set ac-
cordingly.
Automatic Real-time Beat-to-beat Detection of Arrhythmia Conditions
217

4.2.2 RQ
2
: NEAPOLIS Accuracy
With the purpose at answering RQ
2
, we first evalu-
ated the accuracy of NEAPOLIS by using different
Machine Learning algorithms such as Random Forest
(Ho, 1998), Support Vector Machine (Noble, 2006),
k-nearest neighbors (Cunningham and Delany, 2020)
and Multi-layer Perceptron (Hinton, 1990). In ad-
dition, we distinctly involved in the experimentation
two consolidated state of the art approaches for han-
dling with the problem of data unbalance. Specif-
ically, we used (i) SMOTE (Chawla et al., 2002),
which makes an over-sampling of the minority class
by creating synthetic minority class examples and
(ii) Tomek’s links, an undersampling techniques pre-
sented by Tomek (1976). We also tested standard-
ization and scaling techniques based on the type of
classifier used. For example, we used standardization
with Support Vector Machine and min-max scaling
with Random Forest.
Once identified the best configuration for NEAPO-
LIS, we compare its accuracy with our baseline
(Pandey and Janghel, 2020). The two approaches
have been compared by using the following class-
level metrics:
• Sensitivity, i.e., the number of correctly classified
positive instances divided by the sum between the
number of instances correctly classified as pos-
itive and the instances misclassified as negative,
computed as
T P
T P+FN
• Specificity, i.e., the number of correctly classified
negative instances divided by the sum between the
number of instances correctly classified as neg-
ative and the instances misclassified as positive,
computed as
T N
T N+FP
• Precision, i.e., the number of correctly classi-
fied positive instances divided by the total num-
ber of instances classified as positive, computed
as
T P
T P+FP
• F1, i.e., the harmonic mean of precision and re-
call, computed as
2×TP
(2×TP)+FN+FP
As for the validation, we followed the same pro-
tocol as the one proposed in our baseline (Pandey and
Janghel, 2020), i.e., a stratified split of the data set in
two sub data sets, namely DS1 and DS2. The result of
the stratified split procedure is that both DS1 and DS2
contains a proportional number of instances, based on
classes (i.e., the beat types). Such a decomposition of
the data set is depicted in Table 1.
In this way, we obtained two sub data sets where
DS1 was used for training and DS2 for testing only.
According to the validation protocol exhibited by
Pandey and Janghel (2020), the training set in turn
Table 1: Stratified split of the data set used for the classifi-
cation experiment.
Beat type DS1 DS2
APB 1,269 1,269
LBBB 4,023 4,023
N 37,109 37,109
RBBB 3,606 3,607
PVC 3,440 3,440
Total 49,447 49,448
was further split in 80% and 20% for a preliminary
validation. In this way, for each model, in the train-
ing phase it is performed a preliminary validation on
DS1. Then, the final testing was performed on DS2.
To avoid any convenient split of the original data
set into DS1 and DS2, we have repeated the splitting
process several times, in order to have results less af-
fected by the randomness. Especially, we selected
1,000 random seeds and then for each seed we re-
peated (i) the stratified split in DS1 and DS2 and (ii)
the individual split of DS1. This means that we chose
to repeat the complete validation protocol for 1,000
times and average the results accordingly.
5 ANALYSIS OF THE RESULTS
This section describes the results achieved aiming at
answering our research questions.
5.1 RQ
1
: Feature Analysis
The main results of the experiment conducted to an-
swer RQ
1
are depicted in Figure 4. We used a Ran-
dom Forest classifier with a threshold of 1.25 * me-
dian of the features importance. Specifically, in the
figure we exhibit the five features with the highest
weight.
In details, we obtained that the feature with the
highest weight is the first reflection coefficient from
the AR model. Almost with the same weights, we can
find the fourth descriptor from the MODWT model
and the pre-RR interval. Finally, the first and third
coefficients, from the FFT, are also included in the
top-5 ranking.
5.2 RQ
2
: NEAPOLIS Accuracy
As designed, we experimented several machine learn-
ing technique to identify the best configuration for
NEAPOLIS. The best configuration found is the one
composed of SMOTE, min-max scaler and Random
Forest, this latter set with 100 estimator trees. The
classification accuracy achieved by NEAPOLIS using
HEALTHINF 2021 - 14th International Conference on Health Informatics
218
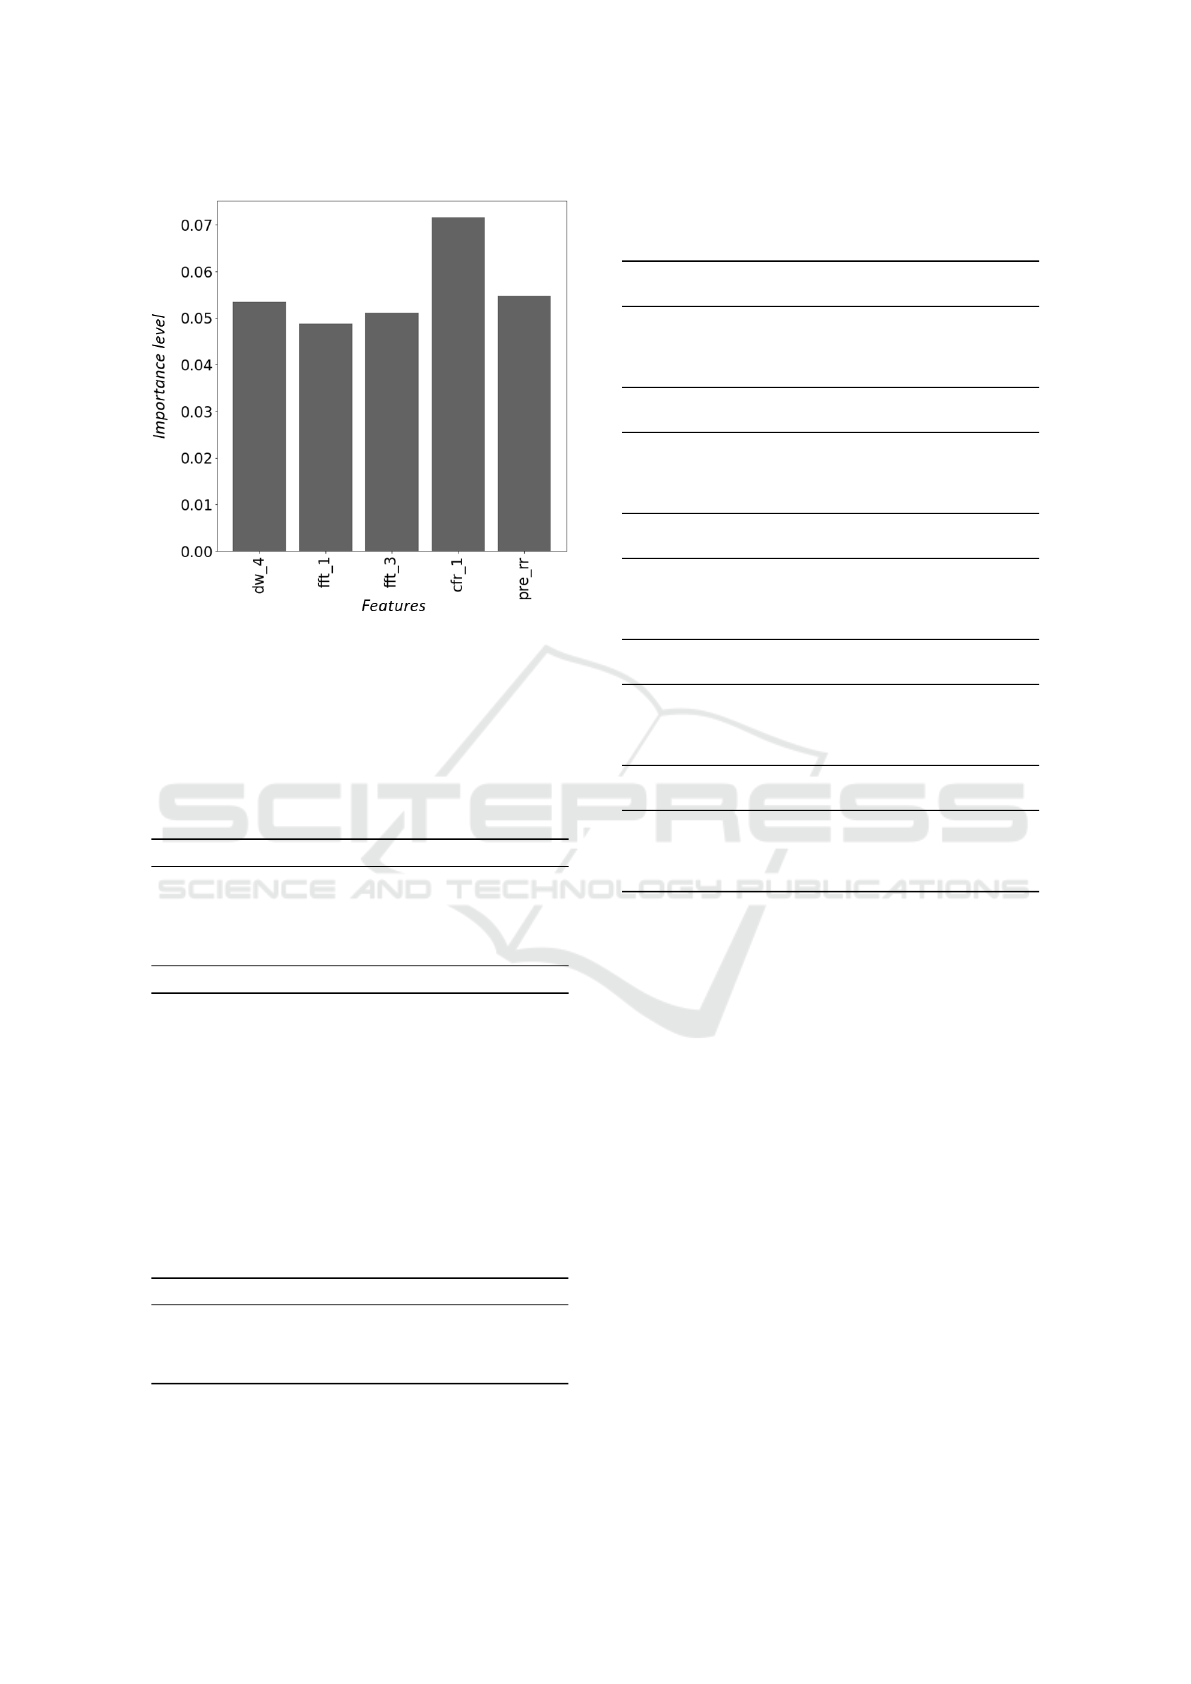
Figure 4: Top five selected features using importance
weight.
such a configuration is reported in Table 2. It is worth
noting that such a configuration of NEAPOLIS is used
for the comparison with our baseline.
Table 2: NEAPOLIS’s classification metrics computed on
the validation set DS2. Those values are averaged among
the 1,000 runs of our validation protocol.
Beat type Sensitivity Specificity Precision F1
APB 90.48 99.81 92.49 91.47
LBBB 98.53 99.96 99.50 99.01
N 99.34 98.29 99.43 99.39
RBBB 99.18 99.97 99.68 99.43
PVC 98.28 99.61 95.02 96.62
avg 97.16 99.53 97.22 97.18
Table 3 reports the comparison—in terms of over-
all accuracy—between NEAPOLIS and the selected
baseline. Considering the average of the overall met-
rics, NEAPOLIS outperforms the state of the art base-
line method in terms of sensitivity, specificity, preci-
sion and F1 score. In particular—with regards to the
sensitivity and F1 score—the improvement is greater
than 2% and 1% respectively.
Table 3: Comparison of NEAPOLIS with the chosen base-
line (Pandey and Janghel, 2020) in terms of Sensitivity,
Specificity, Precision and F1 score.
Avg metrics NEAPOLIS (Pandey et al., 2020) Delta
Sensitivity 97.16 94.89 + 2.27
Specificity 99.53 99.14 + 0.39
Precision 97.22 96.73 + 0.49
F1 score 97.18 95.77 + 1.41
Performing a class level analysis (see Table 4),
what emerges from the classification results is that
Table 4: Comparison of NEAPOLIS with the chosen base-
line (Pandey and Janghel, 2020) at class level in terms of
Sensitivity, Specificity, Precision and F1 score.
Class N
Metrics NEAPOLIS (Pandey et al., 2020) Delta
Sensitivity 99.34 99.31 + 0.03
Specificity 98.29 96.45 + 1.84
Precision 99.43 98.84 + 0.59
F1 score 99.39 99.07 + 0.32
Class LBBB
Metrics NEAPOLIS (Pandey et al., 2020) Delta
Sensitivity 98.53 97.52 + 1.01
Specificity 99.96 99.92 + 0.04
Precision 99.50 99.05 + 0.45
F1 score 99.01 98.28 + 0.73
Class RBBB
Metrics NEAPOLIS (Pandey et al., 2020) Delta
Sensitivity 99.18 98.97 + 0.21
Specificity 99.97 99.93 + 0.04
Precision 99.68 99.05 + 0.63
F1 score 99.43 99.01 + 0.42
Class PVC
Metrics NEAPOLIS (Pandey et al., 2020) Delta
Sensitivity 98.28 95.18 + 3.10
Specificity 99.61 99.63 -0.02
Precision 95.02 95.07 -0.05
F1 score 96.62 95.13 + 1.49
Class APB
Metrics NEAPOLIS (Pandey et al., 2020) Delta
Sensitivity 90.48 83.48 + 7.00
Specificity 99.81 99.79 + 0.02
Precision 92.49 91.64 + 0.85
F1 score 91.47 87.37 + 4.10
NEAPOLIS, with regard to the LBBB class, shows an
improvement greater than 1% and 0.5% only for Sen-
sitivity and F1-score respectively while for the other
metrics the results are almost the same. As far as
RBBB class, NEAPOLIS shows a slight improvement
for all the classification metrics except for the Preci-
sion that has a delta greater than 0.5%. PVC Class is
the only one that has registered a decrease—that how-
ever does not exceed 0.05%—in terms of Specificity
and Precision. On the contrary, NEAPOLIS shows a
significant impact in terms of Sensitivity and F1 score
for the same class, i.e., greater than 3% and 1% re-
spectively. With respect to the APB class, the im-
provement of NEAPOLIS is not significant in terms
of Specificity and Precision but very high in terms of
Sensitivity and F1 score, i.e., equal to 7% and greater
than 4%, respectively. Finally, for what concerns
the N class, i.e., the normal heart beats, NEAPOLIS
outperforms—even slightly—the baseline method in
terms of all the classification metrics.
Automatic Real-time Beat-to-beat Detection of Arrhythmia Conditions
219

6 CONCLUSION
We have presented NEAPOLIS, an automatic real-
time detector of arrhythmia conditions that works at
heartbeat level. Thanks to the combination of tech-
niques of (i) signal processing, (ii) features analysis
and (iii) machine learning, NEAPOLIS has shown bet-
ter results than one of the most accurate state of the
art method. Specifically, in terms of average classifi-
cation metrics, NEAPOLIS outperforms the baseline
work presented by Pandey and Janghel (2020).
The main advantage of NEAPOLIS—with respect
to state of the art tool—is that it can be easily involved
in online scenarios of modern IoMT systems. Indeed,
the proposed approach embeds only features that al-
low to obtain a prompt early diagnosis of arrhythmia
conditions. In few words, NEAPOLIS does not embed
features that need a long-term buffering and elabora-
tion of the ECG.
As part of our future agenda, we aim at improving
the validation technique by involving a scheme that
avoids the random split, i.e., that separates the data
between train and test belonging to the same subject.
In addition, we will try to improve the accuracy of
NEAPOLIS by performing a fine tuning of the param-
eters of the machine learning models. We also plan
to experiment Artificial Neural Networks as machine
learning technique.
ACKNOWLEDGMENT
Angela Rita Colavita, Rocco Oliveto, Giovanni Rosa
and Simone Scalabrino have been supported by the
project PON 2014-2020—ARS01 00860 “ATTICUS:
Ambient-intelligent Tele-monitoring and Telemetry
for Incepting and Catering over hUman Sustainabil-
ity” funded by the Ministry of Education, University
and Research—RNA/COR 576347.
REFERENCES
ANSI/AAMI-EC57 (1998). Testing and reporting perfor-
mance results of cardiac rhythm and ST segment mea-
surement algorithms. Standard, Association for the
Advancement of Medical Instrumentation, Arlington,
VA.
Atkins, J. M., Leshin, S. J., Blomqvist, G., and Mullins,
C. B. (1973). Ventricular conduction blocks and
sudden death in acute myocardial infarction: poten-
tial indications for pacing. New England Journal of
Medicine, 288(6):281–284.
Bai, J., Mao, L., Chen, H., Sun, Y., Li, Q., and Zhang, R.
(2019). A new automatic detection method for bun-
dle branch block using ecgs. In International Confer-
ence on Health Information Science, pages 168–180.
Springer.
Baldasseroni, S., Opasich, C., Gorini, M., Lucci, D., Mar-
chionni, N., Marini, M., Campana, C., Perini, G., De-
orsola, A., Masotti, G., et al. (2002). Left bundle-
branch block is associated with increased 1-year sud-
den and total mortality rate in 5517 outpatients with
congestive heart failure: a report from the italian net-
work on congestive heart failure. American heart jour-
nal, 143(3):398–405.
Balestrieri, E., Boldi, F., Colavita, A. R., De Vito, L.,
Laudato, G., Oliveto, R., Picariello, F., Rivaldi, S.,
Scalabrino, S., Torchitti, P., and Tudosa, I. (2019).
The architecture of an innovative smart t-shirt based
on the internet of medical things paradigm. In 2019
IEEE International Symposium on Medical Measure-
ments and Applications (MeMeA), pages 1–6.
Breiman, L., Friedman, J., Stone, C. J., and Olshen, R. A.
(1984). Classification and regression trees. CRC
press.
Chawla, N. V., Bowyer, K. W., Hall, L. O., and Kegelmeyer,
W. P. (2002). Smote: synthetic minority over-
sampling technique. Journal of artificial intelligence
research, 16:321–357.
Clark, A. L., Goode, K., and Cleland, J. G. (2008). The
prevalence and incidence of left bundle branch block
in ambulant patients with chronic heart failure. Euro-
pean journal of heart failure, 10(7):696–702.
Col, J. J. and Weinberg, S. L. (1972). The incidence
and mortality of intraventricular conduction defects in
acute myocardial infarction. The American journal of
cardiology, 29(3):344–350.
Cunningham, P. and Delany, S. J. (2020). k-nearest neigh-
bour classifiers–. arXiv preprint arXiv:2004.04523.
Dimitrov, D. V. (2016). Medical internet of things and big
data in healthcare. Healthcare informatics research,
22(3):156–163.
Elhaj, F. A., Salim, N., Harris, A. R., Swee, T. T., and
Ahmed, T. (2016). Arrhythmia recognition and classi-
fication using combined linear and nonlinear features
of ecg signals. Computer methods and programs in
biomedicine, 127:52–63.
Evans, A., Perez, I., Yu, G., and Kalra, L. (2000). Sec-
ondary stroke prevention in atrial fibrillation: lessons
from clinical practice. Stroke, 31(9):2106–2111.
Fahy, G. J., Pinski, S. L., Miller, D. P., McCabe, N., Pye,
C., Walsh, M. J., and Robinson, K. (1996). Natural
history of isolated bundle branch block. The American
journal of cardiology, 77(14):1185–1190.
Friedlander, B. and Porat, B. (1984). The modified yule-
walker method of arma spectral estimation. IEEE
Transactions on Aerospace and Electronic Systems,
(2):158–173.
Ghaemi, A., Rezaie-Balf, M., Adamowski, J., Kisi, O.,
and Quilty, J. (2019). On the applicability of max-
imum overlap discrete wavelet transform integrated
with mars and m5 model tree for monthly pan evap-
oration prediction. Agricultural and Forest Meteorol-
ogy, 278:107647.
HEALTHINF 2021 - 14th International Conference on Health Informatics
220

Goldberger, A. L., Amaral, L. A., Glass, L., Hausdorff,
J. M., Ivanov, P. C., Mark, R. G., Mietus, J. E., Moody,
G. B., Peng, C.-K., and Stanley, H. E. (2000). Phys-
iobank, physiotoolkit, and physionet: components of
a new research resource for complex physiologic sig-
nals. circulation, 101(23):e215–e220.
Haque, A., Ali, M. H., Kiber, M. A., Hasan, M. T., et al.
(2009). Detection of small variations of ecg features
using wavelet. ARPN Journal of Engineering and Ap-
plied Sciences, 4(6):27–30.
Hart, R. G. (2003). Atrial fibrillation and stroke prevention.
New England Journal of Medicine, 349(11):1015–
1016.
Hart, R. G., Halperin, J. L., Pearce, L. A., Anderson, D. C.,
Kronmal, R. A., McBride, R., Nasco, E., Sherman,
D. G., Talbert, R. L., and Marler, J. R. (2003). Lessons
from the stroke prevention in atrial fibrillation trials.
Hinton, G. E. (1990). Connectionist learning procedures. In
Machine learning, pages 555–610. Elsevier.
Ho, T. K. (1998). The random subspace method for con-
structing decision forests. IEEE transactions on pat-
tern analysis and machine intelligence, 20(8):832–
844.
Imanishi, R., Seto, S., Ichimaru, S., Nakashima, E., Yano,
K., and Akahoshi, M. (2006). Prognostic signifi-
cance of incident complete left bundle branch block
observed over a 40-year period. The American jour-
nal of cardiology, 98(5):644–648.
Ip, J. E. and Lerman, B. B. (2018). Idiopathic malignant
premature ventricular contractions. Trends in Cardio-
vascular Medicine, 28(4):295–302.
Jaffard, S., Lashermes, B., and Abry, P. (2006). Wavelet
leaders in multifractal analysis. In Wavelet analysis
and applications, pages 201–246. Springer.
Julian, D. G., Valentine, P. A., and Miller, G. G. (1964).
Disturbances of rate, rhythm and conduction in acute
myocardial infarction: a prospective study of 100 con-
secutive unselected patients with the aid of electro-
cardiographic monitoring. The American journal of
medicine, 37(6):915–927.
Jung, Y. and Kim, H. (2017). Detection of pvc by using
a wavelet-based statistical ecg monitoring procedure.
Biomedical Signal Processing and Control, 36:176–
182.
Kones, R. and Phillips, J. (1980). Bundle branch block in
acute myocardial infarction. current concepts and in-
dications. Acta cardiologica, 35(6):469–478.
Lashermes, B., Jaffard, S., and Abry, P. (2005). Wavelet
leader based multifractal analysis. In Proceed-
ings.(ICASSP’05). IEEE International Conference on
Acoustics, Speech, and Signal Processing, 2005., vol-
ume 4, pages iv–161. IEEE.
Leonarduzzi, R. F., Schlotthauer, G., and Torres, M. E.
(2010). Wavelet leader based multifractal analysis
of heart rate variability during myocardial ischaemia.
In 2010 Annual International Conference of the IEEE
Engineering in Medicine and Biology, pages 110–113.
IEEE.
Li, T. and Zhou, M. (2016). Ecg classification using
wavelet packet entropy and random forests. Entropy,
18(8):285.
Melgarejo-Moreno, A., Galcer
´
a-Tom
´
as, J., Garc
´
ıa-
Alberola, A., Vald
´
es-Chavarri, M., Castillo-Soria,
F. J., Mira-S
´
anchez, E., Gil-S
´
anchez, J., and Allegue-
Gallego, J. (1997). Incidence, clinical characteristics,
and prognostic significance of right bundle-branch
block in acute myocardial infarction: a study in the
thrombolytic era. Circulation, 96(4):1139–1144.
Moody, G. B. and Mark, R. G. (2001). The impact of the
mit-bih arrhythmia database. IEEE Engineering in
Medicine and Biology Magazine, 20(3):45–50.
Mullins, C. B. and Atkins, J. M. (1976). Prognoses and
management of venticular conduction blocks in acute
myocardial infarction. Modern Concepts of Cardio-
vascular Disease, 45(10):129–133.
Newby, K. H., Pisano, E., Krucoff, M. W., Green, C.,
and Natale, A. (1996). Incidence and clinical rele-
vance of the occurrence of bundle-branch block in pa-
tients treated with thrombolytic therapy. Circulation,
94(10):2424–2428.
Noble, W. S. (2006). What is a support vector machine?
Nature biotechnology, 24(12):1565–1567.
Pan, J. and Tompkins, W. J. (1985). A real-time qrs de-
tection algorithm. IEEE transactions on biomedical
engineering, (3):230–236.
Pandey, S. K. and Janghel, R. R. (2020). Automatic arrhyth-
mia recognition from electrocardiogram signals using
different feature methods with long short-term mem-
ory network model. Signal, Image and Video Process-
ing, pages 1–9.
Rizzon, P., Di Biase, M., and Baissus, C. (1974). Intraven-
tricular conduction defects in acute myocardial infarc-
tion. British Heart Journal, 36(7):660.
Shenkman, H. J., Pampati, V., Khandelwal, A. K., McK-
innon, J., Nori, D., Kaatz, S., Sandberg, K. R., and
McCullough, P. A. (2002). Congestive heart failure
and qrs duration: establishing prognosis study. Chest,
122(2):528–534.
Smisek, R., Viscor, I., Jurak, P., Halamek, J., and Plesinger,
F. (2018). Fully automatic detection of strict left
bundle branch block. Journal of Electrocardiology,
51(6):S31–S34.
Talbi, M. L. and Ravier, P. (2016). Detection of pvc in ecg
signals using fractional linear prediction. Biomedical
Signal Processing and Control, 23:42–51.
Tomek, I. (1976). Two modifications of cnn.
van Walraven, C., Hart, R. G., Singer, D. E., Koudstaal,
P. J., and Connolly, S. (2003). Oral anticoagulants
vs. aspirin for stroke prevention in patients with non-
valvular atrial fibrillation: the verdict is in. Cardiac
electrophysiology review, 7(4):374–378.
Wallmann, D., T
¨
uller, D., Kucher, N., Fuhrer, J., Arnold,
M., and Delacretaz, E. (2003). Frequent atrial prema-
ture contractions as a surrogate marker for paroxys-
mal atrial fibrillation in patients with acute ischaemic
stroke. Heart, 89(10):1247–1248.
Wallmann, D., T
¨
uller, D., Wustmann, K., Meier, P., Iseneg-
ger, J., Arnold, M., Mattle, H. P., and Delacr
´
etaz, E.
Automatic Real-time Beat-to-beat Detection of Arrhythmia Conditions
221

(2007). Frequent atrial premature beats predict parox-
ysmal atrial fibrillation in stroke patients: an opportu-
nity for a new diagnostic strategy. Stroke, 38(8):2292–
2294.
Xu, S. S., Mak, M.-W., and Cheung, C.-C. (2018). To-
wards end-to-end ecg classification with raw signal
extraction and deep neural networks. IEEE journal of
biomedical and health informatics, 23(4):1574–1584.
Zhao, Q. and Zhang, L. (2005). Ecg feature extraction
and classification using wavelet transform and support
vector machines. In 2005 International Conference on
Neural Networks and Brain, volume 2, pages 1089–
1092. IEEE.
HEALTHINF 2021 - 14th International Conference on Health Informatics
222
