
Virtual Screening of Pharmaceutical Compounds with hERG Inhibitory
Activity (Cardiotoxicity) using Ensemble Learning
Aditya Sarkar and Arnav Bhavsar
Indian Institute of Technology, Mandi, India
Keywords:
Ensemble Learning, Feature Selection, Virtual Screening, Cardiotoxicity, Pharmaceuticals.
Abstract:
In silico prediction of cardiotoxicity with high sensitivity and specificity for potential drug molecules can be
of immense value. Hence, building machine learning classification models, based on some features extracted
from the molecular structure of drugs, which are capable of efficiently predicting cardiotoxicity is critical. In
this paper, we consider the application of various machine learning approaches, and then propose an ensem-
ble classifier for the prediction of molecular activity on a Drug Discovery Hackathon (DDH) (1st reference)
dataset. We have used only 2-D descriptors of SMILE notations for our prediction. Our ensemble classifica-
tion uses 5 classifiers (2 Random Forest Classifiers, 2 Support Vector Machines and a Dense Neural Network)
and uses Max-Voting technique and Weighted-Average technique for final decision.
1 INTRODUCTION
It is well known that drug discovery is complex, long-
drawn, and requires interdisciplinary expertise to dis-
cover new molecules. Drug safety is an important
issue in the process of drug discovery. Failure in
Clinical trials in the 2000s was majorly due to effi-
cacy and safety (approx 30%) (Kola, I. and Landis,
J., 2004). One important aspect of drug safety is
drug toxicity. Frequently observed toxicities are car-
diotoxicity, hepatotoxicity, genotoxicity, and photo-
toxicity (Keiji Ogura, 2019). Toxicological screening
is very important for the development of new drugs
and for the extension of the therapeutic potential of
existing molecules. The US Food and Drug Adminis-
tration (FDA) states that it is essential to screen new
molecules for pharmacological activity and toxicity
potential in animals (21CFR Part 314). The toxic ef-
fects of chemicals, food substances, pharmaceuticals,
etc., have attained great significance in the 21st cen-
tury (Parasuraman, S, 2011).
The h-ERG (human Ether-
`
a-go-go-Related Gene)
is a gene that codes for a protein known as K
v
11.1,
the alpha subunit of a potassium ion channel (”hERG
safety”,2018). The h-ERG potassium channels (Sny-
ders, 1999) are essential for normal electrical activity
in the heart. When this channel’s conductivity of elec-
tric current is inhibited by some action of drugs, it can
lead to a fatal disorder called Long QT Syndrome.
It is found that many drugs have the h-ERG
inhibitory activity which can prolong the QT and
thereby resulting in irregularity of the heartbeat called
Torsades de Pointes (Keiji Ogura et al, 2019). As
a result, many drugs, that are inhibiting the h-ERG
channel’s conductivity, have been withdrawn from the
markets. Hence, it is regarded as a major anti-target
for drug discovery.
Over the years, many works have been done to
achieve the goal of classifying compounds having
h-ERG inhibitory activity. In early drug discovery
stages such as screening h-ERG inhibitory activity,
performing costly and time-consuming assays is diffi-
cult. Hence, developing an in-silico model to predict
hERG inhibition is very useful. (Keiji Ogura et al,
2019) Machine Learning techniques can be used for
classifying if any compound is having the inhibitory
activity or not. Machine Learning model can learn
features that can classify any compound on the basis
of h-ERG inhibition activity.
There have been some recent classification models
reported for h-ERG inhibition which have used Neu-
ral Networks (B. Mehlig, 2019), Random Forest Clas-
sifiers (RF) (Leo Breiman, 2001) and Support Vector
Machines (SVM) (Yongli Zhang et al, 2012). Below
we provide a brief review of these.
1.1 Related Work
Czodrowski (Czodrowski,,2013) constructed RF
models using descriptors calculated by Rdkit , based
152
Sarkar, A. and Bhavsar, A.
Virtual Screening of Pharmaceutical Compounds with hERG Inhibitory Activity (Cardiotoxicity) using Ensemble Learning.
DOI: 10.5220/0010267701520159
In Proceedings of the 14th International Joint Conference on Biomedical Engineering Systems and Technologies (BIOSTEC 2021) - Volume 2: BIOIMAGING, pages 152-159
ISBN: 978-989-758-490-9
Copyright
c
2021 by SCITEPRESS – Science and Technology Publications, Lda. All rights reserved

Table 1: Details of the various datasets.
Integrated Dataset
Database hERG inhibitors Inactive
compounds
ChEMBL (version 22) 4793 5275
GOSTAR 3260 3509
NCGC 232 1234
hERGCentral 4,321 274,536
hERG integrated dataset 9,890 281,329
on 3,721 compounds measured in a binding assay
and 765 compounds measured in a functional assay
collected from ChEMBL. The prediction models
were constructed separately from each data set, and
showed prediction accuracies of 79.7%–80.1% and
69.2%–90.7%, respectively.
Wang et al. (Wang, S. et al, 2012) developed
hERG classification models using naive Bayesian
classification and recursive partitioning based on
molecular properties and the ECFP 8 fngerprints, and
recorded 85% accuracy (Wang, S. et al, 2016).
Schyman et al. (Schyman. P, 2016) combined 3D
(David C. Kombo et al,2012) similarity conformation
and 2D similarity ensemble approach, and achieved
69% sensitivity and 95% specificity on an indepen-
dent external data set.
Recently, Keiji Ogura, Tomohiro Sato, Hitomi
Yuki and Teruki Honma (Keiji Ogura et al, 2019) used
Support Vector Machines (SVMs) on an integrated h-
ERG database having more than 291,000 structurally
diverse compounds. They achieved kappa statistics of
0.733 and accuracy of 98.4%. Table 1 provides a sum-
mary of various datasets used across existing works.
They have made the dataset publicly available for re-
search purposes.
1.2 Contributions of this Work
Most of the works (Wang, S. et al, 2012),(Wang,
S. et al, 2016),(Schyman. P, 2016),(Keiji Ogura et
al, 2019) which we have reviewed have either used
descriptors (2-D, 3-D and 4-D) or fingerprints. On
the other hand, unlike the above, we have used only
2-D descriptors for our classification model. 2D-
descriptors deal with the molecular topology of the
compounds i.e. topological indices and fragment
counts. 2D-Descriptors incorporate precious chemi-
cal information like size, degree of branching, flexi-
bility etc. Generating 2D descriptors of the SMILES
compounds usually takes less time than 3D descrip-
tors. Even with just 2D descriptors, we demonstrate
that the proposed ensemble model achieves a very
good performance.
In this study, we have developed an ensemble
model having two Random Forest Classifiers, two
Support Vector Machines and one Dense Neural Net-
work which achieved a AUC score (Area Under the
ROC Curve) of 0.96 and Cohen’s Kappa of 0.9195.
Most of the existing models have used Sup-
port Vector Machines, Random Forest Classifiers and
Naive Bayesian Classifiers for prediction. However,
in addition to these models, we have also used Deep
Neural Networks and two different Ensemble classi-
fiers for the task. We have found that the Deep Neural
Networks and the Ensemble classifier yield the high-
est performance.
We have also worked with data augmentation for
our class-imbalanced dataset. We have used SMOTE
(Synthetic Minority Oversampling Technique) (N. V.
Chawla, et al, 2011) for augmenting data. Data aug-
mentation is a very useful procedure because the data
that it generates is almost similar to the training data.
For some diseases, the drugs available can be quiet
less, and doing prediction with less data points can
lead to over-fitting. Data Augmentation can prove
useful by not only creating new data but may also
help in understanding the underlying distribution of
each property (descriptors or fingerprints) of drugs.
Unlike most existing works, we also sug-
gest an automatic approach based on information
gain/entropy to shortlist (or select) features from a
larger set. To our knowledge, the only exception
among the existing methods, which are considered
such a selection is work by (Keiji Ogura et al, 2019)
which involves the NSGA-II (Non-dominated Sorting
Genetic Algorithm-II) for descriptor selection.
Finally, towards the end of the paper, we pro-
vide a consolidated summary of the various works in
this domain, the datasets used, the feature descriptors
and methods employed, and their performance across
several metrics. We note that although this work is
not analysing imaging data, it involves core machine
learning on an important problem in biology. Con-
sidering that this is a relatively recent application do-
main, such an overview provides a good perspective
of the trade-offs of the approaches and paves the way
for more standardized benchmarking and extensions
in this area.
2 DATASET AND DESCRIPTORS
In this work, we have used a dataset provided
in one of the competitions of the Drug Discovery
Hackathon, organized by the Govt. of India; The
dataset has been made by Dr Kunal Roy, profes-
sor from Department of Pharmaceutical Technology,
Jadavpur University. http://sites.google.com/
Virtual Screening of Pharmaceutical Compounds with hERG Inhibitory Activity (Cardiotoxicity) using Ensemble Learning
153
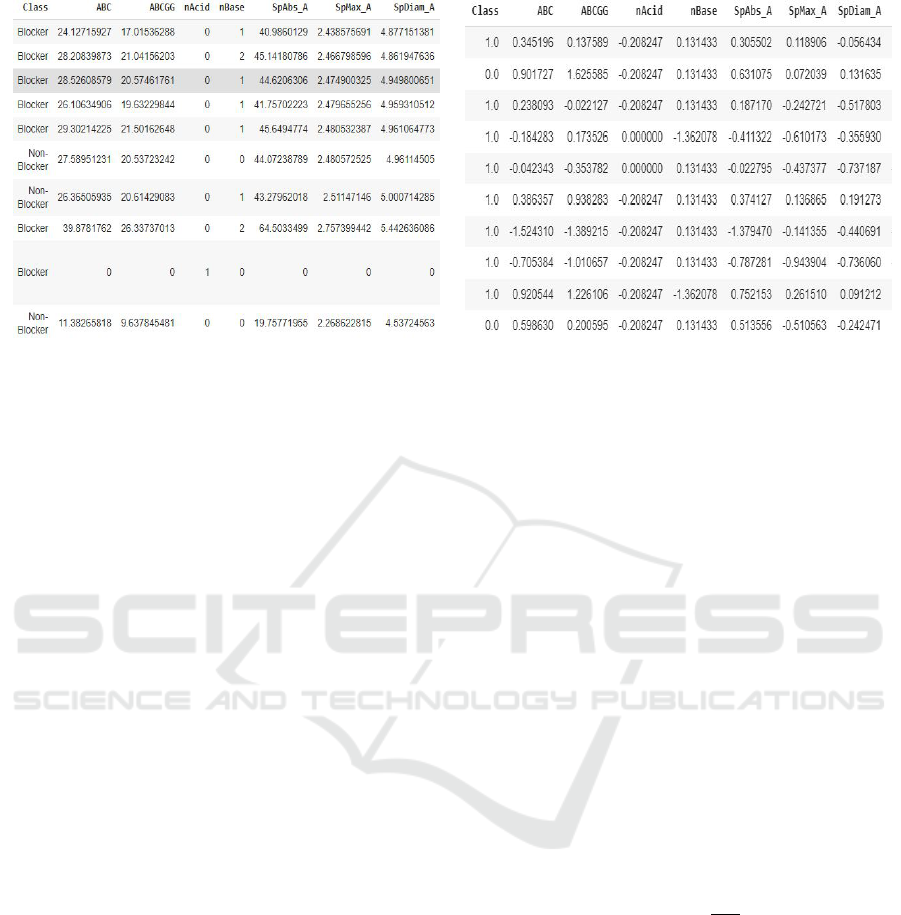
(a) Pandas view of Dataset (b) Pandas view of cleaned Dataset
Figure 1: Pandas Dataframe images.
site/kunalroyindia/home. It contains the SMILE
notations of 8227 pharmaceutical compounds, along
with their h-ERG inhibitory activity label (i.e. blocker
or non-blocker). Out of these, 6878 compounds were
blockers and 1349 were non-blockers.
We have used mordred (Moriwaki H, et al, 2018)
Python module to decrypt the SMILE (Anderson, E.
et al, 1987) notations to 2-D descriptors. As a result,
we got 1613 features for each compound. Figure 1(a)
shows a snippet of the Pandas view of the dataset.
It shows the IDs of the pharmaceutical compounds,
the class to which it belongs i.e. Blocker or Non-
Blocker (Blocker means that the compound possesses
the h-ERG inhibitory activity and Non-Blocker
means that it does not possess the h-ERG inhibitory
activity) and few 2D descriptors. The list of de-
scriptors along with their descriptions can be found
at mordred documentation link: https://mordred-
descriptor.github.io/documentation/master/ descrip-
tors.html. Initially, we have extracted all the 2-D
descriptors that mordred has offered. In section III-C,
we have described a method for further selecting
features out of these.
3 METHOD
We have first worked on data cleaning, then aug-
mented our data because it was having an imbal-
anced class problem, selected important features us-
ing an Entropy/Information Gain based method, and
finally performed the classification using two ensem-
bles - Max-Voting Ensemble and Weighted-Average
Ensemble using two variants of Random Forest Clas-
sifiers, two variants of Support Vector Machines and
one Deep Neural Network. We have divided this
section into 5 subsections - Data Cleaning, SMOTE
Application, Feature Selection and Base Models and
Ensemble-Learning.
3.1 Data Cleaning
Data Cleaning is important part of analysing this data.
This is done so as to eliminate outliers present in the
data. These outliers are due to miscalculations made
by the mordred python module. Since the range each
column is different, so to normalize them, Z-score/
Standard Score is used.
Z-score or standard score of a particular column
is defined as the number of standard deviations by
which the value of a datapoint value is above or be-
low the mean value of datapoints present in the col-
umn. Raw scores above the mean have positive Z-
scores, while those below the mean have negative
Z-scores (Spiegel, Murray R.; Stephens, Larry J ,
2008),. Mathematically, it is defined as -
Z-Score =
X−µ
σ
.
where x is the sample datapoint, µ is mean of all the
datapoints in the sample column and σ is standard de-
viation in the sample column.
We have used Z-scores for finding the out-
liers and finally replaced the outliers with the
mean of column of the Dataframe, to which it
belongs. The Dataframe is two-dimensional,
size-mutable, potentially heterogeneous tab-
ular data (https://pandas.pydata.org/pandas-
docs/stable/reference/api/pandas.DataFrame.html).
This can be interpreted as removing the outlier
samples, and augmenting the rest of the samples,
with a mean estimate.
We have considered a datapoint, an outlier when
BIOIMAGING 2021 - 8th International Conference on Bioimaging
154

|
Z − Score(datapoint)
|
>3
(PeruriVenkataAnusha et. al.). A section of the
dataset view obtained after cleaning is shown in Fig-
ure 1(b). It shows the class to which the pharmaceuti-
cal compound belongs to i.e. Blocker or Non-Blocker
and few 2D descriptors. However, unlike Figure 1(a),
this contains Z-score. Also, we have removed those
features which were containing NaN values. Hence,
our number of features decreased from 1613 to 1375.
3.2 SMOTE for Data Augmentation
As mentioned earlier, our dataset has 6878 Blocker
compounds and 1349 non-Blocker compounds.
Hence, it is imbalanced and can lead to high bias.
To tackle this problem, we made use of the pop-
ular data augmentation method SMOTE (Synthetic
Minority Oversampling Technique). SMOTE (N. V.
Chawla, 2011) can be used to create synthetic exam-
ples for the minority class. It works by first choosing
a random example from the minority class Then k of
the nearest neighbors for that example are found. A
randomly selected neighbor is interpolated between
the two examples in feature space. We chose SMOTE
considering its popularity, with which we were also
getting an improvement in our results. However, one
can also consider other data augmentation methods.
We have used Imblearn Python Module (Guillaume
Lema
ˆ
ıtre et al, 2017) for applying SMOTE. After
SMOTE, we achieved a total size of 13756 datapoints,
including 6878 Blocker compounds and 6878 Non-
Blocker compounds.
3.3 Feature Selection
Feature selection is an important part of the model.
Considering we have numerous 2-D features, it is im-
portant to consider the ones which can contribute for
the task of the classification.
Gini-index and Entropy are used as criterion for
calculating information gain. Decision tree algo-
rithms use information gain to split a node. Entropy
and gini are used for measuring impurity of a node.
Node having multiple classes is considered impure
and node having single class is considered pure. In
this project, we have used Entropy as our impurity
measure. While training a tree, we can compute how
much each feature decreases the impurity. The more
a feature decreases the impurity, the more important
that feature is. In random forests, the impurity de-
crease from each feature can be averaged across trees
to determine the final importance of the variable. For
this we have used the features selected by Random
Forests with measure of impurity as Entropy. Initially,
we started with 1375 features for each compound. Af-
ter applying feature selection, we had 592 features,
which is a significant reduction.
3.4 Base Models and Ensemble
Learning
We have used 5 base models in our ensemble - 2 Ran-
dom Forest Classifiers, 2 Support Vector Machines
and 1 Dense Neural Network. These well known
methods are discussed briefly in the following subsec-
tions, and the corresponding parameters are provided
in Table 2. We have used Scikit-Learn Python mod-
ule for Random Forest Classifiers and Support Vec-
tor Machines. For implementing Dense Neural Net-
works, we have used Tensorflow 2 and Keras.
3.4.1 Random Forest Classifiers
The random forest classifier is essentially a ensemble
of decision tree-based classifiers. It operates by con-
structing a number of decision trees during its train-
ing and outputs a class decision that is the mode of the
classes estimates of each decision tree. It is based on
the principle of bagging to mitigate the bias-variance
trade-off in decision tree-based classifiers.
3.4.2 Support Vector Machines
SVM is a popular maximum-margin classification
framework boasting advantages of good generaliza-
tion and non-linear classification via the use of kernel
functions. Support Vector machines find a maximum-
margin-hyperplane that divides the data points of the
classes such that the distance between the hyperplane
and the nearest point of either class to this hyperplane
is maximised.
3.4.3 Dense Neural Networks
Dense Neural Networks have gained popularity as
contemporary classifiers due to their ability to learn
highly non-linear classification models, given enough
data. A neural network is a network of neurons that
can well approximates a highly nonlinear boundary
between the classes, given enough data.
3.4.4 Ensemble Learning
For our Ensemble, we have used Max-Voting and
Weighted-Average with our 5 base models described
above. In max-voting, each base model makes a pre-
diction and votes for each sample. Only the sam-
ple class with the highest votes is included in the fi-
nal predictive class. In weighted-average, we have
Virtual Screening of Pharmaceutical Compounds with hERG Inhibitory Activity (Cardiotoxicity) using Ensemble Learning
155
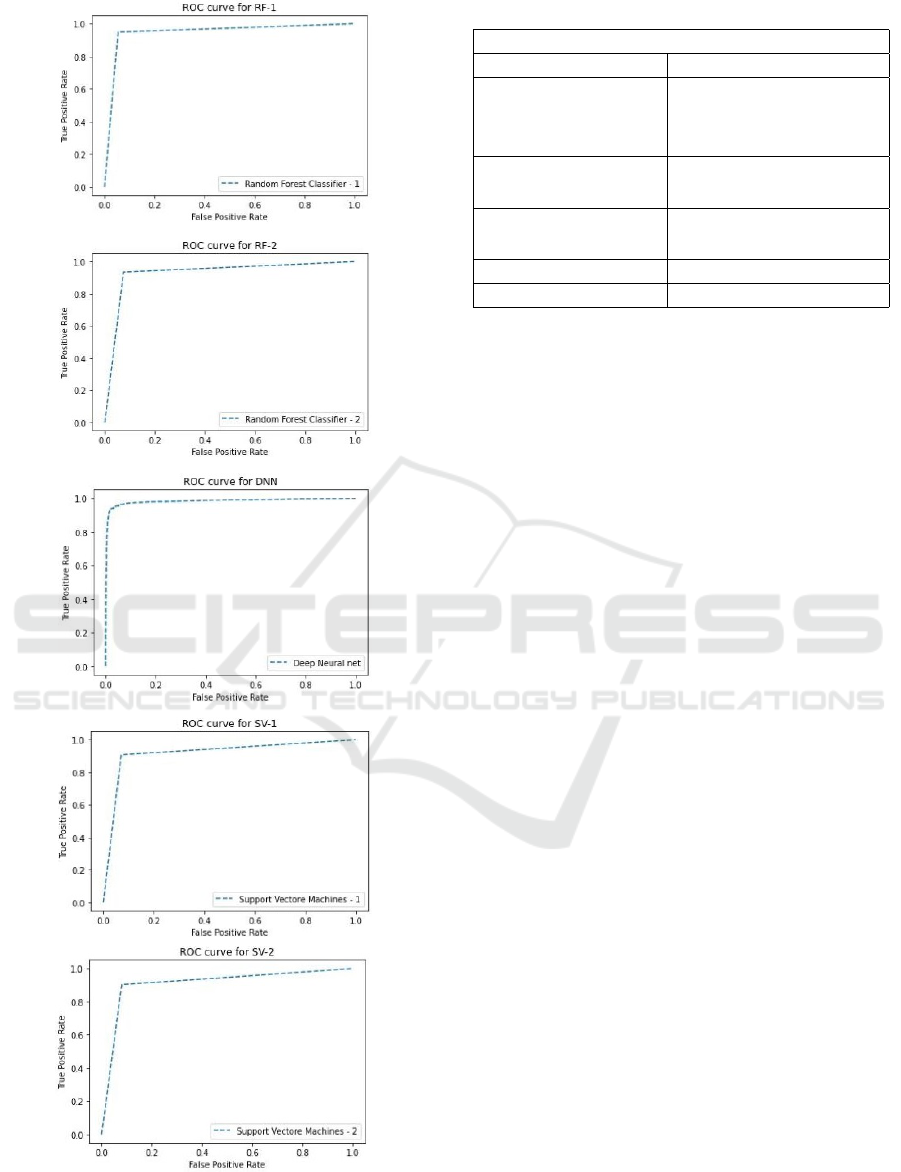
Figure 2: ROC curves for all models.
Table 2: Accuracy of various classification models.
Base Model Accuracies and ROC-AUC
Models Features
Dense Neural Networks 4 dense layers : 3 with L1 param 10
−5
,
L2 param 10
−4
, dropout of 0.5,0.3, 0.3
resp. 1 with L1 param 10
−4
, L2 param
10
−4
, Optimiser: ADAM, Activation
func: Sigmoid.
Random Forest Classifier-1 89 trees, min no. of samples at leaf node
: 2 and to split an internal node : 4, feat.
selection criteria : Entropy-Based.
Random Forest Classifier-2 70 trees, min no. of samples at leaf node
: 10 and to split an internal node : 5, feat.
selection criteria : Gini-Based.
Support Vector Machines-1 regularization parameter : 1
Support Vector Machines-2 regularization parameter : 0.8
placed weights on predictions of each of the base
model for the final prediction. The weights we have
placed is 0.75 for DNN, 0.1 for RF-1, 0.07 for RF-
2, 0.05 for SV-1 and 0.03 for SV-2. We have given
more weights to that classifiers among the base mod-
els, which yields a higher accuracy. Since, our Neu-
ral network is showing maximum accuracy, we have
placed maximum weightage to it.
4 EXPERIMENTS AND
OUTCOMES
For our experiments, we have divided our dataset in
the training-testing ratio of 70% and 30%.As a result,
our training set contains 9629 datapoints and testing
set has 4127 datapoints. The training data is split into
training and validation sets, automatically by the in-
built models in the packages that we employ. We use
testing data only for prediction.
We have tested the performance of the base classi-
fiers as well as the ensemble classifiers using several
metrics, in addition to the overall accuracy. These are
defined below:
4.1 Description of Metrics
The metrics we have used for classifying our final
classification models are descrbed below:
4.1.1 AUC-ROC Score
AUC-ROC score computes Area Under the Receiver
Operating Characteristic Curve (ROC) from predic-
tion scores. The ROC curve is shown in Figure 3. We
note from all ROC curves that a high True Positive is
achieved at fairly low value of False positives.
BIOIMAGING 2021 - 8th International Conference on Bioimaging
156

4.1.2 Sensitivity, Precision and Specificity
Abbreviating TN for True Negative, TP for True Pos-
itive, FN for False Negative and FP for False Positive,
the other metrics are defined as
Sensitivity =
T P
T P+F N
, Specificity =
T N
T N+FP
.
Bal. Acc. =
Sensitivity+Speci ficity
2
, Precision =
T P
T P+F P
.
4.1.3 Cohens-Kappa (κ)
We have also used Cohens-Kappa (κ) (J. Cohen,
1960), which determines the level of agreement be-
tween two annotators in a classification problem.
κ =
p
0
−p
e
1−p
e
where p
0
is defined as empirical probability of agree-
ment on the label assigned to any sample and p
e
is
defined as expected agreement when both annotators
assign labels randomly.
4.1.4 Matthews Correlation Coefficient (MCC)
Matthews correlation coefficient (MCC) (Matthews,
B. W., 1975) is generally regarded as a balanced mea-
sure which can be used in case of data imbalance be-
tween classes.
4.2 Results
The accuracy and the ROC-AUC values of the the
base models as well as the ensemble models are pro-
vided in Table 3. We note that among the base clas-
sifiers, the neural network model performs the best.
The accuracy of the ensemble model with average
weighting is similar to the DNN model. It is likely
that the ensemble learning method with max voting is
performing relatively lower, because of the some low
performing base classifiers.
In Table 4, we provide the results of the top two
performing classifiers from Table 3., for the other
metrics that were defined above. We note that for
both the approaches yield high quality classification
across all the metrics, and their performance is close
to each other. While for this dataset, the DNN model
performs somewhat better than the ensemble learn-
ing approach, it is important to acknowledge the high
performance of the ensemble learning, as for larger
datasets, it is known that the ensemble strategies can
typically better mitigate the bias-variance tradeoff.
4.3 A Review of the Results for Existing
Methods
In Table 5, we provide a overall summary of the var-
ious existing methods for the task of classification of
Table 3: Accuracy of various classification models.
Base Model Accuracies and ROC-AUC
Models Accuracies AUC
Dense Neural Networks 95.98% 0.994
Random Forest Classifier-1 94.3% 0.944
Random Forest Classifier-2 93.51% 0.932
Support Vector Machines-1 90.87% 0.914
Ensemble learning (Max voting) 93.96% 0.94
Ensemble learning (Avg. weighting) 95.97% 0.96
Table 4: Metrics for Ensembles.
Metrics for different Ensembles
Metrics Weighted-Average DNN
AUC 0.960 0.994
Sensitivity 0.9436 0.975
Specificity 0.9755 0.983
Balanced Accuracy 0.9596 0.979
MCC 0.9199 0.956
Cohen’s kappa 0.9195 0.956
F1-score 0.96 0.98
Precision 0.96 0.975
Recall 0.96 0.975
pharmaceutical compounds based on their hERG in-
hibition activity. We note that while there have been
a few (but not many) methods to address this task,
these involve different datasets, and different features.
Thus, while such a summary is not a comparison, it
does provide, under one roof, a perspective on data,
methods, and can help in identifying scope of im-
provements in this area.
In the table, some cells are blank as not all met-
rics are provided for all methods. We note that the
methods do not yield a high performance across all
the metrics. Some methods employ relatively small
data. The work by Ogura et al, involves the largest
data, but yields a low sensitivity and kappa coeffi-
cient. Such discrepancy suggests an issue with the
data imbalance. Importantly, most of the approaches
use various different features in their methodology.
In contrast our approach uses only 2D features, and
yields a high performance across all metrics. A lim-
itation of this work is that it also involves relatively
less data, which we plan to address in future.
5 CONCLUSIONS AND FUTURE
WORK
In this work we have compared various standard ma-
chine learning methods for the task of pharmaceutical
compound classification based on their hERG inhibi-
Virtual Screening of Pharmaceutical Compounds with hERG Inhibitory Activity (Cardiotoxicity) using Ensemble Learning
157

Table 5: A summary of the various approaches and their performance.
Reference Database Data size Classifiers Features AUC Sensiti-
vity
Specifi-
city
Cohen’s
Kappa
Acc.
Our Model DDH 8227 SVM, RF,
DNN
2D descr- iptors 0.994 0.9436 0.9755 0.9195 0.959
Czodrowski P,
2013
ChemBL 11958 RF RDKIT descrip-
tors
0.564 0.029-
0.243
- - 0.907
Wang S et al, 2016 - 587 Na
¨
ıve
Bayes,
SVM
Pharmaco- phore
hypothesis
0.899 0.943 0.596 - 0.782-
0.836
Ogura et al, 2019 hERG-Integrated Dataset 291219 SVM 2D 3D descrip-
tors, ECFP-4
structural
fingerprints,
Pipeline Pilot
descriptors
0.966 0.715 0.933 0.733 0.98
Schyman P., 2016 National Cancer Insti.
Database
25000 - Accelrys
extended
connectivity
fingerprints,
conformations
- 0.69 0.95 - 0.79
Doddareddy et al Dubus203, Literature368,
Thai313 datasets
7360 LDA, SVM Extended
connectivity
fingerprints,
functional class
fingerprints
0.94 - - - 0.91
Kwang-Eun et al Pipeline Pilot
(PP),FCFP 2, FCFP 4 and
FCFP 6, R package
5252 DNN, NB,
SVM, RF,
Bagging
integer and bi-
nary type finger-
prints
0.95 0.626 0.986 - -
Chuipu Cai et al ChEMBL, hERG K+ chan-
nel binding affinity, radi-
oligand binding measure-
ments on mammalian and
non- mammalian cell lines,
literature-derived data
7889 DNN,
GCNN
Molecular
Operating
Environment
descriptors,
Mol2vec
descriptors
0.97 0.912 0.817 - 0.93
tion activity. Some of the important aspects that we
have considered is the used of only 2D features, data
augmentation, feature selection, and ensemble learn-
ing. The accuracies we have achieved with our model
is quite high for a small dataset.
The work encourages us to further explore more
ensemble strategies considering DNN features, stack-
ing, bagging etc.
REFERENCES
Anderson, E., G.D. Veith, and D. Weininger. 1987.
SMILES: A line notation and computerized in-
terpreter for chemical structures. Report No.
EPA/600/M-87/021. U.S. Environmental Protection
Agency, Environmental Research Laboratory-Duluth,
Duluth, MN 55804
B. Mehlig, 2019, Artificial Neural Networks. arxiv -
1901.05639
Chuipu Cai, Pengfei Guo, Yadi Zhou, Jingwei Zhou, Qi
Wang, Fengxue Zhang, Jiansong Fang, and Feixiong
Cheng, 2015. Deep Learning-based Prediction of
Drug-induced Cardiotoxicity. J Chem Inf Model. 2019
Mar 25; 59(3): 1073–1084.
Czodrowski, P., 2013 HERG Me Out. J. Chem. Inf.
Model.53, 2240–2251 (2013).
David C. Kombo, Kartik Tallapragada, Rachit Jain, Joseph
Chewning, Anatoly A. Mazurov, Jason D. Speake,
Terry A. Hauser, and Steve Toler,2012. 3D Molecular
Descriptors Important for Clinical Success. J. Chem.
Inf. Model. 2013, 53, 2, 327–342
Drug Discovery Hackathon, https://innovateindia.mygov.
in/drug-ps/track-2-general-drug-discovery-including-
covid/ddt2-13/
Doddareddy MR; Klaasse EC; Ijzerman AP; 2010. Ben-
der A Prospective Validation of a Comprehensive in
Silico hERG Model and its Applications to Commer-
cial Compound and Drug Databases. Chemmedchem
2010, 5, 716–729 [PubMed: 20349498].
Guillaume Lema
ˆ
ıtre and Fernando Nogueira and Christos
K. Aridas,2017. Imbalanced-learn: A Python Tool-
box to Tackle the Curse of Imbalanced Datasets in
Machine Learning Journal of Machine Learning Re-
search.
”hERG safety”. Cyprotex, 9 October 2018. https://www.cy
protex.com/toxicology/cardiotoxicity/hergsafety
J. Cohen (1960). “A coefficient of agreement for nominal
scales”. Educational and Psychological Measurement
20(1):37-46.
Kola, I. & Landis, J.,2004. Can the Pharmaceutical Industry
Reduce Attrition Rates? Nat. Rev. Drug Discov. 3,
711–715 (2004)
Laura E. Raileanu, Kilian Stoffel, 2004. Theoretical Com-
parison between the Gini Index and Information Gain
Criteria. Annals of Mathematics and Artificial Intelli-
gence 41, 77–93 (2004)
Leo Breiman, 2001. Random Forests, Statistics Depart-
ment, University of California, Berkeley, CA 94720.
Springer
BIOIMAGING 2021 - 8th International Conference on Bioimaging
158

Marchese Robinson, R. L.; Glen, R. C.; Mitchell, J. B.,
2011. Development and comparison of hERG blocker
classifiers: Assessment on different datasets yields
markedly different results. Mol. Inform. 2011, 30,
443–458.
Matthews, B. W. (1975). Comparison of the predicted and
observed secondary structure of T4 phage lysozyme.
Biochimica et Biophysica Acta (BBA) - Protein Struc-
ture. 405 (2): 442–451.
Moriwaki H, Tian Y-S, Kawashita N, Takagi T (2018). Mor-
dred: a molecular descriptor calculator. Journal of
Cheminformatics 10:4.
N. V. Chawla, K. W. Bowyer, L. O. Hall, W. P. Kegelmeyer.,
2011. SMOTE: Synthetic Minority Over-sampling
Technique. arxiv - 1106.1813
Ogura, K., Sato, T., Yuki, H. et al.,2019. Support Vector
Machine model for hERG inhibitory activities based
on the integrated hERG database using descriptor se-
lection by NSGA-II. Sci Rep 9, 12220 (2019).
Parasuraman, S.,2011. Toxicological screening.” Journal
of pharmacology & pharmacotherapeutics vol. 2,2
(2011): 74-9.
Peruri Venkata Anusha et. al., 2019. Detecting Outliers in
High Dimensional Data Sets Using Z-Score Method-
ology. Int. Journal of Innovative Tech. and Exploring
Engg.
RDKit. Open-source Chemiformatics http://www.rdkit.org.
Schyman, P., Liu, R. & Wallqvist, A.,2016. General
Purpose 2D and 3D Similarity Approach to Identify
hERG Blockers. J. Chem. Inf. Model. 56, 213–222
(2016)
Spiegel, Murray R.; Stephens, Larry J. (2008). Schaum’s
Outlines Statistics (Fourth ed.), McGraw Hill.
Dirk J. Snyders, 1999. Structure and Function of Cardiac
Potassium Channels. Cardiovasc. Res 42, 377–390
(1999)
Wang, S. et al., 2012, ADMET Evaluation in Drug Discov-
ery.12. Development of Binary Classifcation Models
forPrediction of hERG Potassium Channel Blockage.
Mol.Pharmaceutics 9, 996–1010 (2012).
Wang, S. et al.,2016. ADMET Evaluation in Drug Dis-
covery. 16. Predicting hERG Blockers by Combining
Multiple Pharmacophores and Machine Learning Ap-
proaches. Mol. Pharmaceutics 13, 2855–2866 (2016).
Yoon, Hye & Balupuri, Anand & Choi, Kwang-Eun &
Kang, Nam (2020). Small Molecule Inhibitors of
DYRK1A Identified by Computational and Experi-
mental Approaches. International journal of molec-
ular sciences. 21. 10.3390/ijms21186826.
Yongli Zhang, 2012. Qinggong College, Hebei United
University, Tangshan, China. Support Vector Ma-
chine Classification Algorithm and Its Applica-
tion.Information Computing and Applications. ICICA
2012. Communications in Computer and Information
Science, vol 308. Springer, Berlin, Heidelberg.
Virtual Screening of Pharmaceutical Compounds with hERG Inhibitory Activity (Cardiotoxicity) using Ensemble Learning
159
