
Estimation of Affective State based on Keystroke and Typing Vibration
during Computer-Mediated Communication
Kei Hasegawa, Hikaru Miyamoto, Yuki Ashida, Yuki Ban, Rui Fukui,
Masahiro Inazawa and Shin’ichi Warisawa
Development of Human and Engineered Environmental Studies, The Graduate School of Frontier Sciences,
The University of Tokyo, Kashiwa, Chiba, Japan
ban@edu.k.u-tokyo.ac.jp, fukui@edu.k.u-tokyo.ac.jp, inazawamasahiro@lelab.t.u-tokyo.ac.jp,
warisawa@edu.k.u-tokyo.ac.jp
Keywords:
Affective Computing, Computer-Mediated Communication, Keyboard, Support Vector Machine.
Abstract:
In recent years, the use of computer-mediated communication (CMC), that is, communication among people
through computers, has increased. Knowing the message sender’s affective state is essential for understand-
ing the contents of the message correctly. However, it is difficult to interpret this state because of the non-
availability of nonverbal information from the sender during CMC. Although attempts have been performed
to estimate affective state, there is a challenge of high measurement load. In this paper, we propose an esti-
mation of valence and arousal using keyboard input and typing vibration information as a method to estimate
the sender’s affective state with a low measurement load during CMC. We conducted experiments to obtain
keyboard input and typing vibration information for estimating valence and arousal. This estimation was per-
formed by extracting features from the information using a support vector machine, and cross-validation was
conducted to verify our method. Therefore, the valence and arousal were estimated at accuracies of 69.8% and
71.1%, respectively, for unlearned participants’ data.
1 INTRODUCTION
With the widespread use of the internet, computer-
mediated communication (CMC) has become one of
the most popular modes of communication. Several
companies have introduced business chat tools along
with the popularization of CMC. Knowing another
person’s affective state plays a significant role in inter-
preting the message being conveyed correctly (Kruger
et al., 2005). Therefore, for effective CMC, it is es-
sential to understand the valence and arousal levels
of the communicators. However, unlike in the case
of face-to-face conversation, nonverbal information,
such as tone, facial expression, and gestures, which
aid in understanding the affective state, is unavailable
during CMC.
Study on the estimation of the affective state us-
ing biometric information has been published in re-
cent years. Valence and arousal have been estimated
by constantly measuring the galvanic skin response
(GSR) or heart rate (HR) while using CMC (Wang
et al., 2004; Wu et al., 2010). However, the challenge
with measuring biometric information is that elec-
trode pads need to be attached directly to the body,
which is not very practical. In recent studies, it has
been reported that variations in keyboard operation
depend on the affective state. Therefore, in this study,
we decided to obtain information on keyboard oper-
ation to estimate valence and arousal during CMC,
which implies a low measurement load. In addition,
because computer keyboards are routinely used in the
workplace, obtaining information from the keyboard
is advantageous in that this process does not interfere
with the operator’s current task.
Whereas a high correlation has been suggested be-
tween valence and keyboard input information, a low
correlation has been reported between arousal and
keyboard input information (Salmeron-Majadas et al.,
2014). Some studies have tried to improve the accu-
racy of arousal estimation using information on the
typing force used (Lv et al., 2008). To this end, they
utilized a keyboard having an embedded pressure sen-
sor to measure typing pressure with respect to typing
force information. However, this method requires a
unique keyboard, which is limited in terms of avail-
ability.
Hasegawa, K., Miyamoto, H., Ashida, Y., Ban, Y., Fukui, R., Inazawa, M. and Warisawa, S.
Estimation of Affective State based on Keystroke and Typing Vibration during Computer-Mediated Communication.
DOI: 10.5220/0010267502350242
In Proceedings of the 14th International Joint Conference on Biomedical Engineering Systems and Technologies (BIOSTEC 2021) - Volume 4: BIOSIGNALS, pages 235-242
ISBN: 978-989-758-490-9
Copyright
c
2021 by SCITEPRESS – Science and Technology Publications, Lda. All rights reserved
235

Considering all these factors, we focused on vi-
bration as a feature of typing. The keyboard vibrates
slightly owing to typing, and this vibration varies de-
pending on the typing force. We considered the fact
that the typing force affects the amplitude of the vi-
bration wave.
On the basis of the preceding discussion, we pro-
pose a method to estimate valence and arousal us-
ing keyboard input and typing vibration information.
To measure the typing vibration information, we em-
ployed a device that can measure acceleration simply
through connection via a USB port on a computer. In
this study, we estimated valence and arousal using the
data obtained through this device. The contributions
of our study are as follows:
• We propose a method for the estimation of va-
lence and arousal using keyboard input and typing
vibration information.
• We demonstrate that valence and arousal can be
estimated with an accuracy of 69.8% and 71.1%,
respectively.
• We determine the essential features required for
the estimation of valence and arousal.
2 RELATED WORKS
So far, studies investigating the affective state during
CMC have broadly utilized either biometric or key-
board input information.
2.1 Biometric Information
Measurement
Wang et al. measured the GSR continually during
CMC to estimate the valence and arousal (Wang et al.,
2004). Electrodes were attached to the participants’
middle and index fingers for the GSR measurement.
Hassib et al. and Wu et al. measured the HR, which
reflects sympathetic nerve activity, constantly and es-
timated the affective state (Wu et al., 2010; Hassib
et al., 2017). In that study, a chest-strap-type elec-
trocardiographic monitor was attached to the partici-
pants’ bodies to measure the HR. Lin et al. classified
four emotions (joy, anger, sadness, and pleasure) de-
termined using participants’ electroencephalographs
(ECCs) (Lin et al., 2010). Bos attempted to estimate
valence and arousal from ECCs (Bos et al., 2006). In
their study, a device, in which embedded electrodes
were used to cover the head, were used to monitor
the ECCs. However, we considered the fact that these
studies encountered the challenge of high measure-
ment load because of the need for the sensor to be
worn all the time.
2.2 Keyboard Information
Measurement
As a method using low measurement load, estimation
of the affective state using keyboard information has
been explored in many studies.
Serigo et al. tried to estimate valence and arousal
using keystroke information, digraphs, trigraphs,
and computer mouse motion information (Salmeron-
Majadas et al., 2014). Both keystroke and computer
mouse motion information had a high correlation with
valence and a slightly low correlation with arousal.
Khan et al. estimated participants’ valence and
arousal using the average time interval between typ-
ing events, number of times windows were switched,
number of typing events, and computer mouse motion
information (Khan et al., 2013). Bixler et al. deter-
mined the total time taken to type a sentence, num-
ber of typing events, typing redundancy (calculated
by tracking the Backspace key events), and the time
interval between typing events (Bixler and D’Mello,
2013) to recognize the participants’ consciousness
(bored, focused, or neutral). Khanna et al. and Felipe
et al. estimated the participants’ affective states using
the following features: four statistics (mode, standard
deviation, variance, and range) of typing speed and
number of typing events, time interval between typing
events, and number of Backspace key events (Khanna
and Sasikumar, 2010; Felipe et al., 2012).
A keyboard that could measure typing pressure
(hereinafter, referred to as the pressure-sensitive key-
board) to estimate the affective state was also pro-
posed. Hernandez et al. monitored typing pressure
and computer mouse events using a pressure-sensitive
keyboard and capacitive computer mouse (Hernandez
et al., 2014). The work suggested that the typing
pressure and computer mouse click pressure can be
used to determine whether an operator is typing under
high or low stress. Hai et al. estimated six emotions
(neutral, anger, fear, happiness, sadness, and surprise)
based on typing pressure distribution captured using
a pressure-sensitive keyboard (Lv et al., 2008). How-
ever, the keyboard is a unique keyboard that aids pres-
sure measurement, and there are restrictions regarding
the environment in which it can be used.
Therefore, a method that entails low measurement
load is required to estimate valence and arousal such
that the current task at hand is not disturbed.
BIOSIGNALS 2021 - 14th International Conference on Bio-inspired Systems and Signal Processing
236
3 ACCELERATION-
MEASUREMENT
DEVICE
As mentioned earlier, we utilized typing vibration in-
formation as one of the inputs for estimating valence
and arousal. To this end, we designed a device con-
taining an acceleration sensor (hereinafter, referred
to as the acceleration-measurement device) to easily
measure the typing vibration information (Figure 1).
The vibration generated by typing propagates to the
computer, which can be measured by connecting the
acceleration-measurement device to the USB port on
the computer. This device consists of an Arduino Mi-
cro (Arduino A000053) and an acceleration sensor
(Kionix Inc. KXR94-2050) and connector (Figure 1),
and the acceleration values generated by the typing
vibration as well as timestamps are obtained from the
device at a sampling rate of 1800 Hz. The data are
sent from the device to the computer through serial
communication at a communication baud rate of 9600
bps.
Arduino Micro
Accelerometer
USB A (Male) - Micro USB (Male)
Converter Adapter
USB Port of PC
Universal Board
56
48
10
30
7
13
Figure 1: Acceleration-measurement device.
4 FEATURE EXTRACTION
We propose to extract the relevant features from key-
board input and typing vibration information and con-
struct a classifier using a support vector machine
(SVM), which employs features as input and outputs
valence and arousal. Table 1 lists the features con-
sidered in this study. The message composition ef-
ficiency and keystroke features were extracted as the
features of keyboard input information. In this study,
keystroke features include the time interval between
typing events and the typing frequency. The ampli-
tude and frequency of vibration were extracted from
the vibration information.
4.1 Keyboard Input Information
Messages are edited before being sent to another per-
son. We considered this process of editing to repre-
sent the affective state. Therefore, we focused on the
ratio of the number of words in a message to the num-
ber of typing press events required for composing the
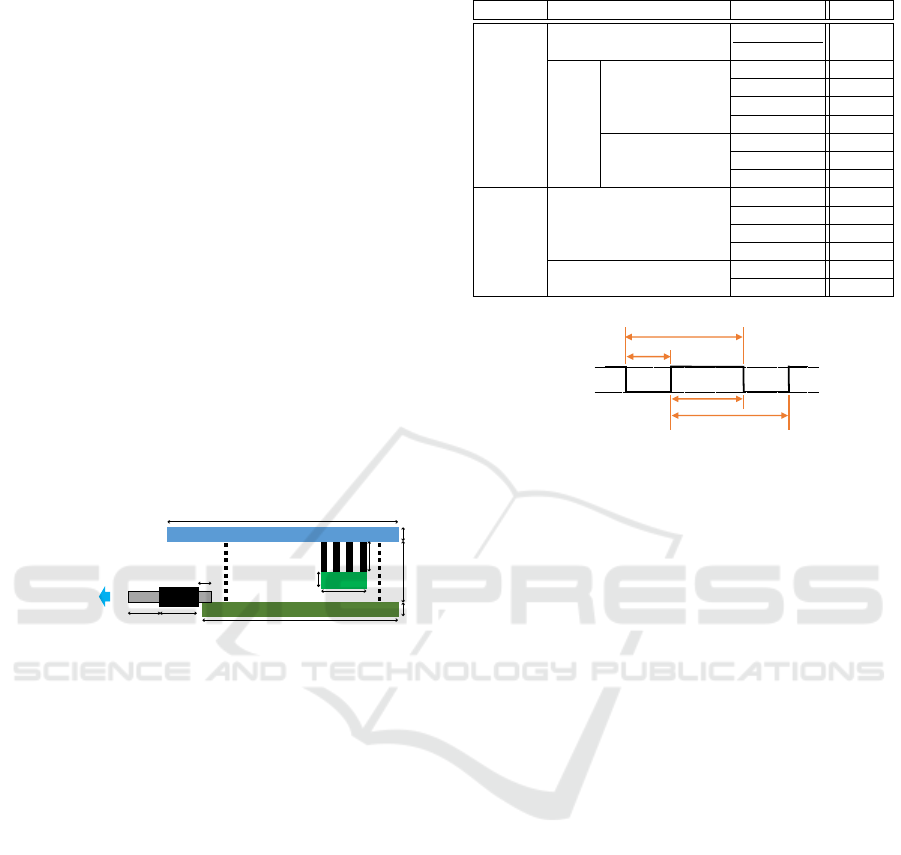
Table 1: Features considered in this study.
type feature note quantity
keyboard message composition efficiency
number o f words
number o f press events
1
input
information keystroke time interval between press to press 10
typing events press to release 10
release to press 10
release to release 10
typing frequency Backspace 1
Enter 1
Space 1
typing typing amplitude character (A to Z) 10
vibration Backspace 10
information Enter 10
Space 10
vibration frequency first 10
second 10
release to release
release to press
press to press
press to release
Press
Release
Figure 2: Time interval between typing events.
message (hereinafter, referred to as message compo-
sition efficiency) as the feature of message editing.
When CMC is used, a typing event, i.e., “press” or
“release” of a key, occurs. The time interval between
typing events is used to describe typing speed. While
the feature of the time interval between typing events
was extracted, two timestamps were obtained during
typing, and four features (the time taken from press
to press, press to release, release to press, and release
to release) were calculated (Figure 2). The typing fre-
quency was calculated using the ratio of the number
of press events between a specific key and all the keys
in a message.
Thus, the following indexes were used as features
of keyboard input information.
• Ten statistics associated with each of the time
intervals between typing events (press to press,
press to release, release to press, release to re-
lease)
• Typing frequency (Backspace, Enter, Space)
• Message composition efficiency
The ten statistics were the mode, median, mean, first
quartile, third quartile, standard deviation, variance,
median absolute deviation (MAD), skewness, and
kurtosis.
4.2 Typing Vibration Information
The typing vibration information was obtained using
the acceleration-measurement device (Figure 1). This
subsection details the features extracted from the typ-
ing vibration information.
Estimation of Affective State based on Keystroke and Typing Vibration during Computer-Mediated Communication
237
Typing amplitude
Range for calculation
Typing vibration
Press event
acceleration [m/s
2
]
time [s]
10 ms
20 ms
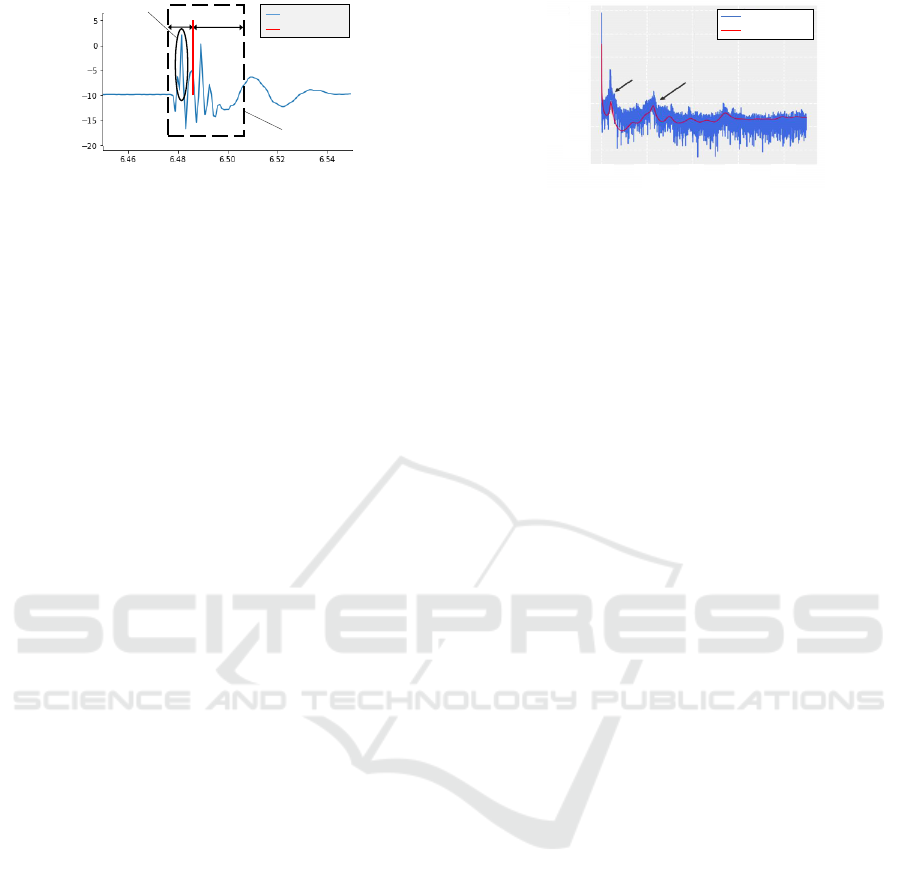
Figure 3: Calculation of typing amplitude.
To obtain information regarding the typing force,
the amplitude of the typing vibration was determined.
When the amplitude of a specific key being typed is
extracted from the typing vibration information, it is
necessary not to extract the amplitude of the typing
before and after the specific key being typed. Further,
the maximum amplitude timestamp is often later than
the typing timestamp because the oscillator errors of
Arduino Micro cause a shift in the acceleration times-
tamp. For these reasons, the typing amplitude was
defined as the maximum value in the range from 10
ms before to 20 ms after the typing instant.
We considered utilizing the formant frequency as
the feature associated with the frequency of typing vi-
bration and used the first and second formant frequen-
cies (hereinafter, referred to as the first vibration and
second vibration frequencies, respectively). Each fea-
ture was extracted as follows:
1. Extract acceleration values in the range from 500
ms before to 500 ms after the typing instant.
2. Calculate spectrum envelope using linear predic-
tion (LPC).
3. Define the lowest frequencies of the upward peaks
as the first and second vibration frequencies, re-
spectively.
Figure 4 depicts the first and second vibration fre-
quencies and the spectrum envelope obtained from the
actual typing. The Enter key is often used at the end
of a sentence during typing; therefore, the sharpness
of typing the Enter key is an indicator of the message
sender’s affective state. Therefore, the first and sec-
ond vibration frequencies in typing just the Enter key
were used.
The features related to typing vibration informa-
tion are as follows:
• Ten statistics associated with the typing amplitude
(characters, Backspace, Enter, Space)
• Ten statistics associated with the first and second
vibration frequencies in the typing amplitude
The ten statistics were the same as those listed for the
keyboard input information.
frequency [Hz]
spectrum [dB]
FFT spectrum
LPC envelope
first peak frequency
second peak frequency
100
80
60
40
20
0
-20
0 200
400
600 800
Figure 4: Spectrum envelope and vibration frequencies.
4.3 Classifier
If the level—high or low—of the valence and arousal
can be known during CMC, it can be used as a sub-
stitute for nonverbal information. Therefore, it is de-
sirable that the classifier used to estimate valence and
arousal specializes in binary classification problem.
In this study, the SVM, which satisfies the special-
ization, was applied as a classifier. The radial basis
function (RBF) was applied as the Kernel function,
and hyperparameters of SVM were determined ex-
ploratory by grid search.
5 EXPERIMENT
To employ the SVM as a classifier that estimates va-
lence and arousal using keyboard input and typing
vibration information, we recruited participants and
conducted experiments to collect the data that were
used for learning. In the experiments, the participants
were asked to discuss with experimenter. During the
discussion, keyboard input and typing vibration infor-
mation were gathered, which were used as inputs for
the SVM. Its outputs were the valence and arousal.
We verified the generalized performance of the classi-
fier through cross-validation. The Ethics Committee
of the University of Tokyo approved the experiment
(No. 19-360). Written informed consent was obtained
from every participant.
5.1 Experiment Design
The participants in the experiment were eight healthy
adult males (aged 23.6 ± 0.32 yr). They were asked
to prepare certain reports and discuss them through
CMC using Slack (Slack, 2019), a business chat
tool. During the communication, the keyboard in-
put information was obtained, and the typing vibra-
tion information was collected using the acceleration-
measurement device. The experimental procedure is
illustrated in Figure 5. Two different conditions (posi-
tive and negative), which will be described later, were
BIOSIGNALS 2021 - 14th International Conference on Bio-inspired Systems and Signal Processing
238
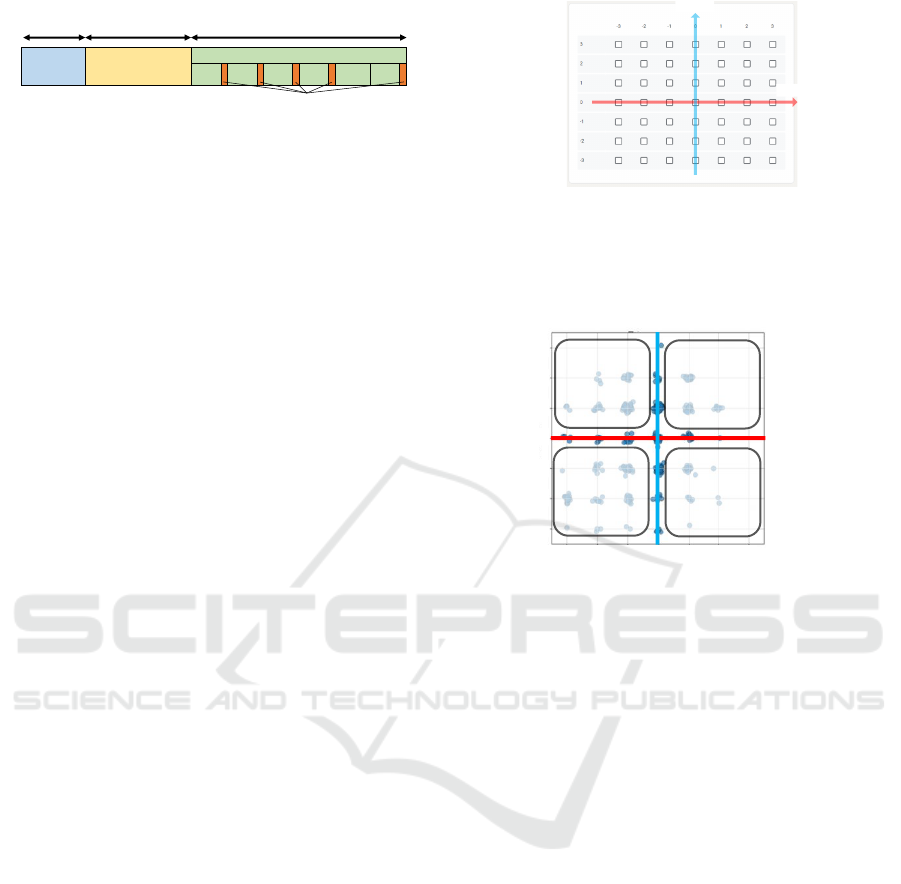
Rest Report task
Discussion
5 min
Approximately
7 min
30-40 min
・・・
Post
Questionnaire
Post
Post
Post
Post
Figure 5: Experimental procedure.
implemented three times for each participant, so that
each participant conducted the experiment six times.
5.1.1 Stage I: Rest
The participants rested for 5 min. The aim of this
stage was to calm their affective states.
5.1.2 Stage II: Report Writing
The participants alone thought of solutions to a social
problem and prepared related reports for about 7 min.
After completion, they posted their reports onto the
chat space.
5.1.3 Stage III: Discussion
The reviewer and participants discussed the posted re-
ports through the chat space. To impact the partic-
ipants’ affective states, two conditions, positive and
negative, were prepared and implemented through the
reviewer’s behavior. Under the positive condition, the
reviewer’s response was designed to affirm the pro-
posals of the participants to create a good impression
in the participants’ minds. Under the negative condi-
tion, the reviewer posted comments that rejected the
participants’ proposals. During the discussion, the
keyboard input and typing vibration information was
measured using the laptop used by the participants.
To obtain references of the participants’ valence and
arousal for each message, the participants were asked
to evaluate their affective states through a question-
naire (Figure 6).
The discussion was continued for about 30–40 min
with 10 messages from each participant being sent.
Figure 6 exhibits the questionnaire based on Rus-
sell’s valence–arousal model (Russell, 1980). The
horizontal and vertical axes represent valence and
arousal, respectively. The questionnaire consists of 7
× 7 = 49 block check boxes including the axes, which
correspond to valence = 0 and arousal = 0. The partic-
ipants indicated their own affective states by checking
the appropriate boxes.
5.2 Analysis
Using the SVM to estimate the valence and arousal,
we conducted a two-category classification.
Arousal
Valence
Figure 6: Questionnaire used in experiment. Horizontal
and vertical axes represent levels of valence and arousal,
respectively. With respect to the corresponding axes, higher
than 0 and lower than 0 indicate high and low valence and
arousal, respectively.
3
2
1
0
-1
-2
-3
3210-1-2-3
Valence
lasuorA
Median of arousal
(Valence, Arousal)
(0, 1)
=
(Valence, Arousal)
(1, 1)
=
(Valence, Arousal)
(0, 0)
=
(Valence, Arousal)
(1, 0)
=
Median of valence
Figure 7: Distribution of questionnaire results and label-
ing process. The diameter of the gray circle represents the
number of responses.
5.2.1 Data Preprocessing
The references of valence and arousal were labeled as
high or low for conducting the two-category classi-
fication. First, the medians for valence and arousal
were calculated in all the participants’ references.
Next, the questionnaire results higher (lower) than the
respective medians were labeled high (= 1) (low (=
0)). The questionnaire results that matched the me-
dian were removed for classification. After all, the
median was 0 for both valence and arousal. The dis-
tribution of results and labeling process are depicted
in Figure 7.
5.2.2 Classification I: Two-category
Classification for Randomized Data Set
Using SVM, we classified the valence and arousal la-
bels into two categories. To evaluate the classifier,
four-fold cross-validation was conducted using ran-
domized data including those from all eight partici-
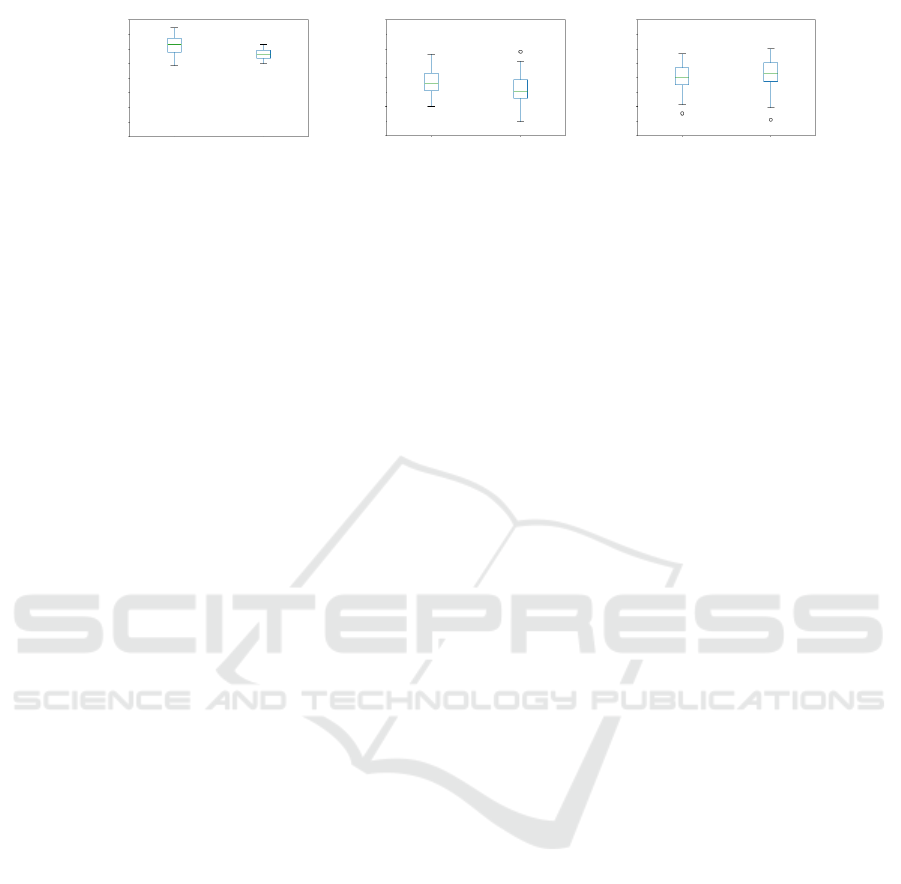
pants. The accuracies of valence and arousal in the 28
cross-validations are presented as box-and-whisker
plots in Figure 8. The average accuracies and standard
deviations were 81.2% ± 4.7% for valence classifica-
tion and 78.2% ± 2.4% for arousal classification.
Estimation of Affective State based on Keystroke and Typing Vibration during Computer-Mediated Communication
239
Valence Arousal
80.0
70.0
60.0
Classification I Classification II Classification III
90.0
accuracy [%]
50.0
Valence Arousal Valence Arousal
80.0
70.0
60.0
90.0
accuracy [%]
50.0
80.0
70.0
60.0
90.0
accuracy [%]
50.0
Figure 8: Accuracy of cross-validation in each classification. In Classification I, four-fold cross-validation was conducted
using randomized data set. In Classification II, cross-validation was conducted using unlearned participants’ data for veri-
fying generalization performance. In Classification III, cross-validation was conducted using effective features as input for
improving versatility.
5.2.3 Classification II: Two-category
Classification to Verify Generality
Considering the fact that individual differences were
possible in the features extracted from the keyboard
input and typing vibration information, we concluded
that the versatility of the classifier would be reduced
if the learning and verification data included the same
participant’s data. To verify the generality of the clas-
sifier for unlearned individual data, the eight sets of
data obtained were divided into sets of six (for learn-
ing data) and two (for validation data). A total of
28 cross-validations, which are the number of cases
of division, were conducted to verify the generalized
performance of the classifier.
The average accuracies and standard deviations
were calculated as 68.5% ± 4.5% and 66.4% ± 5.4%
for valence and arousal, respectively. The accuracies
of valence and arousal in the 28 cross-validations are
presented as box-and-whisker plots in Figure 8, which
indicates the accuracy varied widely, and it was ob-
served that the generalization was low. The reason
for this result is the use of several features with large
individual differences. To construct a classifier with
generalized performance, it is necessary to use only
those features that do not vary depending on the indi-
vidual in the estimation.
5.2.4 Classification III: Classification using
Effective Features
To improve the generality of the classifier with SVM,
we considered specifying the features that would be
effective for classifying the valence and arousal as
high or low. Similar to the case of Classification II,
all the data were divided sets of six and two, and a
total of 28 cross-validations, which is the number of
cases of division, were conducted. We thus concluded
that the features frequently confirmed to be significant
by the 28 cross-validations were effective for classi-
fication. To confirm the effectiveness of the features
for a classification model other than SVM, a one-way
analysis of variance (one-way ANOVA) test, which
is a feature-selection method, depending on each fea-
ture, was applied. To investigate whether the high-
and low-labeled groups were significantly different
for each feature, the test was conducted for each it-
eration by calculating the p-values for each feature.
Next, we calculated the number of times the sig-
nificance level (p<0.05) was met for each feature.
These results indicated that the accuracies for va-
lence and arousal were the highest when the features
that met the significant levels more than 24 and 28
times, respectively, were used, as presented in Fig-
ure 9, which depicts the accuracy for valence and
arousal. The features for valence and arousal used
in this classification are presented, respectively, in Ta-
ble 2 and Table 3. The tables also provide the effective
feature changes observed when valence and arousal
were high compared to when they were low. For the
classification of high or low valence and arousal us-
ing the selected features as input, 28 cross-validations
were conducted, as in Classification II. The accura-
cies of valence and arousal in the 28 cross-validations
are presented as box-and-whisker plots in Figure 8.
The average accuracies and standard deviations were
69.8% ± 4.8% for valence and 71.1% ± 5.8% for
arousal. When compared with the performance of
Classification II, which was carried out using all the
features, the generalization performance of Classifi-
cation III was better.
Variations in more effective feature that met sig-
nificance level 28 times and that varied specially be-
tween high and low, in valence and arousal respec-
tively, are as presented in Figure 10.
6 DISCUSSION
The valence and arousal of participants uncontained
in learning data can be estimated at accuracies of
69.8% and 71.1%, respectively, by introducing typing
vibration information and using effective features. Ta-
ble 3 indicates the features that are effective for the es-
timation of arousal, and 12 of 9 features were related
to typing amplitude. Introducing typing vibration in-
BIOSIGNALS 2021 - 14th International Conference on Bio-inspired Systems and Signal Processing
240
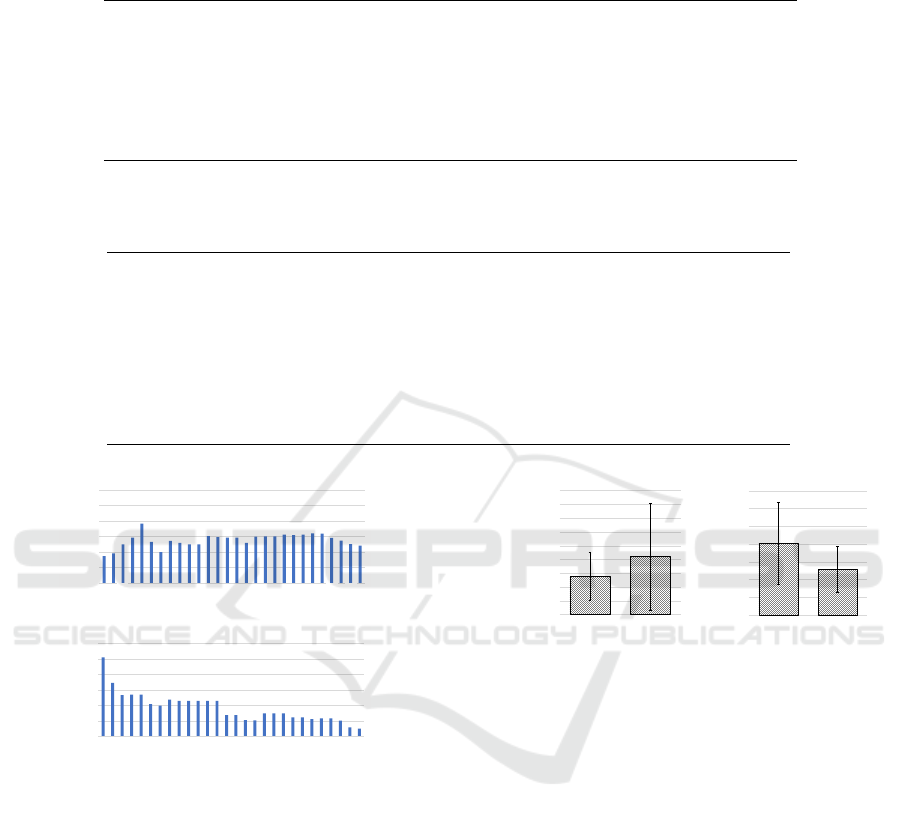
Table 2: Features that frequently met significance level for valence. The column “change” provides the change of feature
observed when valence was high compared to when it was low.
feature number of times change
time interval between typing events press to press standard deviation 28 decrease
time interval between typing events press to release mean 28 decrease
time interval between typing events press to release variance 27 decrease
time interval between typing events press to release MAD 27 decrease
typing amplitude Backspace MAD 26 decrease
time interval between typing events release to press standard deviation 25 decrease
time interval between typing events press to release third quartile 24 decrease
typing amplitude Backspace standard deviation 24 decrease
time interval between typing events release to release standard deviation 24 decrease
time interval between typing events press to press standard deviation 24 increase
Table 3: Features that frequently met significance level for arousal. The column “change” provides the change of feature
observed when arousal was high compared to when it was low.
feature number of times change
typing amplitude characters standard deviation 28 increase
typing amplitude characters mean 28 increase
typing amplitude Space mean 28 increase
typing amplitude characters MAD 28 increase
typing amplitude characters median 28 increase
typing amplitude characters first quartile 28 increase
typing amplitude characters third quartile 28 increase
typing amplitude Space MAD 28 increase
time interval between typing events press to release mean 28 decrease
time interval between typing events press to release third quartile 28 decrease
time interval between typing events press to release first quartile 28 decrease
typing amplitude Space variance 28 increase
66.0
67.0
68.0
69.0
70.0
71.0
72.0
28 26 24 22 20 18 16 14 12 10 8 6 4 2
accuracy [%]
66.0
67.0
68.0
69.0
70.0
71.0
72.0
28 26 24 22 20 18 16 14 12 10 8 6 4 2
N
Valence
Arousal
72.0
71.0
70.0
69.0
68.0
67.0
66.0
28
26
24 22
20
18
16
14
12
10
8
6
4 2
accuracy [%]
72.0
71.0
70.0
69.0
68.0
67.0
66.0
28
26
24 22
20
18
16
14
12
10
8
6
4 2
N
Figure 9: Accuracy for valence and arousal in Clas-
sification III. Estimation accuracy for valence (top) and
arousal (bottom) when using features that met significant
level (p<0.05) more than N times during cross-validation.
formation generalized the classifier’s performance for
the estimation of arousal. However, due to the small
size of participants (= 8 males), the above should be
interpreted as a view based on preliminary experimen-
tal results. Khan et al. and Serigo et al. utilized infor-
mation regarding computer mouse events and window
switching in addition to keyboard input information
for estimating the affective states (Khan et al., 2013;
Salmeron-Majadas et al., 2014). In this study, we
considered that the estimation of valence and arousal
at an accuracy of approximately 70% without these
information during CMC, computer mouse operation
and window switching are rarely used, was a huge
contribution.
0
25
50
75
100
125
150
175
200
225
Time interval between
press to release
(standard deviation)
high low
0.00
0.10
0.20
0.30
0.40
0.50
0.60
0.70
Typing amplitude
at Space key
(MAD
)
255
200
175
150
125
100
75
50
25
0
0.70
0.60
0.50
0.40
0.30
0.20
0.10
0.00
high low
Valence
Arousal
Figure 10: Variation in effective features in valence and
arousal. Standard deviation of the time interval between
press to release in valence (left), and MAD of the typing
amplitude at Space key in arousal (right).
The following trends are noticed in Classification
III. Compared with when valence is low, especially,
the time interval between typing events is shorter and
its dispersion is also lower when the valence is high.
This implies that the typing speed is faster and con-
stant when the valence is high. Compared with when
arousal is low, the typing force is stronger and its
dispersion is higher when the arousal is high. This
implies that the typing force is stronger and constant
when arousal is high. When valence was high, the
participants actively discussed the reports with the re-
viewer, their replies also came up smoothly, which
made the typing speed faster and led to monotonic
typing. Because of excitement, regardless of whether
their affective state was positive or negative, the par-
ticipants typed strongly on the keyboard when arousal
was high.
In the experiment described in this paper, the ef-
fect of variation in features on valence tended to be
Estimation of Affective State based on Keystroke and Typing Vibration during Computer-Mediated Communication
241

contrary to what has been reported in related works.
In Serigo et al.’s study, the time interval between typ-
ing events was longer when the valence was high
compared with when the valence was low (Salmeron-
Majadas et al., 2014). Our experiment reported this
time as being shorter. This observation can be at-
tributed to the specific experimental design imple-
mented. Serigo et al. introduced a time limit for
task completion to create stress on the participants,
thus impacting their affective states. In our study, the
participants’ affective states were impacted through
a certain communication stress, such as strict replies
from the reviewer, to simulate the understanding that
the stress is usually caused by the actual content of the
communication. Hence, the results obtained through
our experimental design are useful in understanding
the impact on affective state during CMC.
The features related to vibration amplitude met a
significant level (p<0.05) for classifying high or low
valence and arousal in several cases. Thus, it was es-
tablished that the features related to typing force are
effective in the estimation of arousal.
7 CONCLUSION
In this paper, we proposed a method to estimate va-
lence and arousal using keyboard input and typing vi-
bration information. Effective features were selected
through statistical tests, and the unlearned partici-
pants’ data were classified to investigate versatility.
This time, the average accuracies and standard devi-
ations were 69.8% ± 4.8% for valence and 71.1% ±
5.8% for arousal. Thus, it was established that it is
possible to estimate valence and arousal with high ac-
curacy for the unlearned participants’ data by specify-
ing the features and using keyboard input and typing
vibration information.
In future study, it is necessary to further improve
the accuracy by selecting features specifically suitable
for each individual. Further, the determination of es-
sential features that are common across keyboards is
required since each keyboards have different charac-
teristics.
It is expected that the findings of this study will
facilitate smooth computer-mediated communication
in the near future, avoiding misinterpretation of other
people’s messages.
REFERENCES
Bixler, R. and D’Mello, S. (2013). Detecting boredom and
engagement during writing with keystroke analysis,
task appraisals, and stable traits. In Proceedings of
the 2013 international conference on Intelligent user
interfaces, pages 225–234.
Bos, D. O. et al. (2006). Eeg-based emotion recognition.
The Influence of Visual and Auditory Stimuli, 56(3):1–
17.
Felipe, D. A. M., Gutierrez, K. I. N., Quiros, E. C. M., and
Vea, L. A. (2012). Towards the development of in-
telligent agent for novice c/c++ programmers through
affective analysis of event logs. In Proc. Int. Multi-
Conference Eng. Comput. Sci, volume 1, page 2012.
Citeseer.
Hassib, M., Buschek, D., Wozniak, P. W., and Alt, F. (2017).
Heartchat: Heart rate augmented mobile chat to sup-
port empathy and awareness. In Proceedings of the
2017 CHI Conference on Human Factors in Comput-
ing Systems, pages 2239–2251.
Hernandez, J., Paredes, P., Roseway, A., and Czerwinski,
M. (2014). Under pressure: sensing stress of computer
users. In Proceedings of the SIGCHI conference on
Human factors in computing systems, pages 51–60.
Khan, I. A., Brinkman, W.-P., and Hierons, R. (2013). To-
wards estimating computer users’ mood from interac-
tion behaviour with keyboard and mouse. Frontiers of
Computer Science, 7(6):943–954.
Khanna, P. and Sasikumar, M. (2010). Recognising emo-
tions from keyboard stroke pattern. International jour-
nal of computer applications, 11(9):1–5.
Kruger, J., Epley, N., Parker, J., and Ng, Z.-W. (2005). Ego-
centrism over e-mail: Can we communicate as well as
we think? Journal of personality and social psychol-
ogy, 89(6):925.
Lin, Y.-P., Wang, C.-H., Jung, T.-P., Wu, T.-L., Jeng, S.-K.,
Duann, J.-R., and Chen, J.-H. (2010). Eeg-based emo-
tion recognition in music listening. IEEE Transactions
on Biomedical Engineering, 57(7):1798–1806.
Lv, H.-R., Lin, Z.-L., Yin, W.-J., and Dong, J. (2008). Emo-
tion recognition based on pressure sensor keyboards.
In 2008 IEEE International Conference on Multime-
dia and Expo, pages 1089–1092. IEEE.
Russell, J. A. (1980). A circumplex model of affect. Journal
of personality and social psychology, 39(6):1161.
Salmeron-Majadas, S., Santos, O. C., and Boticario, J. G.
(2014). An evaluation of mouse and keyboard inter-
action indicators towards non-intrusive and low cost
affective modeling in an educational context. Proce-
dia Computer Science, 35:691–700.
Slack, I. (2019). Slack, Inc. https://slack.com/ (reference
date, October 1st ,2020).
Wang, H., Prendinger, H., and Igarashi, T. (2004). Commu-
nicating emotions in online chat using physiological
sensors and animated text. In CHI’04 extended ab-
stracts on Human factors in computing systems, pages
1171–1174.
Wu, G., Liu, G., and Hao, M. (2010). The analysis of emo-
tion recognition from gsr based on pso. In 2010 Inter-
national symposium on intelligence information pro-
cessing and trusted computing, pages 360–363. IEEE.
BIOSIGNALS 2021 - 14th International Conference on Bio-inspired Systems and Signal Processing
242
