
Electrochemical Impedance Simulation for Single Cell Analysis using
a Microelectrode
Masataka Shiozawa and Shigeyasu Uno
Graduate School of Science and Engineering, Ritsumeikan University,
1-1-1 Noji-Higashi, Kusatsu, Shiga, 525-8577, Japan
Keywords: Electrochemical Impedance, Simulation, Single Cell Analysis, Microelectrode.
Abstract: Electrochemical impedance spectroscopy (EIS) is one of the ways to monitor living cells in terms of
morphology and cell-substrate adhesion. In conventional cell analysis, averaged values from many cells on a
large area electrode are acquired. Meanwhile, single cell characteristics are obtained by using a microelectrode
which is smaller than single cell size. In this study, we investigated the impact of electrode size on single cell
EIS analysis by using a computer simulation. The electrode smaller than the cell size would enable
independent measurement of the cytoplasm electrical conductivity and the cell-substrate gap resistance. In
addition, changes in morphology such as cell height and radius should be monitored at the same time in
different frequency range. Thus, our simulation indicates that EIS measurement with microscale electrode
may be used in monitoring various physiological changes in cells such as immune response.
1 INTRODUCTION
Nowadays, the living cell monitoring is used in
disease diagnosis (Cheng et al., 2007) and drug
discovery (Weigl et al., 2003). In drug discovery, the
side effect on tissue culture is evaluated by
monitoring cells. This method is used in regenerative
medicine as well as in disease diagnosis and drug
discovery. In regenerative medicine, one of the basic
ways of treatment is to transplant the stem cell
induced differentiation to the affected area. During
inducing differentiation process, we need to monitor
the morphological change of the stem cell to detect
the progress of differentiation (Santelli et al., 2018).
As mentions above, the living cell monitoring is
needed in various areas.
The fluorescent labeling such as fluorescence
microscope (Hopt & Neher, 2001) and flow
cytometry (Nolan et al., 2018) has long been used as
the way of monitoring living cells. These methods
can selectively monitor any proteins and antigens due
to staining. In addition, these methods can provide the
quantitative information by estimating the fluorescent
reflection signal from cells irradiated with excitation
light (Hopt & Neher, 2001; Nolan et al., 2018).
However, the fluorescent labeling may alter original
characteristics of cells. In addition, the fluorescent
labeling eventually induces the cell death. Thus, it is
not appropriate to monitor the cells in long term, and
therefore, the label-free monitoring methods have
been explored.
There are some researches about the ways of
monitoring living cells without labeling, such as
Raman spectroscopy (Moura et al., 2016) and surface
plasmon microscopy (Toma et al., 2014). The
electrochemical impedance spectroscopy (EIS) is one
of the applicable ways which require no labeling.
Contrary to the fluorescent labeling, the EIS
measurement is suitable to monitor in long term. In
EIS measurement, the AC voltage of several mV is
applied to the electrode. Then the electric current is
measured, and impedance is calculated from the ratio
of current to voltage to analyze the object. Previous
studies have proven that the EIS measurement for cell
analysis can supply various information such as the
apoptosis, the movement of cancer cells through the
tight junction of endothelial cells (Anchan et al.,
2019), the wound healing (Gamal et al., 2019), the
cell proliferation (Cui et al., 2017; Iwakura et al.,
2019) and the cell migration (Cui et al., 2017;
Iwakura et al., 2019) by sweeping frequency. The EIS
measurement does not need any optical equipment.
Therefore, the EIS measurement should be used in
point of care (Hedayatipour et al., 2019; Ahmed et al.,
2014) by downsizing the whole measurement system
114
Shiozawa, M. and Uno, S.
Electrochemical Impedance Simulation for Single Cell Analysis using a Microelectrode.
DOI: 10.5220/0010266401140120
In Proceedings of the 14th International Joint Conference on Biomedical Engineering Systems and Technologies (BIOSTEC 2021) - Volume 1: BIODEVICES, pages 114-120
ISBN: 978-989-758-490-9
Copyright
c
2021 by SCITEPRESS – Science and Technology Publications, Lda. All rights reserved
with CMOS technology (Hedayatipour et al., 2019;
Manickam et al., 2010).
In conventional cell analysis, cell characteristics
are obtained from average values of many cells on a
large electrode. However, recent study shows that
cells may have the difference of gene. Hence, the
individual cell difference such as the cell shape is
caused (Moura et al., 2016). Such analysis ignores
these individual cell differences (Zhou et al., 2010).
On the other hand, single cell monitoring is a useful
method because the individual cell differences can be
observed (Zhou et al., 2010). In EIS measurement,
various electrode structures have been used to
measure; the interdigitated electrodes have long been
used by many experimentalists as the electrochemical
sensor (Ibrahim et al., 2013; Radke & Alocilja, 2005).
Meanwhile, EIS using a microelectrode can provide
more capability of label-free and single cell analysis
than any other electrode structures. In fact,
experimental demonstration of impedance mapping
with microelectrode for tissues is reported (Vijay et
al., 2016; Miccoli et al., 2019). Such microscale
electrodes are proposed to be used in high sensitivity
measurement and detailed analysis in single cell
monitoring. Nevertheless, it is difficult to associate
experimental EIS data with underlying changes in cell
morphology. Such relation can be made clear by
computer simulation.
In this work, we demonstrate computer simulation
of EIS with microelectrode for single cell analysis.
Our computer simulation reveals relationship
between EIS data and cell morphology parameters.
Our findings will benefit experimentalists in analysis
of experimental data and optimization of sensor
microelectrode design.
2 THEORY
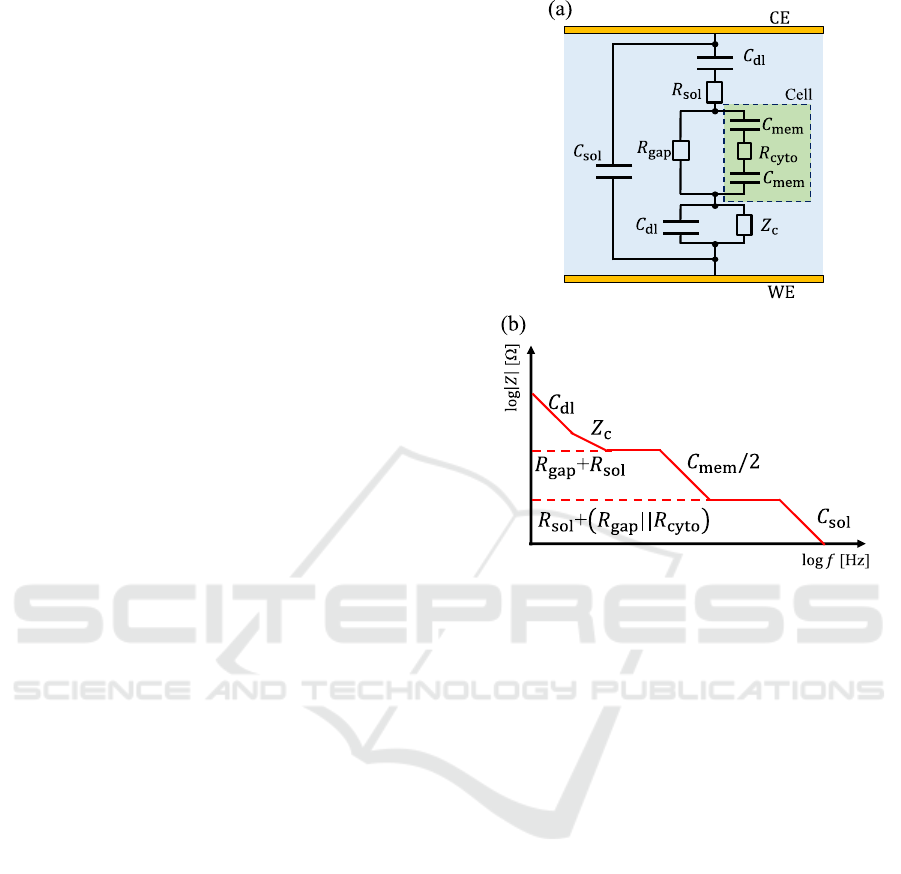
The equivalent circuit is used to analyse in EIS
measurement. Fig. 1(a) shows the equivalent circuit
model of conventional parallel facing electrode
(Tanaka et al., 2020), where the 𝐶
indicates the
electrochemical double layer capacitance and the 𝑍
indicates the impedance between cell and substrate
(Giaever & Keese, 1991). In addition, the 𝑅
indicates the solution resistance and the R
gap
indicates
the intercellular solution resistance. The electrical
components of cells were described as cell membrane
capacitance
𝐶
and cytoplasm resistance (R
cyto
).
Fig. 1(b) shows the schematic illustration of
impedance magnitude-frequency characteristics from
the equivalent circuit shown in Fig. 1(a). Note that, in
bode plot, the slope of capacitance and resistance are
Figure 1: (a) The equivalent circuit model of parallel facing
electrode for EIS measurement of cell. The WE and CE
indicate working electrode and counter electrode,
respectively. (b) Schematic illustration of impedance
magnitude-frequency characteristics. The 𝑅
||𝑅
indicates the combined resistance of R
gap
and R
cyto
in
parallel.
−1 and 0, respectively. On the other hand, the slope
of 𝑍
is −1 or more, but less than 0 because the 𝑍
is
expressed by the distributed model (Giaever & Keese,
1991). It should be noted that in this study, a
microelectrode was used as working electrode (WE),
and hence this equivalent circuit (Fig. 1(b)) is not
exactly applicable to the analysis for this study.
However, when we analyze the result of simulation
for single cell on a microelectrode, we should obtain
valuable information by comparing to this equivalent
circuit.
3 IMPEDANCE
CHARACTERISTICS FOR DISC
ELECTRODE
The simulation model of single cell monitoring on a
microelectrode is shown in Fig. 2(a). Constant bias
was set to Zero and a sinusoidal voltage with
Electrochemical Impedance Simulation for Single Cell Analysis using a Microelectrode
115
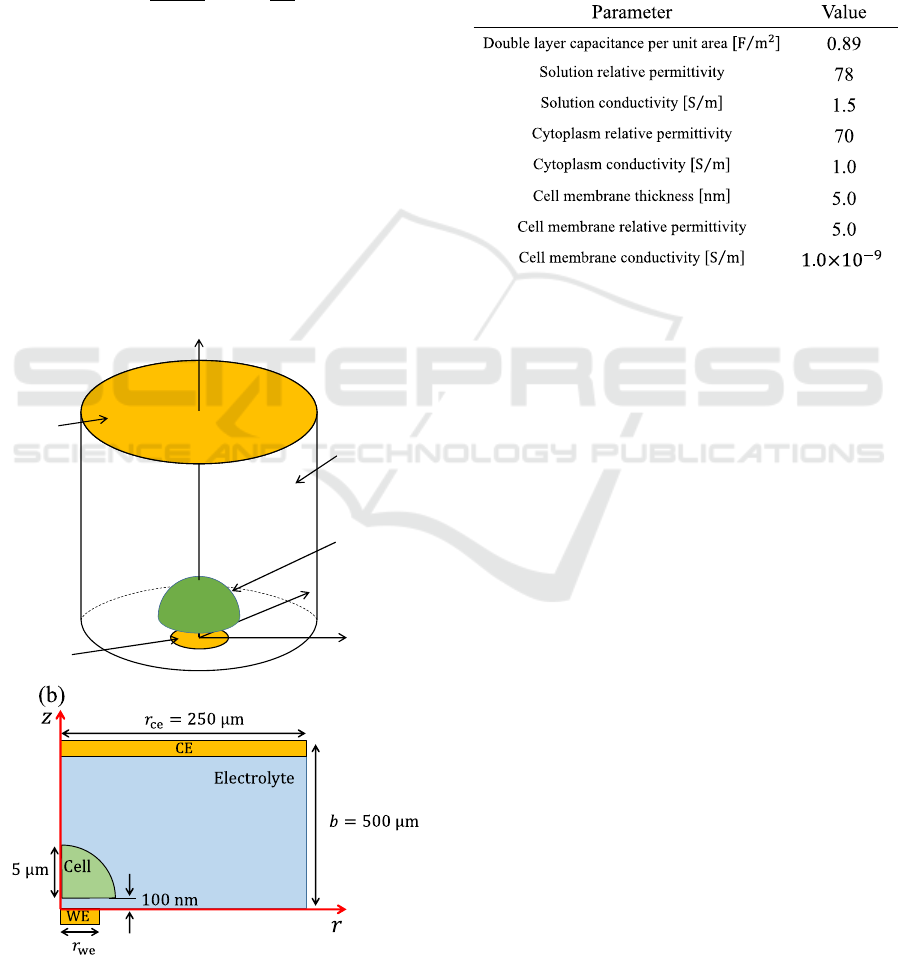
amplitude 5.0 mV was applied to WE while CE was
set to ground. The cell was modeled as hemisphere
(Ren & Chui, 2018) and the cell radius was set to 5μm.
The distance between the WE and single cell was set
to 100 nm (Ren & Chui, 2018). The mirror boundary
condition was imposed on the side face of solution.
Theoretical calculation with the following Eq. (1) is
used to calculate the solution resistance in Fig. 2(a)
(Denhoff, 2006).
R
S
=
1
2πr
we
σ
arctan
2b
r
we
, (1)
where 𝑟
is the WE radius, 𝜎 is the conductivity of
solution and b is the distance between WE and CE.
The simulated spreading resistance becomes
analogous to the spreading resistance calculated by
Eq. (1) under the condition that satisfies 𝑟
≪𝑏 and
𝑟
≪𝑟
, where 𝑟
is CE radius. Therefore, the
distance between WE and CE was 100 times or more
as long as WE radius. Likewise, CE radius was 100
times or more as long as WE radius. Actual
simulation is done in axisymmetric 2D (cylindrical
coordinate) as shown in Fig. 2(b) due to rotational
symmetry. Table. 1 shows the parameters used in
Figure 2: (a) Sensor structure, (b) simulation model in
cylindrical coordinate.
swept from 10
Hz to 10
Hz. Note that the WE radius
was changed from 2μm to 4.5μm stepped by 0.5μm.
These WE radius were based on the literature of
Miccoli et al (2019). We used COMSOL
Multiphysics
®
5.3a for numerical simulation. Note
that the differentail forms of Maxwell’s equations are
solved in this software.
Table. 1: Parameter used in simulation (Ermolina et al.,
2001).
3.1 Result
Fig. 3 shows the Bode plot of simulated impedance
from Fig. 2(b). In Fig. 3, the electrical double layer
capacitance (𝐶
) is dominant around 10
3
Hz. From
10
4
Hz to 10
7
Hz, most of potential drops across
solution between cell and sensor substrate, thus the
cell-substrate impedance (𝑍
) is dominant. Around
10
8
Hz, the impedance depends on the spreading
resistance (𝑅
) (Denhoff, 2006), and the capacitance
of solution is significant at 10
9
Hz. In Fig. 3, at 10
5
Hz, the slope of
|
𝑍
|
becomes closer to 0 as 𝑟
decreases. This behaviour is attributed to the fact that
the equivalent circuit model of 𝑍
changes from
distributed (Fig. 4(a)) (Giaever & Keese, 1991) to
lumped-constant (Fig. 4(b)) model. This result
indicates that the cell-substrate resistance could be
detected directly, enabling to detect the change of
conductivity between cell and sensor substrate. In
higher frequency range around 10
8
Hz, the slope of
|
𝑍
|
is almost 0. The impedance of cell membrane
capacitance can be ignored here, and the impedance
only depends on spreading resistance 𝑅
(Denhoff,
2006). Fig. 5 represents impedance characteristics for
disk microelectrode around 50 MHz. Note that in Fig.
5, the theoretical curve is calculated using the 𝑅
formula with cytoplasm and solution conductivity. In
Fig. 5, as 𝑟
decreases, the simulated impedance
becomes closer to the theoretical curve calculated by
cytoplasm conductivity. This is attributed to the
�
0
�
�
Cell
WE
Solution
CE
(
a
)
BIODEVICES 2021 - 14th International Conference on Biomedical Electronics and Devices
116
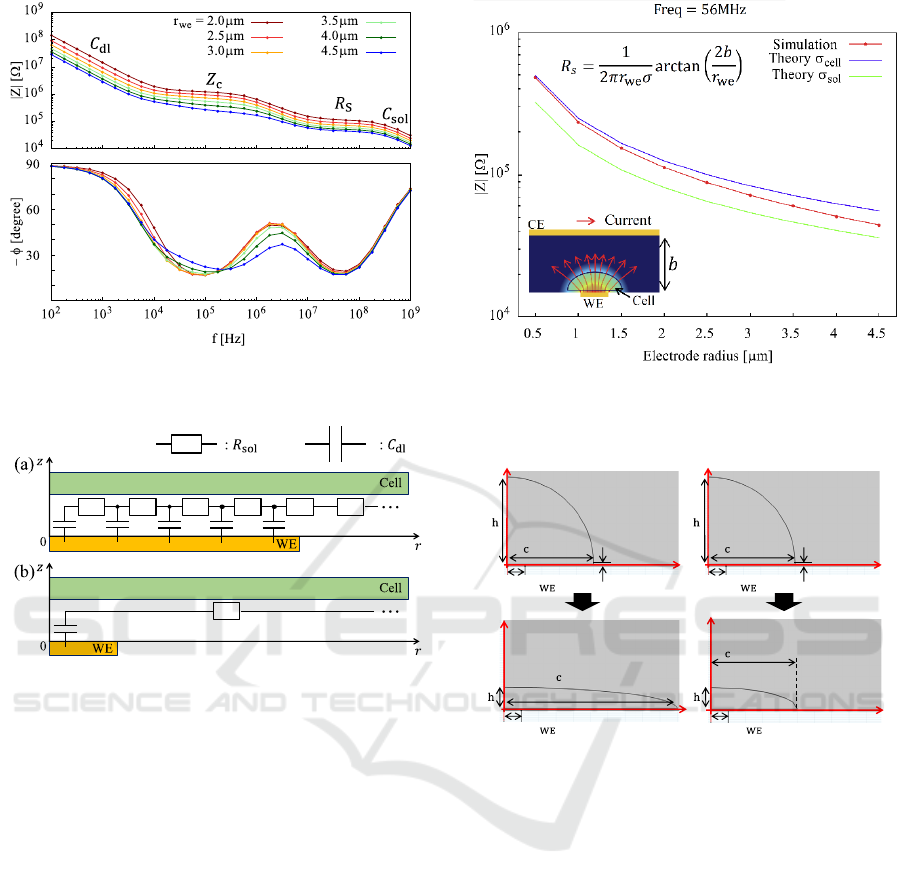
Figure 3: Bode plot of simulated impedance from Fig. 2.
Legends indicate working electrode radius.
Figure 4: Schematic illustration of the equivalent circuit
model of the impedance 𝑍
between cell and sensor
substrate. (a) WE radius is close to cell radius and (b) WE
radius is much smaller than cell radius.
potential drop localization around WE due to the
decrease in 𝑟
. Consequently, most of 𝑅
becomes
the spreading resistance within the cell. Hence, for
smaller 𝑟
, the impedance around 10
8
Hz reflects the
cytoplasm conductivity. This indicates that a
microelectrode could reveal the conductivity inside
the cell.
4 CELL ADHESION
The cell adhesion is an important behaviour in the
healing process and immune response of tissues
(Wegener et al., 2000). Hence, we simulated the cell
adhesion process by using a microelectrode. Fig. 6(a)
represents the simulation model of cell adhesion. In
Fig. 6(a), the 𝑟
was swept parametrically while the
cell volume is fixed. Obviously, in Fig. 6(a), the
radius and the height of cell change simultaneously.
Therefore, another simulation as shown in Fig. 6(b)
Figure 5: Electrode radius-impedance characteristics at 56
MHz and schematic illustration of electric potential and
current flow. Electric potential drops from red to blue.
Figure 6: (a) Constant cell volume, (b) constant cell radius.
was done in order to identify which change has an
impact on impedance by sweeping only 𝑟
. In Fig.
6(b), the 𝑟
is fixed to 5μm and the 𝑟
is the same as
used in Fig. 6(a). Note that the WE radius was set to
1μm because from the result in Fig. 5, we predicted
that the smaller electrode should provide more
sensitive detection of the cell height change in
adherent process. The other parameters are the same
as Table. 1.
4.1 Result
Figs. 7(a) and 7(b) represent the Bode plot of
simulated impedance from Fig. 6(a) and Fig. 6(b),
respectively. Fig. 7(c) represents the impedance
sensitivity calculated based on Fig. 6(a). The
sensitivity is written as
(
a
)
(
b
)
�
�=5µm
100nm
WE
� =1µm
�
�
�
�= 10µm
WE
� =1µm
�
�
�
�=5µm
WE
� =1µm
�
�
�
�=5µm
100nm
WE
� =1µm
�
�
Electrochemical Impedance Simulation for Single Cell Analysis using a Microelectrode
117
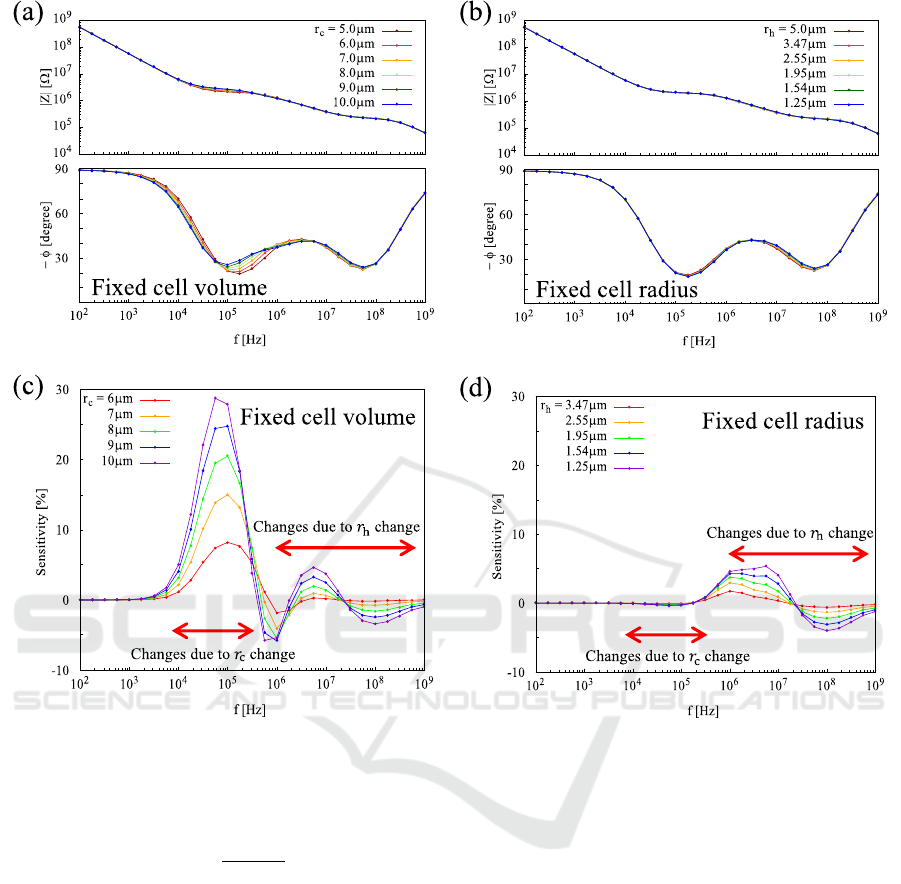
Figure 7: (a) Bode plot of simulated impedance from Fig.6(a). (b) Bode plot of simulated impedance from Fig.6(b). (c)
Sensitivity calculated based on cell radius 5μm from (a), and (d) sensitivity calculated based on cell height 5μm from (b).
Legends of (a), (c) indicate the cell radius and legends of (b), (d) indicate the cell height.
Sensitivity [%]=
|
Z
r
|
Z
5μm
Z
5μm
×100 ,
2
where 𝑍
is the impedance magnitude when the
cell radius is 5μm and
|
𝑍
|
is the impedance
magnitude of each cell radius except for 5μm.
Likewise, Fig. 7(d) represents the impedance
sensitivity from Fig. 7(b). Note that the peak
sensitivity was achieved around 10
5
Hz in Fig. 7(c).
This is attributed to the increase in cell-substrate
resistance due to the increase in cell radius, which
should not appear in Fig. 7(d) as expected. In other
words, it is possible to measure independently the cell
radius and cell height from the impedance for each
frequency range.
5 DISCUSSION
In this study, we showed the benefit of using
microelectrodes smaller than single cell size by
computer simulation. The first point to be discussed
is the impact of electrode size. In Fig. 3, around 10
5
Hz, smaller electrode size leads to more distinct
detection of cell-substrate resistance. There is a report
showing impedance change of aspirin-treated cell
around 10
5
Hz (Yin et al., 2007), where the cells
treated with 1mM aspirin showed the difference from
the cells without treatment in the methyl tetrazolium
(MTT) assay. On the other hand, in EIS measurement
using electrode larger than single cell, there was no
difference between the treated cell and the control cell.
The microelectrode could provide the difference of
impedance magnitude between the cells treated with
BIODEVICES 2021 - 14th International Conference on Biomedical Electronics and Devices
118

1mM aspirin and the cells without treatment around
10
5
Hz. In Fig. 5, around 10
8
Hz, as the electrode size
decreases, the simulated impedance becomes closer
to the theoretical curve calculated using the 𝑅
formula with cytoplasm conductivity. This result
indicates that the theoretical value can provide the
cytoplasm electrical conductivity. Previous study
shows the measurement of cytoplasm impedance
changes under the different concentrations of drug
introduced into cells (Stolwijk et al., 2011). The
concentration of drug could be surmised from
cytoplasm electrical conductivity by using a
microelectrode. The second concerns the change in
morphology such as cell height and radius. Figs. 7(c)
and 7(d) show that the electrode smaller than single
cell size can provide the significant sensitivity to
detect the morphological change of single cell. A
recent study showed that the impedance change was
caused by the morphological change derived from
cellular differentiation (Hildebrandt et al., 2010).
However, the difference of impedance magnitude
between control and necrotic spheroids was 6% at
most (Hildebrandt et al., 2010). It is quite possible
that using microscale electrode instead of the
electrode having a diameter of 1mm affords the
significant difference of impedance magnitude in the
same experiment.
6 CONCLUSIONS
The simulation was performed to study the
characteristics of a microelectrode smaller than single
cell. First, a microelectrode shows the feasibility to
measure the resistance between cell and substrate at
low frequency. Second, microelectrode smaller than
a cell shows better performance in detection the
conductivity inside the cell at high frequency. The
simulation of the cell adhesion process showed that a
microelectrode exhibits sufficient sensitivity to
measure the radius and the height of cell
independently in different frequency range.
ACKNOWLEDGEMENTS
This work was supported by JSPS KAKENHI
19K04539.
REFERENCES
Cheng, X., Liu, Y., Irimia, D., Demirci, U., Yang, L., Zamir,
L., … Bashir, R. (2007). Cell detection and counting
through cell lysate impedance spectroscopy in
microfluidic devices. Lab Chip, 7 (6), 746–755.
Weigl, B. H., Bardell, R. L., & Cabrera, C. R. (2003). Lab-
on-a-chip for drug development. Advanced Drug
Delivery Reviews, 55 (3), 349–377.
Santelli, J., Lechevallier, S., Baaziz, H., Vincent, M.,
Martinez, C., Mauricot, R., … Cussac, D. (2018).
Multimodal gadolinium oxysulfide nanoparticles: a
versatile contrast agent for mesenchymal stem cell
labeling. Nanoscale, 10 (35), 16775–16786.
Hopt, A., & Neher, E. (2001). Highly Nonlinear
Photodamage in Two-Photon Fluorescence Microscopy.
Biophysical Journal, 80 (4), 2029–2036.
Nolan, J., Nedosekin, D. A., Galanzha, E. I., & Zharov, V.
P. (2018). Detection of Apoptotic Circulating Tumor
Cells Using in vivo Fluorescence Flow Cytometry.
Cytometry Part A, 95 (6), 664–671.
Moura, C. C., Tare, R. S., Oreffo, R. O. C., & Mahajan, S.
(2016). Raman spectroscopy and coherent anti-Stokes
Raman scattering imaging: prospective tools for
monitoring skeletal cells and skeletal regeneration.
Journal of The Royal Society Interface, 13 (118),
20160182.
Toma, K., Kano, H., & Offenhäusser, A. (2014). Label-Free
Measurement of Cell–Electrode Cleft Gap Distance
with High Spatial Resolution Surface Plasmon
Microscopy. ACS Nano, 8 (12), 12612–12619.
Anchan, A., Kalogirou-Baldwin, P., Johnson, R., Kho, D.
T., Joseph, W., Hucklesby, J., … Graham, E. S. (2019).
Real-Time Measurement of Melanoma Cell-Mediated
Human Brain Endothelial Barrier Disruption Using
Electric Cell-Substrate Impeda-nce Sensing
Technology. Biosensors, 9 (2), 56.
Gamal, W., Borooah, S., Smith, S., Underwood, I., Srsen,
V., Chandran, S., … Dhillon, B. (2015). Real-time
quantitative monitoring of hiPSC-based model of
macular degeneration on Electric Cell-substrate
Impedance Sensing microelectro-des. Biosensors and
Bioelectronics, 71, 445–455.
Cui, Y., An, Y., Jin, T., Zhang, F., & He, P. (2017). Real-
time monitoring of skin wound healing on nano-
grooves topography using electric cell-substrate
impedance sensing (ECIS). Sensors and Actuators B:
Chemical, 250, 461–468.
Iwakura, T., Marschner, J. A., Zhao, Z. B., Świderska, M.
K., & Anders, H.-J. (2019). Electric cell-substrate
impedance sensing in kidney research. Nephrology
Dialysis Transplantation.
Hedayatipour, A., Aslanzadeh, S., & Mcfarlane, N. (2019).
CMOS based whole cell impedance sensing:
Challenges and future outlook. Biosensors and
Bioelectronics, 143, 111600.
Ahmed, A., Rushworth, J. V., Hirst, N. A., & Millner, P. A.
(2014). Biosensors for Whole-Cell Bacterial Detection.
Clinical Microbiology Reviews, 27 (3), 631–646.
Electrochemical Impedance Simulation for Single Cell Analysis using a Microelectrode
119

Manickam, A., Chevalier, A., Mcdermott, M., Ellington, A.
D., & Hassibi, A. (2010). A CMOS Electrochemical
Impedance Spectroscopy (EIS) Biosensor Array. IEEE
Transactions on Biomedical Circuits and Systems, 4
(6), 379–390.
Zhou, Y., Basu, S., Laue, E., & Seshia, A. A. (2016). Single
cell studies of mouse embryonic stem cell (mESC)
differentiation by electrical impedance measurements
in a microfluidic device. Biosensors and
Bioelectronics, 81, 249–258.
Ibrahim, M., Claudel, J., Kourtiche, D., & Nadi, M. (2013).
Geometric parameters optimization of planar
interdigitated electrodes for bioimpedance
spectroscopy. Journal of Electrical Bioimpedance, 4
(1), 13–22.
Radke, S. M., & Alocilja, E. C. (2005). A high density
microelectrode array biosensor for detection of E. coli
O157:H7. Biosensors and Bioelectronics, 20 (8), 1662–
1667.
Vijay, V., Raziyeh, B., Amir, S., Jelena, D., Alicia, B. J.,
Axel, B., … Andreas, H. (2016). High-density CMOS
microelectrode array system for impedance
spectroscopy and imaging of biological cells. 2016 Ieee
Sensors.
Miccoli, B., Lopez, C. M., Goikoetxea, E., Putzeys, J.,
Sekeri, M., Krylychkina, O., … Braeken, D. (2019).
High-Density Electrical Recording and Impedance
Imaging With a Multi-Modal CMOS Multi-Electrode
Array Chip. Frontiers in Neuroscience, 13.
Tanaka, S., Kimura, K., Miyamoto, K., Yanase, Y., & Uno,
S. (2020). Simulation and Experiment for Electrode
Coverage Evaluation by Electrochemical Impedance
Spectroscopy Using Parallel Facing Electrodes.
Analytical Sciences, 36 (7), 853–858.
Giaever, I., & Keese, C. R. (1991). Micromotion of
mammalian cells measured electrically. Proceedings of
the National Academy of Sciences, 88 (17), 7896–7900.
Ren, D., & Chui, C. O. (2018). Feasibility of Tracking
Multiple Single-Cell Properties with Impedance
Spectroscopy. ACS Sensors, 3 (5), 1005–1015.
Denhoff, M. W. (2006). An accurate calculation of
spreading resistance. Journal of Physics D: Applied
Physics, 39 (9), 1761–1765.
Ermolina, I., Polevaya, Y., Feldman, Y., Ginzburg, B.-Z.,
& Schlesinger, M. (2001). Study of normal and
malignant white blood cells by time domain dielectric
spectroscopy. IEEE Transactions on Dielectrics and
Electrical Insulation, 8 (2), 253–261.
Wegener, J., Keese, C. R., & Giaever, I. (2000). Electric
Cell–Substrate Impedance Sensing (ECIS) as a
Noninvasive Means to Monitor the Kinetics of Cell
Spreading to Artificial Surfaces. Experimental Cell
Research, 259 (1), 158–166.
Yin, H., Wang, F. L., Wang, A. L., Cheng, J., & Zhou, Y.
(2007). Bioelectrical Impedance Assay to Monitor
Changes in Aspirin‐Treated Human Colon Cancer HT‐
29 Cell Shape during Apoptosis. Analytical Letters, 40
(1), 85–94.
Stolwijk, J. A., Hartmann, C., Balani, P., Albermann, S.,
Keese, C. R., Giaever, I., & Wegener, J. (2011).
Impedance analysis of adherent cells after in situ
electroporation: Non-invasive monitoring during
intracellular manipulations. Biosensors and
Bioelectronics, 26 (12), 4720–4727.
Hildebrandt, C., Büth, H., Cho, S., Impidjati, & Thielecke,
H. (2010). Detection of the osteogenic differentiation of
mesenchymal stem cells in 2D and 3D cultures by
electrochemical impedance spectroscopy. Journal of
Biotechnology, 148 (1), 83–90.
BIODEVICES 2021 - 14th International Conference on Biomedical Electronics and Devices
120
