
Predicting Malware Attacks using Machine Learning and AutoAI
Mark Sokolov
a
and Nic Herndon
b
East Carolina University, Greenville, NC, U.S.A.
Keywords:
Malware, Kaggle, LGBM, AutoAI, Machine Learning.
Abstract:
Machine learning is one of the fastest-growing fields and its application to cybersecurity is increasing. In
order to protect people from malicious attacks, several machine learning algorithms have been used to predict
them. In addition, with the increase of malware threats in our world, a lot of companies use AutoAI to help
protect their systems. However, when a dataset is large and sparse, conventional machine learning algorithms
and AutoAI don’t generate the best results. In this paper, we propose an Ensemble of Light Gradient Boosted
Machines to predict malware attacks on computing systems. We use a dataset provided by Microsoft to show
that this proposed method achieves an increase in accuracy over AutoAI.
1 INTRODUCTION
Malware is deliberately designed to be hostile, intru-
sive, and aggressive. It seeks to penetrate the system,
inflict damage, partially take over control of some
processes, or completely disable computers, com-
puter systems, networks, tablets, and mobile devices.
Like the human flu virus, it interferes with normal
functioning. The purpose of malware is to make il-
legal profits at others’ expense. Despite the fact that
malware cannot damage system hardware or network
equipment, it can steal, encrypt or delete data, change
functions or take control of computing or network
equipment. In addition, it can monitor computer ac-
tivity without the users’ knowledge.
Malware is commonly used by cyber criminals as
primary attack vectors, and malware proliferation is
thus a significant challenge for security profession-
als to adapt and develop a matching defense mech-
anism. The prediction of malware attacks remains
one of the most challenging problems for industry and
academia. Traditional security solutions can not keep
pace with the ever-evolving threats that cause damage
to critical systems, leading to loss of money, sensitive
information, and reputation. The malware threat con-
tinues to grow along with the drastic rise in the num-
ber of victims due to the growing number of users in
cyberspace, financial gains, seeking increased compu-
tational power for further attacks (botnets), availabil-
ity of malware scripts, etc. Panda Security Company
a
https://orcid.org/0000-0002-2614-9650
b
https://orcid.org/0000-0001-9712-148X
revealed in 2015, that 230,000 new malware attacks
occurred daily (Lou, 2016). It is no longer possible
for traditional signature-based and heuristics-based
technologies to keep pace with malware proliferation
due to the vast quantities of malware. In addition, se-
curity analysts can not perform manual analysis on
every new malware.
One of the big problems facing anti-malware ap-
plications today are the large volumes of data that
need to be analyzed for possible malicious intent.
Each day people generate and capture more than 2.5
quintillion bytes of data. More than 90% of the data
was generated in the last two years and it is approx-
imately 40 Zettabytes or 40 trillion gigabytes (Dobre
and Xhafa, 2014). Microsoft’s real-time anti-malware
detection application runs on 600 million computers
worldwide (Caparas, 2020).
Different machine learning methods have been
proposed to address the problem of predicting mal-
ware attacks. Light Gradient Boosted Machine
(LGBM) is the most popular classification technique
currently used in detecting malware. Some of the
benefits of LGBM are that it is easy to create, easy
to understand, and reduces complexity (Vinayakumar
et al., 2019). In addition, with the increase of mal-
ware threats, a lot of big companies use AutoAI to
help protect their systems. Automated Artificial In-
telligence (AutoAI) is a variant of automated machine
learning technology that automates the entire life cy-
cle of machine learning (Wangoo, 2018). Automation
evaluates a number of tuning choices to obtain the
best possible outcome then ranks model-candidates.
Sokolov, M. and Herndon, N.
Predicting Malware Attacks using Machine Learning and AutoAI.
DOI: 10.5220/0010264902950301
In Proceedings of the 10th International Conference on Pattern Recognition Applications and Methods (ICPRAM 2021), pages 295-301
ISBN: 978-989-758-486-2
Copyright
c
2021 by SCITEPRESS – Science and Technology Publications, Lda. All rights reserved
295

The best-performing pipelines can be placed into pro-
duction for processing new data and generating pre-
dictions based on model training (Rauf and Alanazi,
2014). Automated artificial intelligence can also be
implemented to ensure that the model has no inher-
ent bias and automates the tasks for continuous model
development. However, even with the advanced tech-
nology of AutoAI, machine learning experts can, at
times, obtain better results.
We propose a model that achieves an increase in
accuracy over AutoAI on the Microsoft Kaggle’s Mal-
ware Prediction dataset, i.e., the probability of a Win-
dows machine being infected by different malware
families, based on different properties of that ma-
chine. The telemetry data containing these proper-
ties and the system infections were created by com-
bining heartbeat and threat reports collected by Win-
dows Defender, Microsoft’s endpoint protection solu-
tion (Microsoft, 2018). The architecture that we pro-
pose is designed to be able to detect malware without
a lot of computational power, yet with increased ac-
curacy.
2 RELATED WORK
In (LIN, 2019), the authors described a method that
used Na
¨
ıve Transfer Learning approach on Kaggle’s
Microsoft Malware Prediction dataset. They trained
a Gradient Boosting Machine (GBM) to get a simple
prediction model based on the training data, and then
fine-tuned it to suit the test dataset. The authors tried
to minimize the marginal distribution gap between the
source and target domains, figured out the key fea-
tures for domain adaptation and changed the results
of predictions according to the general statistical reg-
ularities extracted from the training set. They ran a
GBM to collect each feature’s importance ratings, and
then picked 20 of the most important category fea-
tures for further study. This was done to simplify the
problem and reduce the costs of the computation. The
first model used 20 of the most important features,
and achieved an accuracy of 63.7%. A second model,
in which columns with maximum mean discrepancy
were removed achieved an accuracy of 64.3%.
In (Ren et al., 2018), the authors presented a
lightweight malware detection and mobile categorisa-
tion security framework. They evaluated the method
with malware on Android devices. Because of the
success and openness of the Android platform, it is
constantly under attack. They performed the analysis
on a very large dataset consisting of 184,486 benign
applications and 21,306 malware samples. They ran-
domly divided the dataset into two subsets for training
(80%) and testing (20%), and evaluated five classi-
fiers: k-nearest neighbor (KNN), Ada, random forest
(RF), support vector machine (SVM), and GBM. The
GBM classifier achieved the best accuracy, of 96.8%.
Since the Gradient Booster algorithm outperformed
all other well known algorithms in predicting mal-
ware, we decided to use it on another malware prob-
lem.
In (Rai and Mandoria, 2019), the authors used
classifiers such as XG-Boost and LGBM to detect net-
work intrusion, and evaluated them using the NSL
KDD dataset (Choudhary and Kesswani, 2020). The
dataset is built on 41 features including basic features,
traffic features and content features, and 21 classes
of attack. The authors’ experimental results showed
that Gradient Boosting Decision Tree ensembles like
LGBM, XG-Boost, and the stacked ensemble, outper-
formed linear models and deep neural networks. Sim-
ilar with the previous related work, since ensemble
methods outperformed linear models and a deep neu-
ral network, we would like to evaluate such methods
on a more recent malware problem.
In (Stephan Michaels, 2019), the author proposed
a method for malware prediction. Two models were
trained and evaluated using LGBM. With one method,
the dataset was cleaned and string values encoded.
Afterwards a LightGBM was trained. With the other
method, the preprocessed data from the first model
was extended with new features. Then, important fea-
tures were selected and a LightGBM was trained. Fi-
nally, an average of the predictions of both models
was calculated. We replicated the experiment because
the author did not present results on Microsoft Mal-
ware Prediction data (Microsoft, 2018). We got the
accuracy score of 66.18% which is below our score
but higher than the AutoAI.
In (Onodera, 2019), the author engineered five
features, which were discovered by trying hundreds
of engineered variables to increase Time Split Valida-
tion. Each variable was added to the model one at a
time and validation score was recorded. After every
variable was changed to dtype integer, each variable
was tested one by one to see if making it categorical
increases LGBM validation score. We replicated the
experiment and we got the accuracy score of 64.91%
which is below our score and very similar to the Au-
toAI score.
3 EXPERIMENTAL DESIGN
The goal of our experimental design is to test our
framework on Microsoft Malware Prediction dataset
and compare the results with AutoAI as well as
ICPRAM 2021 - 10th International Conference on Pattern Recognition Applications and Methods
296

(Stephan Michaels, 2019) and (Onodera, 2019). We
conducted three experiments. Experiment A is the
control experiment, in which the whole dataset was
used. In Experiment B, we used LGBM feature ex-
traction to remove less important features and de-
crease the number of columns in the dataset. We
removed the 30 lower-ranked features, and kept the
84 higher-ranked features. We removed features that
have less than 0.5% of importance on the dataset. In
Experiment C, we used Random Forest feature extrac-
tion to select the features. We removed 73 lower-
ranked features and kept the 41 higher-ranked fea-
tures. We removed features that have importance less
than 0.5%. LGBM feature selection was used to re-
move less important columns from the training and
testing sets to improve score. Importance feature of-
fers a score showing how useful or beneficial each
function has been in the construction of the boosted
decision trees within the model. The higher its rela-
tive value, the more an attribute is used to make im-
portant decisions with the decision trees. For each
attribute in the dataset this value is determined di-
rectly, allowing attributes to be listed and compared
with each other.
3.1 Data Source and Format
The experiments were performed using the Microsoft
Malware Prediction dataset, which is publicly avail-
able on Kaggle website (Microsoft, 2018). The
data consists of 4,458,892 malware instances and
4,462,591 benign instances. We used only the
training dataset from the website since the testing
data is unlabelled. The training dataset includes
8,921,483 instances and 83 features. The experi-
ments were run entirely in a Python environment
using the scikit-learn machine learning library (Pe-
dregosa et al., 2011), the LGBM (Ke et al., 2017), and
pandas library (McKinney, 2010) for data manipula-
tion. The following columns, ‘EngineVersion’, ‘Ap-
pVersion’, ‘AvSigVersion’, ‘OsBuildLab’, and ‘Cen-
sus OSVersion’, were split into multiple columns by
using the split function. By doing so, we created a
dataset with 114 features.
3.2 Dataset
Microsoft made these data publicly available to eval-
uate the probability of malware infection on Windows
machines. The dataset contains Microsoft’s Windows
Defender telemetry data and the system’s infection
status, generated by combining heartbeat and threat
reports. This dataset contains 4.04 GB of data and
has two types of variables: numerical columns and
categorical columns (Microsoft, 2018). It includes 27
numerical columns and 56 categorical columns.
3.3 Experiment A
We preprocessed the data, replaced the category vari-
ables with the category codes, and replaced the miss-
ing values in the numerical columns with their me-
dian. Then we converted this to a pandas dataframe.
The data was split into two subsets: 80% for training,
and 20% for testing, and no columns were removed.
Then, we split the training data into five equal sets,
and trained LGBM on each one. Each model was then
used with testing data. We also used these five models
in an ensemble setting, using their majority voting.
3.4 Experiment B
We modified our testing and training data by remov-
ing some of the columns. We used LGBM feature
selection before splitting the data into training and
testing, and removed the features that have less than
0.5% importance. The feature importance provides a
score that indicates how useful or valuable each fea-
ture was in the construction of the boosted decision
trees within the model. The intent here was to se-
lect features that are more important than the others.
There are many attributes in data, some of them may
be irrelevant or partially relevant in predictions. Thus,
if these attributes are kept, they will have a negative
impact on the prediction model.
3.5 Experiment C
We modified both our training and testing datasets to
remove even more columns. We used the random
forest feature selection before splitting the data into
training and testing, and removed the features that
have less than 0.5% importance. LGBM was trained
on training data and used to predict testing data. The
intent here was to clean as much data as we could to
help LGBM to get higher accuracy. However, it led to
the opposite effect as shown in the in Table 1.
3.6 AutoAI
We also tested this dataset with AutoAI. We evalu-
ated four of the most popular AutoAIs: AutoAI from
IBM Watson Studio, Auto-sklearn, hyperopt-sklearn,
and TPOT. We performed LGBM(100,000) and Au-
toAI with the same 100,000 instances for both ex-
periments. All AutoAI models randomly divided the
dataset into two subsets for training (80%) and test-
ing (20%). We compared these models with LGBM
Predicting Malware Attacks using Machine Learning and AutoAI
297

Table 1: Accuracy, precision, recall and F1 score for Experiment A (no column removed), Experiment B (30 columns were
removed), and Experiment C (73 columns were removed). We evaluated these datasets with three different models: LGBM,
na
¨
ıve Bayes (NB), and logistic regression (LR), on five different folds, and ensemble of LGBMs, NBs, and LRs, respectively.
The highest values are shown in bold font. Notice that naive Bayes and logistic regression performed slightly better than
random. Also notice that ensemble performed better than individual models for LGBM, whereas for naive Bayes and logistic
regression ensemble performed worse than individual models. For the latter two, we assume that the ensemble performed
worse due to the poor performance of the individual models.
LGBM NB LR
Fold 1 Fold 2 Fold 3 Fold 4 Fold 5 Ens. Fold 1 Fold 2 Fold 3 Fold 4 Fold 5 Ens. Fold 1 Fold 2 Fold 3 Fold 4 Fold 5 Ens.
Acc
A 67.03 67.29 67.12 67.31 67.18 69.03 50.00 52.64 52.12 52.89 52.52 52.67 51.35 50.69 50.84 52.80 52.66 52.02
B 67.07 67.18 67.20 67.09 67.11 68.78 52.53 53.00 52.59 52.48 52.51 52.51 50.03 50.38 50.42 50.98 52.67 50.42
C 66.58 66.42 66.49 66.77 66.71 67.53 52.44 53.47 50.11 52.12 52.33 52.52 50.83 51.09 50.88 50.76 50.78 50.89
P
A 67.07 67.27 67.18 67.28 67.26 69.01 50.56 52.52 53.02 53.52 52.58 52.63 51.35 51.32 51.03 53.08 53.15 52.34
B 66.82 67.14 67.36 67.02 67.13 68.64 53.31 53.41 53.05 53.49 53.46 53.21 66.34 55.49 54.01 55.21 53.31 54.00
C 66.55 66.46 66.38 66.86 66.78 67.57 53.00 52.56 52.78 53.46 52.19 53.11 50.76 51.03 50.65 50.38 50.88 50.88
R
A 67.70 68.03 67.97 68.12 68.11 69.88 50.45 52.64 52.08 53.61 53.02 53.12 51.02 51.43 51.05 53.13 53.44 52.19
B 67.27 67.51 67.70 67.58 67.67 69.07 53.15 53.35 53.47 53.86 53.33 53.15 50.42 50.00 50.11 51.34 53.03 50.11
C 67.00 66.76 66.86 67.01 67.34 68.06 52.55 53.56 53.11 53.49 53.00 53.40 50.11 49.88 49.98 50.46 50.15 50.24
F1
A 67.58 67.82 67.77 67.92 67.91 69.63 33.01 53.12 48.87 51.35 52.14 53.13 51.78 51.20 51.37 52.99 53.04 51.03
B 67.09 67.27 67.46 67.28 67.47 68.77 52.30 53.00 51.22 52.48 52.01 52.26 33.12 36.02 37.36 37.43 52.51 35.87
C 66.71 66.58 66.65 66.70 67.09 67.80 52.01 51.59 52.37 53.09 52.00 52.36 49.68 49.48 48.46 49.43 48.54 48.46
using 100,000 instances, since the free version from
IBM limits the size of the data to 100,000 instances.
The results are shown in the Table 2.
3.7 Model and Model Evaluation
Metrics
Each of these models were evaluated using accuracy,
precision, recall, F1 score and confusing matrices. All
the results were collected and shown in Table 1, Ta-
ble 2, Table 3, and Table 4.
4 MACHINE LEARNING
ALGORITHMS USED
4.1 Algorithm
LightGBM (Ke et al., 2017) is a Gradient Boosted De-
cision Trees (GBDT) model. Since traditional GBDT
consumes a lot of time to find the best split, several
approaches have been suggested to reduce overhead
efficiency. One can downsample the data, for exam-
ple, to reduce the size of the training data. However,
this requires native weights and can not be applied
directly to GBDT. Similarly, decreasing the num-
ber of features could be one solution, but can have
an impact on accuracy. LightGBM uses two tech-
niques, called Gradient-based One-Side Sampling
(GOSS) that reduces data size, and Exclusive Feature
Bundling (EFB) that reduces the number of features
using histogram-based algorithms rather than finding
the best split point to solve the GBDT problem.
GOSS keeps all instances with large gradients and
conducts random sampling with small gradients on
the instances. In order to compensate for the data
distribution impact, GOSS introduces a constant mul-
tiplier for data instances with small gradients when
calculating the information gain. Specifically, GOSS
first sorts the data instances according to their gradi-
ent’s absolute value and selects the top instances. By
doing so, without modifying the original data distri-
bution by much, this method puts more focus on the
under-trained instances.
Exclusive Feature Bundling is helping to reduce
the number of features without loss of much informa-
tion. The sparsity of the function space creates the op-
portunity to design an approach that is almost lossless
in order to reduce the number of features. In particu-
lar, many features are mutually exclusive in a sparse
feature space, i.e., they never take non-zero values si-
multaneously. Exclusive Feature Bundling can bundle
exclusive features securely into a single feature.
We set the same parameters for all our methods
to be able to compare results. Below are the list and
description of the hyperparameters involved (Ke et al.,
2017):
• Maximum number of leaves in one tree
(num leaves): 250.
• Number of boosted trees to fit (n estimators):
6,000.
• Boosting learning rate (learning rate): 0.02.
• How much data to allow in leaves
(min data in leaf): 42.
• Number of features selected in each iteration (fea-
ture fraction): 0.8.
• Frequency for bagging (bagging freq): 5.
• How much data to select without resampling (bag-
ging fraction): 0.8.
• Random seed for bagging (bagging seed): 11.
• Maximum tree depth for base learners
(max depth): -1.
ICPRAM 2021 - 10th International Conference on Pattern Recognition Applications and Methods
298

Table 2: Accuracy, precision, recall and F1 score for AutoAI using 100,000 instances: IBM Watson used LGBM, Auto-sklearn
used LGBM, Hyperopt-sklearn used Gradient Booster, and TPOT used XGBoost. Out of the AutoAIs evaluated, IBM Watson
performed best (shown in italic font). We compared these results with LGBM with 100,000 instances, since the free version
of IBM Watson limits the size of the training data to 100,000 instances. LGBM performed better than all AutoAIs (shown in
bold font), yet not as good as the ensemble of LGBMs, shown in Table 1.
IBM Watson (LGBM) Auto-sklearn (LGBM) Hyperopt-sklearn (Gradient Booster) TPOT (XGBoost) LGBM (100,000)
Acc 64.40 64.02 62.37 57.89 67.01
P 64.43 64.03 62.17 57.95 67.02
R 65.10 64.78 62.63 58.52 67.21
F1 64.83 64.54 62.32 58.10 67.09
Table 3: Accuracy, precision, recall and F1 score for
LGBM, the model proposed by Onodera (replicated experi-
ment), and the model proposed by Stephan Michaels (repli-
cated experiment), using all data. LGBM, shown in bold
font, performed better than the other two models, yet not as
good as the ensemble of LGBMs, shown in Table 1.
LGBM Onodera Stephan Michaels
Acc 67.99 64.91 66.18
P 67.97 64.93 66.19
R 67.98 65.61 66.94
F1 67.78 65.57 66.73
4.2 Evaluation Metrics
4.2.1 Confusion Matrix
The confusion matrix shows the number of instances
correctly classified as positive (or benigns in the case
of malware classification, TP = true positive), the
number of instances correctly classified as negative
(or malware in the case of malware classification,
TN = true negative), the number of positive instances
classified as negative (or benigns classified as mal-
ware, FN = false negative), and the number of nega-
tive instances classified as positive (or malware clas-
sified as benigns, FP = false positive).
4.2.2 Accuracy
Accuracy is the ratio of correctly classified instances
to all instances classified. In other words, it indicates
how many of the instances classified have been as-
signed the correct label.
ACC =
TP + TN
TP + TN + FP + FN
4.2.3 Precision
Precision is the ratio of TP to TP + FP. In other words,
how many computers classified as malware attacked,
are actually attacked.
P =
TP
TP + FP
4.2.4 Recall
Recall is the ratio of the number of malware found
to the total number of malware in the test set. In
other words, out of all malware in the test dataset (TP
+ FN), how many of them are correctly classified as
malware (TP).
R =
TP
TP + FN
4.2.5 F1 Score
F1-score is defined as the weighted harmonic mean of
precision and recall. In other words, it measures the
effectiveness of retrieval with respect to the number
of times the recall is more important than precision.
F
1
= 2 ·
P · R
P + R
=
2 · TP
2 · TP + FP + FN
5 RESULTS AND DISCUSSION
LGBM achieved the highest accuracy when no
columns were removed, regardless of evaluation met-
rics used – accuracy, precision, recall, and F1 score –
as shown in Table 1.
We replicated the experiment (Stephan Michaels,
2019) because the author did not present results on
these data. We got the accuracy score of 66.18%
which is below our score but higher than the Au-
toAI. Also, we replicated another experiment (On-
odera, 2019) that was not evaluated on these data. We
got the accuracy score of 64.9% which is below our
score and very similar to the AutoAI score as shown
in Table 3.
Experiment A, B and C show that removing fea-
tures from the dataset is not a good strategy for this
particular problem, as shown in the Table 1. IBM
Watson is limited to 100,000 instances per experiment
so we used the same data for LGBM (100,000). As
shown in Table 2, we were able to outperforme IBM
Watson.
Predicting Malware Attacks using Machine Learning and AutoAI
299
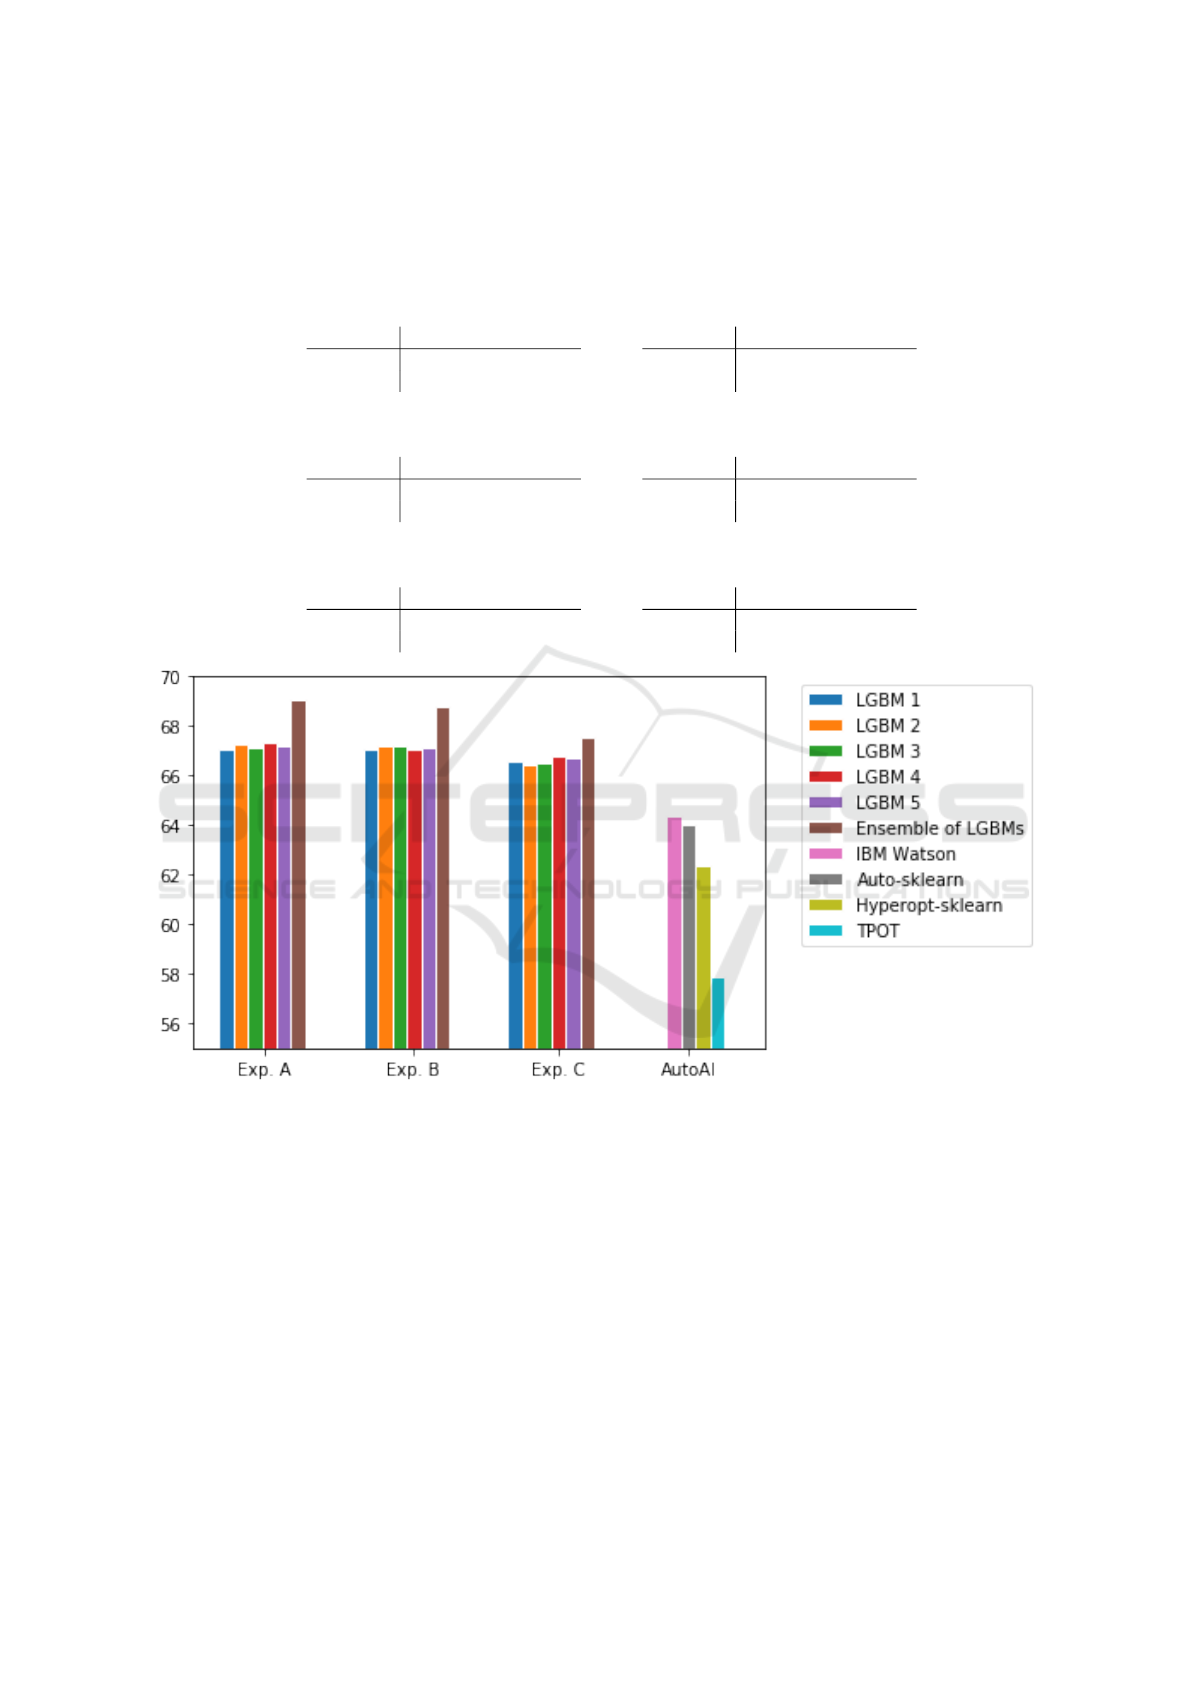
Table 4: Confusion matrices for Experiment A (no column removed), Experiment B (30 columns were removed), Experiment
C (73 columns were removed), IBM Watson used LGBM, LGBM (with entire training set), and LGBM (with 100,000 in-
stances). IBM Watson is limited to 100,000 instances or 100 Mb of data per experiment so we used the same data for LGBM
(100,000). Notice that only ensemble results are included in the table since they show the highest accuracy.
Experiment A Experiment B
Predicted Predicted
Actual
Benign Malware
Actual
Benign Malware
Benign 611,585 281,502 Benign 607,327 285,760
Malware 297,831 594,379 Malware 300,831 590,379
Experiment C IBM Watson
Predicted Predicted
Actual
Benign Malware
Actual
Benign Malware
Benign 604,409 287,974 Benign 6,390 3,604
Malware 306,482 585,432 Malware 3,489 6,517
LGBM (Entire Training Set) LGBM (100,000)
Predicted Predicted
Actual
Benign Malware
Actual
Benign Malware
Benign 605,174 286,717 Benign 6,585 3,415
Malware 303,612 588,794 Malware 3,739 6,261
Figure 1: Accuracy chart for Experiment A (no column removed), Experiment B (30 columns were removed), Experiment C
(73 columns were removed), IBM Watson used LGBM, Auto-sklearn used LGBM, Hyperopt-sklearn used Gradient Booster,
and TPOT used XGBoost. Notice that Ensemble outperformed all the AutoAI.
We also compared the ensemble of LGBMs to one
single LGBM model that was trained with the entire
training set. As shown in Table 1 and Table 3, the
ensemble of LGBMs has a better performance than a
single model trained on the whole data.
We also evaluated other models – na
¨
ıve Bayes
and logistic regression – with LGBM. The ensemble
of LGBMs achieved higher accuracy compare than
ensembles of na
¨
ıve Bayes or logistic regression, as
shown in Table 1. Also, na
¨
ıve Bayes and logistic re-
gression ensembles performed worse than individual
models. Our assumption is that these ensembles per-
formed worse due to the poor performance of the in-
dividual models.
We outperformed any well known AI by 4-4.5%,
as shown in Table 2, which shows that machine learn-
ing scientists and data engineers could get better re-
sults and save more computers from malware attacks.
4-4.5% does not seem a lot, but it is around 416,000
computers that could be saved from malware attack.
Figure 1 shows visually the comparison between en-
semble of LGBMs and AutoAI models.
ICPRAM 2021 - 10th International Conference on Pattern Recognition Applications and Methods
300

6 CONCLUSION AND FUTURE
WORK
In this study, we used gradient boosting decision trees
to predict potential malware attacks on different com-
puters, and compared them to the most common Au-
toAIs. Our system was able to predict malware at-
tacks on Microsoft cloud with higher accuracy than
any well known AutoAI.
In future work we plan to evaluate this approach
with different datasets. In addition, further investiga-
tion is required to understand the effectiveness of en-
semble of LGBMs coupled with more advanced data
processing and feature extraction methods.
REFERENCES
Caparas, M. J. (2020). Threat Protection. docs.microsoft.
com/en-us/windows/security/threat-protection/.
Choudhary, S. and Kesswani, N. (2020). Analysis of kdd-
cup’99, nsl-kdd and unsw-nb15 datasets using deep
learning in iot. Procedia Computer Science, 167:1561
– 1573. International Conference on Computational
Intelligence and Data Science.
Dobre, C. and Xhafa, F. (2014). Intelligent services for Big
Data science. Future Generation Computer Systems,
37:267 – 281. Special Section: Innovative Methods
and Algorithms for Advanced Data-Intensive Com-
puting Special Section: Semantics, Intelligent pro-
cessing and services for big data Special Section: Ad-
vances in Data-Intensive Modelling and Simulation
Special Section: Hybrid Intelligence for Growing In-
ternet and its Applications.
Ke, G., Meng, Q., Finley, T., Wang, T., Chen, W., Ma, W.,
Ye, Q., and Liu, T.-Y. (2017). LightGBM: A Highly
Efficient Gradient Boosting Decision Tree. In Pro-
ceedings of the 31st International Conference on Neu-
ral Information Processing Systems, NIPS’17, page
3149–3157, Red Hook, NY, USA. Curran Associates
Inc.
LIN, C. (2019). Naive Transfer Learning Approaches for
Suspicious Event Prediction. In 2019 IEEE Inter-
national Conference on Big Data (Big Data), pages
5897–5901.
Lou, R. (2016). PandasLab. pandasecurity.
com/mediacenter/press-releases/
all-recorded-malware-appeared-in-2015/.
McKinney, W. (2010). Data Structures for Statistical Com-
puting in Python . In van der Walt, S. and Millman,
J., editors, Proceedings of the 9th Python in Science
Conference, pages 51 – 56.
Microsoft (2018). Microsoft Malware Prediction. kaggle.
com/c/microsoft-malware-prediction/data.
Onodera, K. (2019). Microsoft Malware Prediction. github.
com/KazukiOnodera/Microsoft-Malware-Prediction.
Pedregosa, F., Varoquaux, G., Gramfort, A., Michel, V.,
Thirion, B., Grisel, O., Blondel, M., Prettenhofer, P.,
Weiss, R., Dubourg, V., Vanderplas, J., Passos, A.,
Cournapeau, D., Brucher, M., Perrot, M., and Duch-
esnay, E. (2011). Scikit-learn: Machine Learning
in Python. Journal of Machine Learning Research,
12:2825–2830.
Rai, M. and Mandoria, H. L. (2019). Network Intrusion
Detection: A comparative study using state-of-the-
art machine learning methods. In 2019 International
Conference on Issues and Challenges in Intelligent
Computing Techniques (ICICT), volume 1, pages 1–
5.
Rauf, A. and Alanazi, M. N. (2014). Using artificial intel-
ligence to automatically test GUI. In 2014 9th Inter-
national Conference on Computer Science Education,
pages 3–5.
Ren, B., Liu, C., Cheng, B., Guo, J., and Junliang, C.
(2018). MobiSentry: Towards Easy and Effective De-
tection of Android Malware on Smartphones. Mobile
Information Systems, 2018:1–14.
Stephan Michaels, F. I. (2019). Microsoft Malware Pre-
diction on Kaggle. github.com/imor-de/microsoft\
malware\ prediction\ kaggle\ 2nd/tree/master/code.
Vinayakumar, R., Alazab, M., Soman, K. P., Poornachan-
dran, P., and Venkatraman, S. (2019). Robust Intelli-
gent Malware Detection Using Deep Learning. IEEE
Access, 7:46717–46738.
Wangoo, D. P. (2018). Artificial Intelligence Techniques in
Software Engineering for Automated Software Reuse
and Design. In 2018 4th International Conference
on Computing Communication and Automation (IC-
CCA), pages 1–4.
Predicting Malware Attacks using Machine Learning and AutoAI
301
