
Empirical and Theoretical Evaluation of USE and OCLE Tools
Carlos Vera-Mejia
a
, Maria Fernanda Granda
b
and Otto Parra
c
Department of Computer Science, Universidad de Cuenca, Av. 12 de Abril s/n, Cuenca, Ecuador
Keywords: Validation, UML, Class Diagram, USE, OCLE, Controlled Experiment.
Abstract: Validating the conceptual model (CM) is a key activity in ensuring software quality and saving costs,
especially when adopting any type of Model-driven Software Engineering methodology, in which standard
modelling languages such as UML and tools support for validation become essential. This paper analyses and
evaluates the main characteristics of the tools to support test-based validation in CMs. For this, two research
approaches were used: (1) an empirical evaluation to compare the effectiveness and fault detection efficiency
in a CM and analyses the level of ease of use of two tools used to validate requirements in UML conceptual
models, and (2) a complementary theoretical analysis. The study focuses on the class diagram, the most
common type of UML diagram, and two tools widely used by the modelling community for test-based
validation: USE and OCLE. Theoretical and empirical comparisons were carried out with the aim of selecting
an appropriate tool to validate UML-based CMs with OCLE achieving a better score.
1 INTRODUCTION
Testing is an essential part of the software
development life cycle (Ayabaca & Moscoso Bernal,
2017) as it allows the software engineer to find
defects, which can have a great impact on the
project’s budget. It is thus very important to detect
and eliminate them in the early stages of the
development process, for example, at the conceptual
model level, especially when Model-Driven Software
Engineering (MDSE) is used.
A conceptual model is an application that
designers want users to understand. There are many
ways to describe a conceptual model (Ayabaca &
Moscoso Bernal, 2017), such as: entity-relationship
diagrams, class diagrams based on the Unified
Modelling language (UML), process diagrams based
on Business Process Model and Notation -BPMN
(OMG, 2018), etc. On the language side, UML is the
de facto standard for modelling software systems.
UML (OMG, 2017) provides several diagrams to
model the structure of a software system, its
architecture and its behaviour.
Several commercial and open source tools to
support UML modelling are available, e.g. MagicDraw,
a
https://orcid.org/0000-0002-2029-2464
b
https://orcid.org/0000-0002-5125-8234
c
https://orcid.org/0000-0003-3004-1025
1
https://modeling-languages.com/uml-tools/
Papyrus, USE, OCLE among many others
1
. Although
each one has different characteristics, all of them offer
a graphic editor to assist in defining the UML models
and facilities to verify the finished model. However, we
believe that a theoretical and empirical comparison is
needed to help select a tool that can validate a UML-
based CM.
The study has two contributions to the current
literature: (1) a theoretical evaluation of two tools that
can be used to execute tests at the level of class
diagrams specified in UML and (2) an empirical and
comparative evaluation using TAM model
(Technology Acceptance Model) (Sauro & Lewis,
2012). We review the state of the art of UML class
diagram validation tools. Two of the most appropriate
tools are selected by analysing main characteristics,
advantages and disadvantages. An empirical and
comparative evaluation of the selected tools is
conducted to compare task oriented metrics such as
effectiveness, efficiency and ease of use of the tools
(Wetzlinger, Auinger, & Dörflinger, 2014).
This paper is organized as follows. Section 2
describes the background and the related work.
Section 3 describes the theoretical comparison of the
selected tools. Section 4 summarizes the experimental
plan of the empirical evaluation, as well as its main
246
Vera-Mejia, C., Granda, M. and Parra, O.
Empirical and Theoretical Evaluation of USE and OCLE Tools.
DOI: 10.5220/0010263102460253
In Proceedings of the 9th International Conference on Model-Driven Engineering and Software Development (MODELSWARD 2021), pages 246-253
ISBN: 978-989-758-487-9
Copyright
c
2021 by SCITEPRESS – Science and Technology Publications, Lda. All rights reserved

results. Section 5 contains the final discussion of the
findings. Section 6 summarizes the threats to validity
and the conclusions and future work are summarized
in Section 7.
2 BACKGROUND AND RELATED
WORK
Software modelling is carried out by humans and so
is prone to defects being introduced in CMs, such as:
(1) missing, (2) inconsistent, (3) incorrect, (4)
redundant, and (5) ambiguous (Granda, 2015). The
number of defects should be minimised to reduce the
impact on software quality through different
verification and validation techniques, including
testing. Validation and Verification consists of
manipulating a CM under controlled conditions to:
(1) verify that it behaves as specified; (2) detect
defects and (3) validate user requirements
(Sommerville, 2011). As requirements validation is
difficult to judge solely by inspecting models, an
executable model is needed to evaluate the CM and
detect any misconceptions expressed in it.
Although, commercial programs are available as
they require a license they are outside the scope of
this work. We also found several tools to manage and
verify CM based on UML class diagrams (e.g., Dia
2
,
Lucidchart
3
, Magic Draw
4
, and Visio
5
, among others),
although they do not support the test-based validation
process, so were not considered in this work
According to (Myers, 2004), testing a program (in
our work, a CM) is trying to make it fail by injecting
defects into the software artefact. According to (Tort,
Olivé, & Sancho, 2011), the tests that can be
performed at the conceptual model level are related to
the verification of: (1) the consistency of a state, (2)
the inconsistency of a state, (3) the occurrence of a
domain event, (4) the non-occurrence of a domain
event, and (5) verifying the content of a state. For
example, to instantiate an object at the model level
and test whether it meets the constraints (i.e. pre-
conditions, post-conditions, and invariants) that are
expected as the objects change state, during the
execution of a test case. In this case, as there are other
failures to be analysed, a tool that allows the
execution of test cases to validate the conceptual
model should be used. This validation is very useful
during the software analysis and design phases, when
it is required to determine at an early stage whether
the CM meets the specified user requirements
2
www.dia-installer.de/
3
www.lucidchart.com/pages/
4
www.nomagic.com/products/magicdraw
5
www.products.office.com/en-in/visio/flowchart-software
(Ayabaca & Moscoso Bernal, 2017). In our study we
used Object Constraint Language (OCL) (OMG,
2013) to include the restrictions in a CM.
(Yu, France, Ray, & Lano, 2007) propose an
approach to automatically generate a sequence of
behavioural snapshots. The constraints on these
snapshot sequences are expressed by the OCL. In this
way modelling behaviour allows designers or
software engineers to use tools like USE
6
and OCLE
7
to analyse behaviour. This study helped us to identify
software that validates CM at the level of UML class
diagrams. Additionally, (Planas & Cabot, 2020),
analysed how modellers build UML models and how
good the modelling tools are to support the task of
obtaining a complete and correct CM based on a
definition of the requirements based on two
programs, one of which is commercial (i.e.
MagicDraw). (Bobkowska & Reszke, 2005) are
considering a set of six programs and focused on
finding the fastest modelling software and the
features that make it more efficient.
The present study adds a new perspective to
previous publications by carrying out an empirical
and comparative evaluation of tools that can be used
to detect defects through the execution of test scripts
on CMs using UML. For this, it focuses on the class
diagram, the most widely used UML diagram
(Dobing & Parsons, 2006), and other open source
modelling tools that automate the execution of test
scripts. To the best of our knowledge, the present
study is the first to analyse the effectiveness,
efficiency and ease of use of UML modelling
software from the point of view of test-based
validations of class diagrams.
3 THEORETICAL ANALYSIS
In this work, we selected USE (UML-based
Specification Environment) and OCLE (Object
Constraint Language Environment) because they
contain a language to write and execute test cases, are
open access, and still have support. Table 1 contains
a summary of the USE and OCLE characteristics.
These include: (a) general characteristics of their
operations; (b) validation options, associated with
their different methods of performing validation
processes; and (c) edition options, or the different
ways of editing a CM and its visualization. These
three groups of characteristics were defined by the
authors as a preliminary step to their evaluation.
6
http://www.db.informatik.uni-bremen.de/projects/ USE-
2.3.1/#overview
7
http://lci.cs.ubbcluj.ro/ocle/overview.htm
Empirical and Theoretical Evaluation of USE and OCLE Tools
247
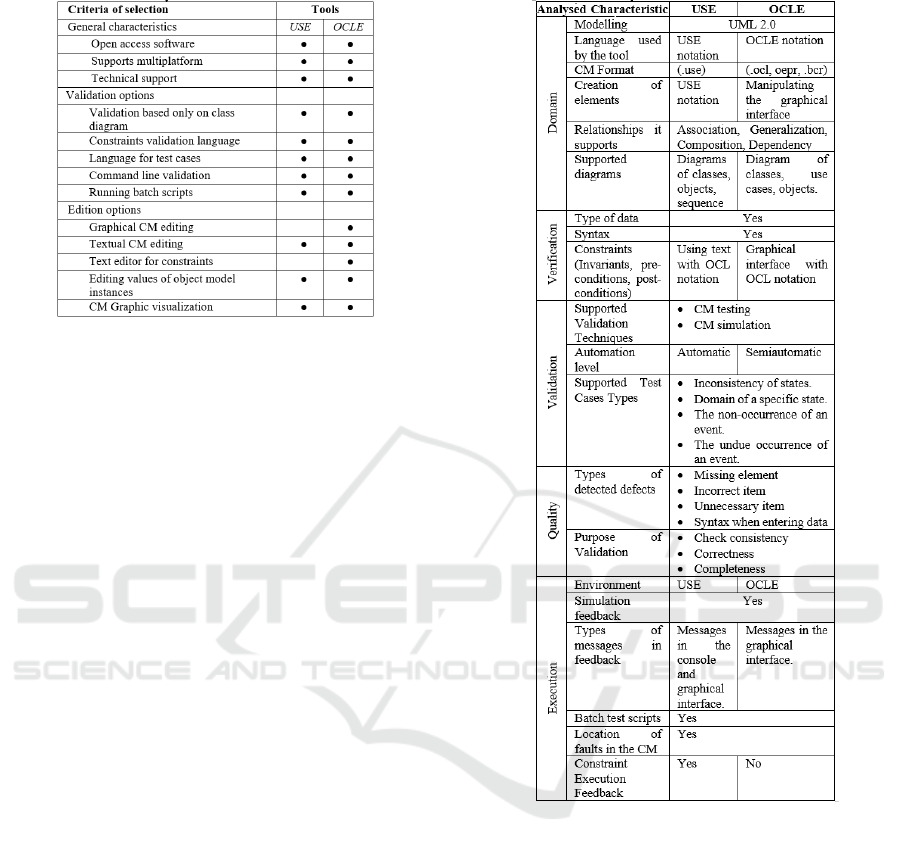
Table 1: Summary of USE and OCLE characteristics.
For the theoretical comparison from the tester
perspective, relevant comparison criteria were
selected by convenience sampling (Etikan, Musa, &
Alkassim, 2016), and grouped as: (i) application
domain, (ii) types of verifications, (iii) types of
validations admitted, (iv) quality in terms of defect
types detected and validation objectives; and, (v) CM
validation environment (see Table 2). Both tools
support UML 2.0, which provides a more extensible
modelling language and allows CM validation and
execution. In USE, the CM is defined in USE code
and the restrictions in OCL and the two languages are
defined in the same file with extension “.use”.
In OCLE, the model is defined in a “.xml” file.
The restrictions are in a file with the extension “.ocl”.
Finally, there is a file with the extension “.oepr”
which contains the CM and the OCLs in a single
project. The relationships between the elements of a
CM that these tools support are based on UML
relationships (association, generalization, etc.).
Modelling at the metamodel level is only supported
by OCLE, and this modelling refers to the creation of
several CMs within of the same project. Both
programs can verify the data type entry both at the
level of attributes, parameters and returned values of
methods, as well as pre-conditions, post-conditions
and invariants. The difference is that USE restrictions
are entered in the project file using a separate text
editor, while in OCLE they can be entered or
modified by its graphic interface.
In the validation process, both USE and OCLE
perform validation techniques through CM tests and
CM simulation by using the object diagram. The CM
analysis in USE is automatic, since the CM is
validated when loading the project, while in OCLE
the CM is analysed after loading. All the classes,
relationships and restrictions are present, but the class
diagram is not displayed, and the diagram must be
created by dragging all the elements to a panel where
you can finally see how the diagram is designed.
Table 2: A technical comparison between selected tools.
We used the types proposed by Tort (Tort et al.,
2011) to analyse the types of test cases supported by
both tools, which were the same in each case. The
quality of CM validation types was analysed.
According to (Aladib, 2014), USE and OCLE detect
the same defects types: missing elements, bad
elements, unnecessary elements, and syntax when
entering data. Both programs aim to verify CM
consistency, correctness and completeness.
When executing the CM, USE presents a window
with the validation results executed, whereas OCLE
displays a drop-down menu of all the CM elements
showing all the validations in the form of messages,
while the elements are being selected from the menu.
For CM simulation feedback, both USE and OCLE
rely on simulating the CM by means of an object
diagram. They also allow batch test execution, i.e. a set
of validations can be executed in a single process. Both
MODELSWARD 2021 - 9th International Conference on Model-Driven Engineering and Software Development
248
programs allow you to locate any defects within the
CM, OCLE indicates defects hierarchically (project
name - object - attribute name - incorrect value), while
USE locates defects directly by displaying the CM
element with a description. Both allow correction of
the elements until obtaining a validated CM.
Based on the analysis carried out, it can be said that
USE and OCLE have similar characteristics in the
selected comparison criteria, with few differences in
terms of functionality and characteristics: (a) each has
its own notation/language, (b) the structure of a USE
project contains a single file, while OCLE is made up
of several types of files, (c) the diagrams supported in
both tools, (d) how to insert the constraints in an CM,
(e) the level of automation that supports validation, (f)
the execution environment, (g) types of messages in
the feedback and, (h) feedback in the execution of the
constraints. The remaining analysed characteristics of
domain, verification, validation, quality and execution
are similar.
4 EMPIRICAL EVALUATION
This section describes the experimental plan, the
environment in which the experiment was carried out,
the procedure used and the data collection and analysis.
4.1 Experimental Planning
The experiment was designed according to (Wohlin
et al., 2012) and reported according to (Juristo &
Moreno, 2001). The goal definition is aligned with
the GQM (Goal/Question/Metric) paradigm (van
Solingen & Berghout, 1999).
4.1.1 Goal
To analyse USE and OCLE, for the purpose of
comparing them in a theoretically and empirically
way, with respect to their effectiveness and
efficiency in detecting faults in CMs and ease of use
when using these tools, from the viewpoint of
researcher, in the context of Computer Science
students interested in validating requirements.
4.1.2 Research Questions
RQ
1
: Is there a significant difference between
the degree of USE and OCLE’s effectiveness in
detecting defects CMs?
RQ
2
: Which of the two tools has a higher
degree of efficiency in detecting the greatest
number of defects in a CMs?
RQ
3
: Is the perception of ease of use impacted
when the subjects are validating the CMs using
the selected tools?
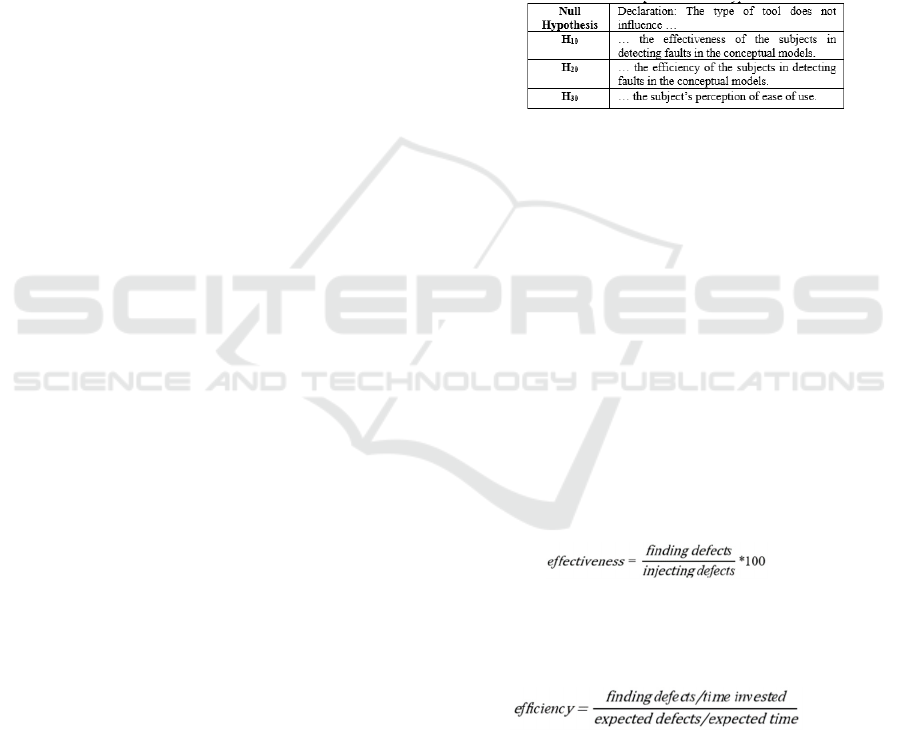
4.1.3 Hypothesis
Three hypotheses were defined (see
Table 3
). The null
hypothesis (represented by the subscript 0) referred to
the absence of an impact of the independent variables
on the dependent variables. The alternative hypothesis
involved the existence of an impact and was the
expected result.
Table 3: Specification of hypothesis.
4.1.4 Variables and Metrics
a) Independent Variables: The validation tool was
considered as an independent variable (Juristo &
Moreno, 2001). This variable can have two values
(also known as treatments (Juristo & Moreno,
2001)): (i) users apply the USE tool, and (ii) users
apply the OCLE tool.
b) Dependent Variables and Metrics: The four
dependent variables (Juristo & Moreno, 2001) are:
• Effectiveness in Detecting Defects (Eldh,
Hansson, Punnekkat, Pettersson, & Sundmark,
2006). To investigate RQ
1
it was necessary to
measure the tools’ effectiveness in finding
defects. The result was a percentage that allowed
a comparative assessment, i.e., the lowest two
percentiles, were ineffective, while capacity
improved as it rose to 100%.
(1)
• Efficiency in Detecting Defects (Eldh et al.,
2006). This variable allowed RQ
2
to be
investigated and its metric was calculated
according to the following formula:
(2)
The result was a value that allowed the tools to be
evaluated comparatively, considering that the higher
values presented greater efficiency and the lower
values a deficiency (Eldh et al., 2006).
• Ease of Use. The degree to which a participant
considers a validation tool is effortless. This
variable responded to RQ3. To calculate this
metric, the TAM model was considered. We used
Empirical and Theoretical Evaluation of USE and OCLE Tools
249
a 7-point Likert scale to measure ease of use of the
tools, which is the arithmetic mean of this scale.
4.2 Experimental Context
4.2.1 Subjects
The experiment was carried on 18 subjects (2 women
and 16 men) between 18 and 22 years old, all
Computer Science’s students of the University of
Cuenca, with proven experience in conducting tests at
the code level, as well as in the use of modelling
methods and techniques, e.g. UML diagrams.
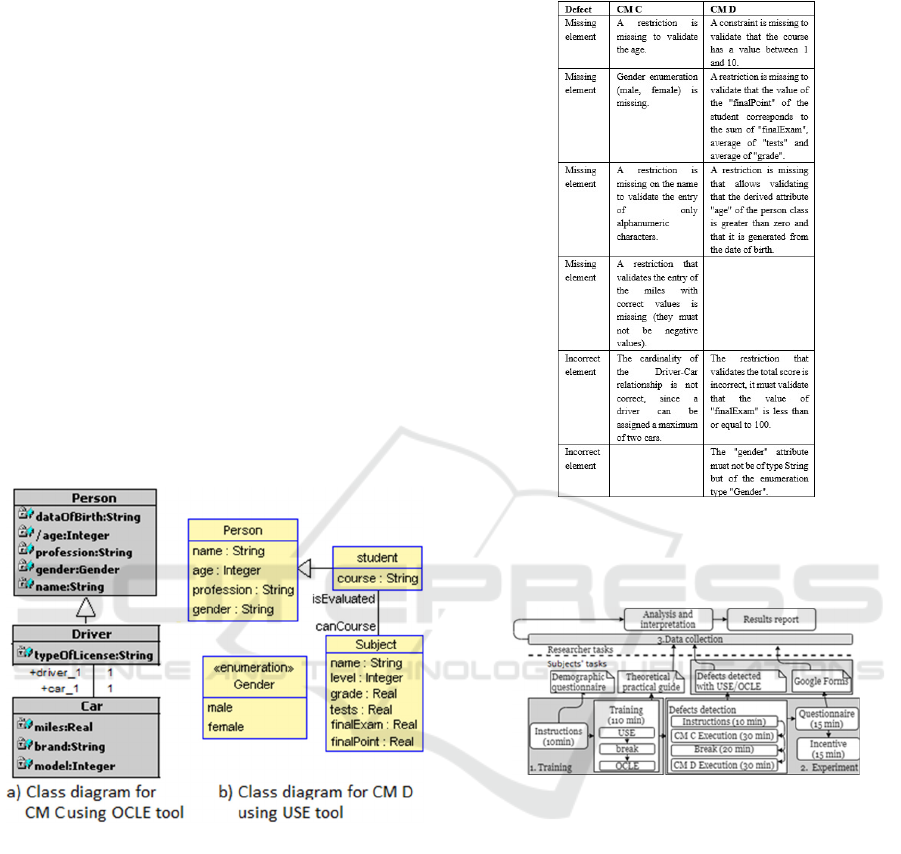
4.2.2 Conceptual Models
Four different conceptual models were used in our
study, two (CM A and CM B) for the training session,
and the other two (CM C and CM D) for the
experimental session with OCLE (
Figure 1
(a)) and
USE (
Figure 1
(b)). The CMs contain a variety of
features in a UML class diagram, including classes,
relationships, and different types of constraints.
Figure 1: Class diagrams of a) CM C and b) CM D.
4.2.3 Failures Injected into CMs
In this paper, we decide to consider five defects which
were injected into each CM used in the experimental
phase, as described in
Table 4
. These defects were
randomly selected from a list of defects previously
obtained from each model. According to a pilot study
which was carried out to validate the experimental
material, the expected average time to detect the five
defects is 3 minutes for each one.
4.3 Experimental Procedure
This section describes in detail the procedures used to
carry out the experiment.
Table 4: Defects in CM C and CM D.
Intensive training sessions were designed to
homogenize the knowledge and experience in the use
of the tools. Figure 2 summarizes the experimental
process, which was divided into the following sessions.
Figure 2: General scheme of the experiment.
4.3.1 Training Session
A general description of the tasks to be carried out
was made, after which the subjects filled out the
demographic questionnaire (ten minutes). Training in
the use of USE by CM A was then given. CM B was
used to train OCLE. During the 2-hour training
session the subjects solved some exercises and
received feedback on their performance.
4.3.2 Experimental Session
This session had an estimated duration of two hours
and was distributed as follows: (i) The subjects were
divided into two groups, the instructions on the
activities to be carried out were given (10 min) in a
document that included the description of each
proposed CM, and it allowed the information on the
MODELSWARD 2021 - 9th International Conference on Model-Driven Engineering and Software Development
250
defects found by the subjects to be recorded
(description of the defect, defect found, defect
corrected, initial and final times). During the defect
detection they recorded the time it took to find each
defect using a digital clock. The subjects did not
know the number of defects injected into the CMs and
themselves decided when to end the defect analysis;
(ii) the first part of the experiment was carried out (30
min), the first group of subjects used USE, the second
group used OCLE and both used the CM C model
(see
Figure 1
(a)); (iii) a 20 minutes break; (iv) the
second part of the experiment was carried out (30
min) where the first group used OCLE and the second
group used USE with the CM D (see
Figure 1
(b)); (v)
the subjects answered the questionnaire on ease of use
for USE and OCLE (15 min); and, (vi) finally an
incentive was given to the subjects for their
participation in the experiment (15 min).
Additional information about the questionnaire
and the score of each participant, as well as the
injected and detected defects can be accessed on the
site http://t.ly/1mpu.
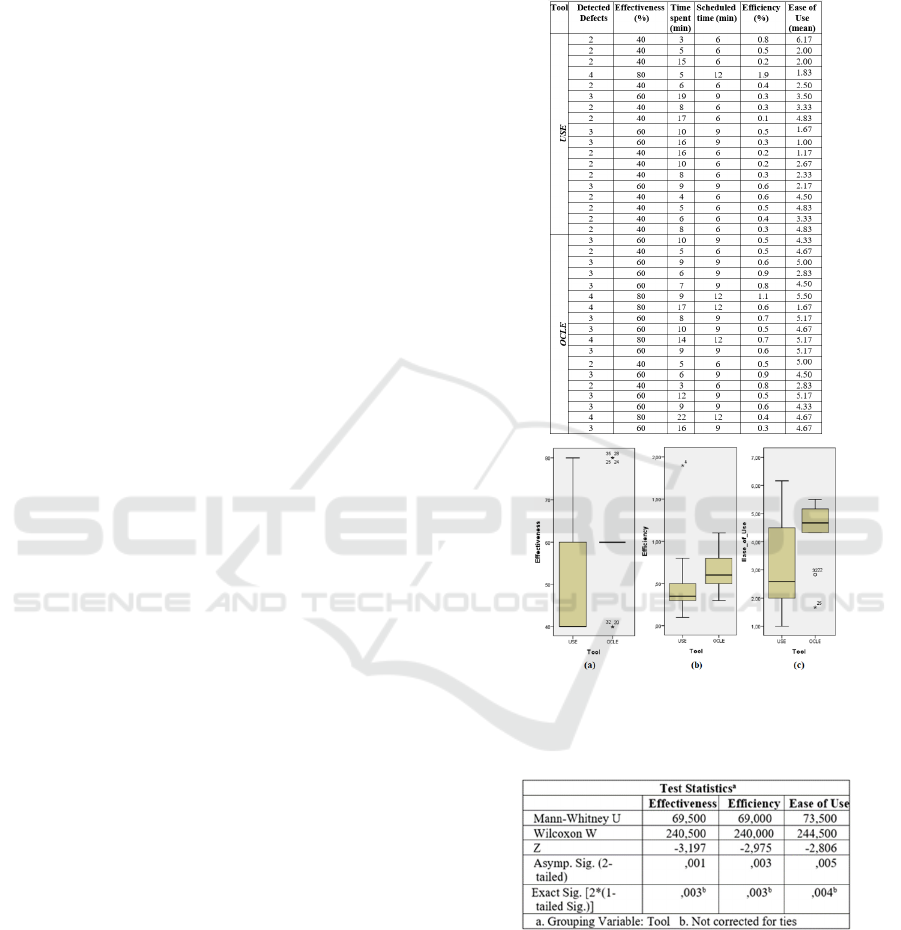
4.4 Analysis and Interpretation of
Result
This section summarizes the results of the evaluation.
Since RQ1 was to evaluate the tools’ effectiveness
in detecting defects, the number of defects found by
each in the different CMs was compared. Table 5
shows those defects detected (Column 2) by each
subject, and the Effectiveness value (Column 3). The
time spent and expected time data (columns 4 and 5)
were used to calculate the detection efficiency
(Column 6). The user satisfaction value is shown in
Column 7. Shapiro-Wilk tests, appropriate for <50
samples, were performed to assess the normality of
the samples.
4.4.1 Defect Detection Effectiveness
These variables did not follow a normal distribution
(<0.05) since the Sig. Values for the Shapiro-Wilk tests
were 0 for USE and 0.001 for OCLE. The data
obtained from both programs was considered in two
independent groups.
The Mann-Whitney U test was used to test our first
null hypothesis (H
10
). Figure 3 (a) shows the box plot
containing data on both programs’ effectiveness in
detecting defects and
Table 6
shows the results of the
Mann-Whitney U test.
It can be seen that the subjects’ effectiveness
differs according to the program used. In this case,
OCLE scored better than USE. We therefore did not
accept the null hypothesis H
10
. In other words, the
effectiveness is different for each tool, U=69.5, 2-
tailed p-value =0.001<0.05.
Table 5: Data collected by tool.
Figure 3: Box Plot for dependent variables per Tool.
Table 6: Values of the Mann-Whitney U Test for dependent
variables per Tool.
4.4.2 Defect Detection Efficiency
As in the previous analysis, all Sig. Values for the
Shapiro-Wilk tests were 0.0 for USE and 0.401 for
OCLE, which means that these variables did not have
a normal distribution (that is, <0.05). Considering
both types of data as independent groups, the non-
parametric Mann-Whitney U test was selected to
evaluate the second null hypothesis (H
20
). Figure 3 (b)
Empirical and Theoretical Evaluation of USE and OCLE Tools
251

shows the box plot containing data on the programs’
efficiency in detecting defects and Table 6 gives the
results of the Mann-Whitney U test. Given that the
detection efficiency is also affected by the type of
tool, OCLE performed better than USE (U = 69.000,
2-tailed p-value = 0.003< 0.05), making hypothesis
H
20
invalid.
4.4.3 Ease of Use
Our objective in RQ
3
was to detect any difference in
the ease of use score between USE and OCLE, for
which the overall score obtained from the 18 subjects
was compared (see
Table 5, Column 7). Figure 3 (c)
shows the box plot of the data collected for the ease
of use score for each tool. As the results show, the
score values gave a better result for OCLE than USE.
As in the previous analysis (RQ
1
and RQ
2
), the
Shapiro-Wilk test was performed on the collected
values. The Sig. Value was 0.218 for USE and 0.001
for OCLE, which means that this variable does not
have a normal distribution (<0.05). Considering both
groups of independent subjects, we selected the
Mann-Whitney U test (non-parametric test) to
evaluate the hypothesis H
30
.
From these data (see
Table 6), it can be concluded
that the OCLE ease of use score was statistically more
significant than that of the USE tool, which means
that we did not accept the null hypothesis H
30
and
concluded that the ease of use perceived by the
subjects was different for each tool; (U = 73.500, 2-
tailed p-value = 0.005 <0.05).
5 FINAL DISCUSSION
In this section, the findings of the empirical
experiment are discussed and interpreted according to
the research questions posed in Section 5.
From the empirical experiment, it was observed
that the effectiveness and efficiency show a
significant difference between both programs. This
difference is related to the mechanism and obstacles
that the subjects encountered when using both tools
(a little more in USE). The difference is due to the
programs’ defects reporting mechanism. USE detects
defects from the messages in its graphical and textual
interface, which takes a little more time, while OCLE
does so only in its graphic interface.
Some subjects highlighted that “the languages used
by the tools are intuitive and easy to use” and some
subjects indicated that "the information provided by
the tools was useful to distinguish the type of defect
and locate it in the CM". Through the analysis of the
TAM model, it was determined that OCLE presents
better results in terms of ease of use when used to
validate MCs. This could have been due to the different
facilities or the steps required for the process.
Therefore, from these results we can conclude that
OCLE is better than USE in defects detection in terms
of efficiency, efficacy and ease of use.
Regarding the practical implications and
applicability for model-driven practitioners, we
consider it important to emphasize the use of best
practices in conceptual modelling, such as those
detailed in (Kuzniarz & Staron, 2005). It should also
be remembered that some elements in a class diagram
must be created in a specific order even if only for
pragmatic reasons.
6 THREATS TO VALIDITY
Regarding internal validity, our threats are mainly
associated with the subjects and measurements. First,
the subjects in our experiment might have had
different prior knowledge of the tools before the
experiment (in the demographic questionnaire we
explicitly asked for this information and all claimed
they were unfamiliar with the tools), so we tried to
minimize this threat by training to homogenize their
knowledge and experience. Second, in order to
guarantee identical conditions for the experiment, all
the computers had the same operational conditions,
material, and MCs with equal complexity.
Regarding external validity, our threats are related
to the selection of modelling tools (OCLE and USE),
since they can have particular characteristics that
influence the time required for the detection of
defects. This threat was mitigated by selecting tools
with similar features and functionality. However, the
results of this experiment should not be generalized
to the modelling tools population were considered. In
future work we plan to replicate this study
incorporating commercial tools. Despite the fact that
the experiment was performed in an academic
context, the results could be representative with
regard to novice testers with no experience in CM
validations. With respect to the use of students as
experimental subjects, several authors suggest that
the results can be generalised to industrial
practitioners (Runeson, 2003).
Conclusion validity threats were mitigated by the
design of the experiment. We took a group of 18
students as a sample from the Systems Engineering
course. Furthermore, adequate tests were performed
to statistically reject the null hypothesis. The metrics
used allowed us to objectively evaluate the subjects’
effectiveness, efficiency and ease of use. As the
validity of the conclusion could be affected by the
number of observations, additional replicates with a
larger data set will be required to confirm or
MODELSWARD 2021 - 9th International Conference on Model-Driven Engineering and Software Development
252

contradict the results obtained. The ease of use
questionnaire was designed using standard questions
and scales that have been shown to be highly reliable.
7 CONCLUSIONS AND FUTURE
WORK
Two research approaches were used to compare CM
validation tools based on UML class diagrams. First,
a theoretical analysis of the characteristics of these
tools was carried out using several criteria, i.e., they
had to be free license tools that support the creation
and execution of CM validation test cases. The
second research approach was to conduct an
empirical evaluation to compare the effectiveness,
efficiency and ease of use perceived by USE and
OCLE users.
The experimental evaluation reported notable
differences in the programs’ effectiveness, efficiency
and ease of use with OCLE achieving a better score.
As a future work, we plan to extend this study
considering other UML modelling tools (including
commercial tools) and also integrating other UML
diagrams to represent a conceptual model (e.g.,
activity, sequence), to see whether the results of this
study can be generalized. Finally, we intend to
implement a new validation tool that combines the
most outstanding functions of the different tools
analysed and solve any deficiencies found in them.
ACKNOWLEDGMENTS
This work has been supported by the Dirección de
Investigación de la Universidad de Cuenca (DIUC) –
Ecuador.
REFERENCES
Aladib, L. (2014). CASE STUDY Object Constraints
Language ( OCL ) Tools.
https://doi.org/10.13140/RG.2.1.4026.7927
Ayabaca, L. P., & Moscoso Bernal, S. (2017). Verificación y
Validación de Software. Killkana Técnica, 1(3), 25–32.
Bobkowska, A., & Reszke, K. (2005). Usability of UML
Modeling Tools. In Software engineering: evolution
and emerging technologies (Vol. 130, pp. 75–86).
Netherlands.
Dobing, B., & Parsons, J. (2006). How UML is used.
Communications of the ACM, 49(5), 109–113.
https://doi.org/10.1145/1125944.1125949
Eldh, S., Hansson, H., Punnekkat, S., Pettersson, A., &
Sundmark, D. (2006). A framework for comparing
efficiency, effectiveness and applicability of software
testing techniques. In Testing: Academic & Industrial
Conference - Practice And Research Techniques (TAIC
PART’06) (pp. 159–170). Windsor.
Etikan, I., Musa, S. A., & Alkassim, R. S. (2016).
Comparison of Convenience Sampling and Purposive
Sampling. American Journal of Theoretical and
Applied Statistics, 5(1).
Granda, M. F. (2015). What do we know about the Defect
Types detected in Conceptual Models ? In IEEE 9th Int.
Conference on Research Challenges in Information
Science (RCIS) (pp. 96–107). Athens, Greece.
Juristo, N., & Moreno, A. M. (2001). Basics of Software
Engineering Experimentation.
Kuzniarz, L., & Staron, M. (2005). Best Practices for
Teaching UML Based Software. In MoDELS 2005
Workshops (pp. 320–332).
Myers, G. J. (2004). The Art of Software Testing. New
Jersey, USA: John Wiley and Sons.
OMG. (2013). Object Constraint Language (OCL).
https://doi.org/10.1145/1921532.1921543
OMG. (2017). Unified Modeling Language. Retrieved from
https://www.omg.org/spec/UML/About-UML/
OMG. (2018). Business Process Model and Notation
BPMN. Retrieved from
https://www.omg.org/spec/BPMN/2.0/About-BPMN/
Planas, E., & Cabot, J. (2020). How are UML class
diagrams built in practice? A usability study of two
UML tools: Magicdraw and Papyrus. Computer
Standards & Interfaces, 67(October 2018), 103363.
Runeson, P. (2003). Using students as experiment subjects–
an analysis on graduate and freshmen student data. In
7th International Conference on Empirical Assessment
& Evaluation in Software Engineering (pp. 95–102).
Sauro, J., & Lewis, J. R. (2012). Quantifying the User
Experience: Practical Statistics for User Research.
Sommerville, I. (2011). Software Engineering. In M.
Horton (Ed.), Software Engineering (9th ed., pp. 41–
42). Boston Columbus.
Tort, A., Olivé, A., & Sancho, M.-R. (2011). An approach
to test-driven development of conceptual schemas.
Data & Knowledge Engineering, 70(12), 1088–1111.
Van Solingen, R., & Berghout, E. (1999). The
Goal/Question/Metric Method-A Practical Guide for
Quality Improvement of Software Development.
McGraw-Hill.
Wetzlinger, W., Auinger, A., & Dörflinger, M. (2014).
Comparing effectiveness, efficiency, ease of use, usability
and user experience when using tablets and laptops. In
International Conference of Design, User Experience, and
Usability (Vol. 8517 LNCS, pp. 402–412).
Wohlin, C., Runeson, P., Höst, M., Ohlsson, M. C., Regnell,
B., & Wesslén, A. (2012). Experimentation in software
engineering. Springer-Verlag Berlin Heidelberg.
Yu, L., France, R. B., Ray, I., & Lano, K. (2007). A light-
weight static approach to analyzing UML behavioral
properties. In 12th IEEE International Conference on
Engineering of Complex Computer Systems (pp. 56–
63). Auckland.
Empirical and Theoretical Evaluation of USE and OCLE Tools
253
