
WICO Graph: A Labeled Dataset of Twitter Subgraphs based on
Conspiracy Theory and 5G-Corona Misinformation Tweets
Daniel Thilo Schroeder
1,2
, Ferdinand Schaal
3
, Petra Filkukova
4 a
, Konstantin Pogorelov
4
and Johannes Langguth
4 b
1
Simula Metropolitan Center for Digital Engineering, Oslo, Norway
2
Technical University of Berlin, Germany
3
Technical University of Denmark, Denmark
4
Simula Research Laboratory, Fornebu, Norway
Keywords:
Graph Neural Networks, Graph Algorithms, Misinformation, Fake-News Detection.
Abstract:
In the wake of the COVID-19 pandemic, a surge of misinformation has flooded social media and other inter-
net channels, and some of it has the potential to cause real-world harm. To counteract this misinformation,
reliably identifying it is a principal problem to be solved. However, the identification of misinformation poses
a formidable challenge for language processing systems since the texts containing misinformation are short,
work with insinuation rather than explicitly stating a false claim, or resemble other postings that deal with the
same topic ironically. Accordingly, for the development of better detection systems, it is not only essential to
use hand-labeled ground truth data and extend the analysis with methods beyond Natural Language Process-
ing to consider the characteristics of the participant’s relationships and the diffusion of misinformation. This
paper presents a novel dataset that deals with a specific piece of misinformation: the idea that the 5G wireless
network is causally connected to the COVID-19 pandemic. We have extracted the subgraphs of 3,000 man-
ually classified Tweets from Twitter’s follower network and distinguished them into three categories. First,
subgraphs of Tweets that propagate the specific 5G misinformation, those that spread other conspiracy the-
ories, and Tweets that do neither. We created the WICO (Wireless Networks and Coronavirus Conspiracy)
dataset to support experts in machine learning experts, graph processing, and related fields in studying the
spread of misinformation. Furthermore, we provide a series of baseline experiments using both Graph Neural
Networks and other established classifiers that use simple graph metrics as features. The dataset is available
at https://datasets.simula.no/wico-graph..
1 INTRODUCTION
In large parts of the world, the COVID-19 pandemic
is likely the most impactful event for decades, and
it has posed unprecedented challenges for affected
countries and their governments. Consequently, cov-
erage of the pandemic has dominated international
news for months. At the same time, such mas-
sive amounts of misinformation have circulated on-
line that the term “infodemic” was coined to describe
the phenomenon(Ali and Kurasawa, 2020; Ghebreye-
sus and Ng, 2020). It is widely suspected that some
of it is disinformation specifically targeted at west-
ern democracies(European External Action Service
a
https://orcid.org/0000-0003-4256-4501
b
https://orcid.org/0000-0003-4200-511X
(EEAS), 2020). Whether created intentionally or
by mistake, the misinformation has had severe con-
sequences. For example, in January 2020, when
COVID-19 was still restricted to Wuhan, China, the
first Tweet linking the outbreak to 5G wireless tech-
nology appeared on Twitter. While these Tweets got
a little initial reaction, about ten weeks later, in early
April, a series of arson attacks hit 5G cell towers in
the UK and other countries. Thus, seemingly incon-
sequential misinformation had become a digital wild-
fire. Digital wildfires, i.e., fast-spreading and inaccu-
rate, counterfactual, or intentionally misleading infor-
mation that quickly permeates public consciousness
and has severe real-world implications, have been
placed among the top global risks in the 21st cen-
tury by the World Economic Forum(Howell, 2013).
While a sheer endless amount of misinformation ex-
Schroeder, D., Schaal, F., Filkukova, P., Pogorelov, K. and Langguth, J.
WICO Graph: A Labeled Dataset of Twitter Subgraphs based on Conspiracy Theory and 5G-Corona Misinformation Tweets.
DOI: 10.5220/0010262802570266
In Proceedings of the 13th International Conference on Agents and Artificial Intelligence (ICAART 2021) - Volume 2, pages 257-266
ISBN: 978-989-758-484-8
Copyright
c
2021 by SCITEPRESS – Science and Technology Publications, Lda. All rights reserved
257

ists on the internet, only a small fraction of it spreads
far and affects people to a degree where they commit
harmful or criminal acts in the real world. Thus, de-
tecting such digital wildfires with the aim of provid-
ing factual information to counter the misinformation
is an important goal. However, due to the vast vol-
ume of social media postings, with 500 million daily
tweets on Twitter alone, manual oversight is impossi-
ble. Thus, it is necessary to devise systems that can
automatically detect misinformation narratives.
Typically, developing such systems requires large
amounts of labeled input data. Hence, this contri-
bution aims to provide such data, along with human
annotations concerning the contents of the tweets.
A wide variety of technical approaches to the prob-
lem, which is often referred to as fake news detec-
tion, have been developed over the past years(de Beer
and Matthee, 2020). Depending on the chosen ap-
proach, different data is required. This paper presents
a dataset for graph-based detection methods that rec-
ognize misinformation based on its spreading patterns
or the spreader’s social network.
Our dataset focuses on misinformation related to
COVID-19 and 5G wireless technology. The reason
for this choice was the fact that it developed into a
digital wildfire. Furthermore, the topic contains pre-
dominantly statements such as ”5G radiation causes
corona” that contradict established scientific consen-
sus. Thus, unlike in the case of more political state-
ments, we assume an extensive agreement w.r.t. what
we labeled as misinformation.
We obtained the data using Twitter’s search API
by looking for Tweets containing 5G, Corona, and re-
lated terms. The dataset consists of 3,492 subgraphs
of Twitter’s follower network. We labeled each sub-
graph as belonging to three classes: promoting 5G
conspiracy, promoting another conspiracy, and not
promoting conspiracies.
The remainder of the paper describes how the
dataset was collected and according to which crite-
ria the labels were assigned. Furthermore, we in-
troduce the dataset’s general characteristics and pro-
vide baseline classification accuracy, which we ob-
tained via a relatively straightforward application of
graph neural networks, specifically graph isomor-
phism networks(Xu et al., 2018) as well as Random
Forest(Breiman, 2001) and Naive Bayes classification
using graph metrics such as the clustering coefficient
as features.
2 RELATED WORK
The utility of automated fake news detection, as well
as the necessity of labeled datasets that comes with
it, has been widely recognized in the recent past.
A recent survey (de Beer and Matthee, 2020) di-
vides misinformation detection mechanisms into four
categories: language based (Burkhardt, 2017; Yang
et al., 2018), topic agnostic (Horne and Adali, 2017;
Castelo et al., 2019), machine learning based (P
´
erez-
Rosas et al., 2018; Sivasangari et al., 2018), and
knowledge based approaches (Hassan et al., 2017;
Ahmed et al., 2019). The authors recognize that some
approaches transcend these categories and thus clas-
sify them as hybrid. In addition, some approaches to
the problem also aim at clustering fake news into cat-
egories or topics(Zhang et al., 2019; Hosseinimotlagh
and Papalexakis, 2018).
Their categorization does not distinguish between
the different machine learning (ML) methods and as-
sociate learning techniques such as deep learning.
However, the wide variety of the field makes it nec-
essary to further subdivide the category. Modern ap-
proaches to the problem include neural (Le et al.,
2020) and graph attention networks (Cui et al., 2020).
In this work, we are primarily targeting graph-based
approaches that learn the spreading structure of mis-
information rather than trying to identify its contents.
Such methods have also been applied in the closely re-
lated topic of rumor detection (Ma et al., 2019; Huang
et al., 2019).
In addition to the methods, a variety of misinfor-
mation datasets have recently been presented (Wang,
2017; Salem et al., 2019; Dhoju et al., 2019; Dai et al.,
2020; Shu et al., 2018; Ghenai and Mejova, 2018; Cui
and Lee, 2020). Cui and Lee (Cui and Lee, 2020)
give a comprehensive overview over the characteris-
tics of the different datasets. However, these datasets
are focused on contents rather than graph structure.
Datasets for testing graph comparison methods ex-
ist (Kersting et al., 2016), but they are generally not
based on misinformation. Our contribution aims to
close this gap. Some approaches to the problem also
aim at clustering fake news into categories or top-
ics(Zhang et al., 2019; Hosseinimotlagh and Papalex-
akis, 2018).
3 5G CONSPIRACY INSIGHTS
As mentioned in the introduction, the 5G corona con-
spiracy theory refers to a causal relationship between
the 5G mobile phone standard and the COVID-19
virus, reflected in several narratives. For example,
ICAART 2021 - 13th International Conference on Agents and Artificial Intelligence
258
there is the assumption that 5G radiation weakens
the immune system or that the expansion of the 5G
network and the virus allegedly associated with it is
part of a Chinese plan to attack the West. From Jan-
uary 21, 2020, until the end of the month, we could
observe 685 tweets and 1080 retweets distributed si-
multaneously with YouTube videos containing simi-
lar content. During March, the number of tweets grew
rapidly and reached a peak between March 20 and
April 4. The rapid increase is due to our assessment
after distributing a series of videos in the UK con-
taining 5G Corona narratives, which were distributed
from March 25 onwards. In mid to late April, both
Twitter and YouTube have decided not to allow any
content related to any of the narratives that refer to
the 5G corona conspiracy theory.
4 TWITTER IN A NUTSHELL
Twitter is a short message service that enables post-
ing messages of up to 280 characters. Hereafter we
will use the term status as a generic term for all mes-
sages on Twitter. Statuses may be either public or
only available to users in a follower-friend relation-
ship with the author. A status is called a tweet if
it is not directly related to another status. Tweets
are shown to the author’s followers and can be com-
mented on by any other Twitter user. Comments on
Tweets are then called replies. Because every reply it-
self can be commented, it is possible to create nested
structures called threads. Furthermore, both tweets
and replies are shareable. Depending on whether a
status is commented when sharing, the shared sta-
tus is called either a quote or a retweet. Since the
content of a retweet corresponds to the shared status,
the scope of interpretation transmits in equal measure
and, therefore, allows us to understand retweets as a
form of agreement. For each tweet, quotes, and reply,
we build subgraph which contains the status itself and
its retweets. Since it is also possible to retweet a reply,
we treat the reply as both part of the original subgraph
and also the as first status of a new subgraph.
5 DATA COLLECTION
We collected about one billion statuses that included
keywords related to the COVID-19 crisis from Twit-
ter between January 17, 2020 and Mai 15, 2020 using
the fact framework(Schroeder et al., 2019) for Twitter
data collection [Authors blinded]. In a second step,
we selected statuses that mention 5G in any conceiv-
able spelling such as 5G, 5g, or #5g, resulting in a
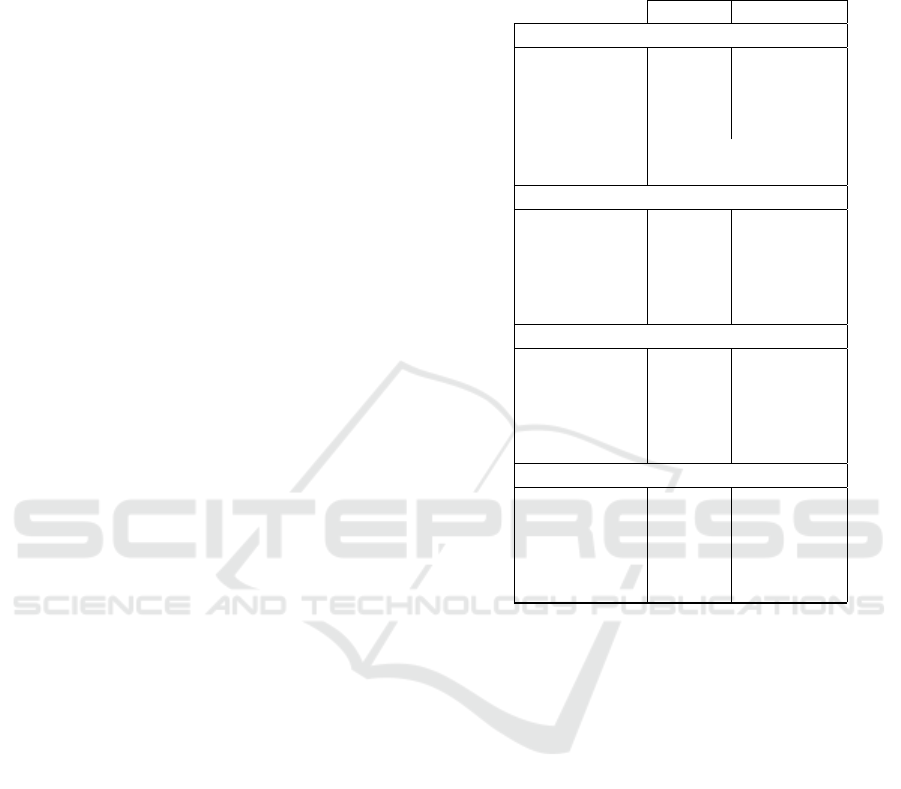
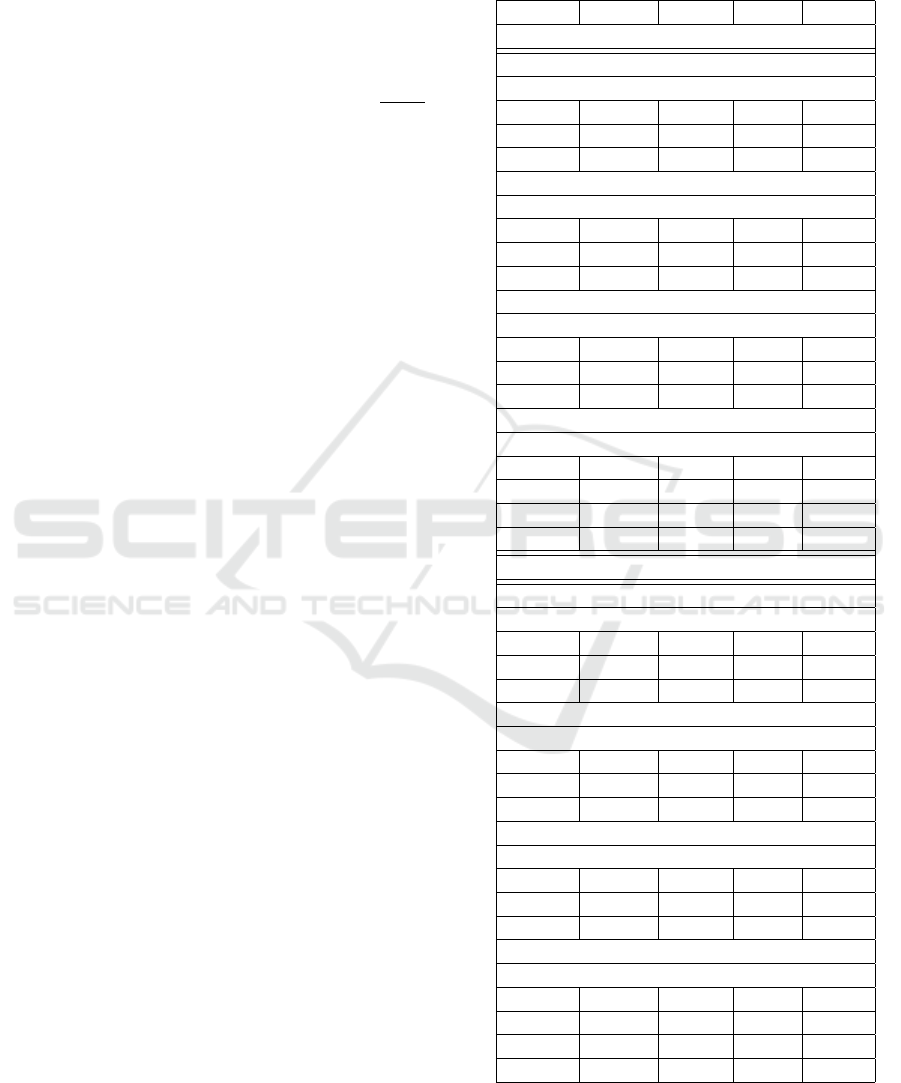
Table 1: The number of statuses ordered by the types (sec-
tion 4). All numbers shown in this table refer to the statuses
after thread recovery. A user can be in more than one cate-
gory simultaneously.
initial selected
Overall
Sources 177498 3492
Retweets 351848 205097
Users 413885 159104
Deleted users 11788 3821
Collection 17/01/2020
Collection 15/05/2020
5G
Sources 406
Retweets 18588
Users 14792
earliest 25/01/2020
latest 08/05/2020
Other
Sources 596
Retweets 32015
Users 38095
earliest 11/06/2012
latest 08/05/2020
Non
Sources 2490
Retweets 154494
Users 128139
earliest 28/03/2014
latest 09/05/2020
set of 364,325 statuses that potentially include text
related to 5G-Corona conspiracy theories. Although
this approach may seem simple, it was very success-
ful in this case since 5G is a specific term with lit-
tle semantics not pointing to the standard for cellu-
lar networks. Furthermore, since all statuses covering
5G-Corona conspiracy theories are of interest and not
only the ones containing a keyword, we restored the
threads that contain the statuses we found using the
text search. However, the Twitter API only allows us
to query parent elements starting from a given status,
so restoring is only feasible for statuses posted earlier
than the ones we found using the text search. Later
parts of the threads cannot be found in this manner.
After completing the threads, the number of can-
didates for statuses related to 5G-Corona conspiracy
theories increased to 801,515. Since sharing a retweet
is the same as sharing the original status, we removed
the retweets before selecting 10,000 tweets randomly
for manual labeling using the classes described in
Section 6. Furthermore, as most tweets that were la-
beled as misinformation had very few retweets, we
identified statuses with associated subgraphs in order
WICO Graph: A Labeled Dataset of Twitter Subgraphs based on Conspiracy Theory and 5G-Corona Misinformation Tweets
259
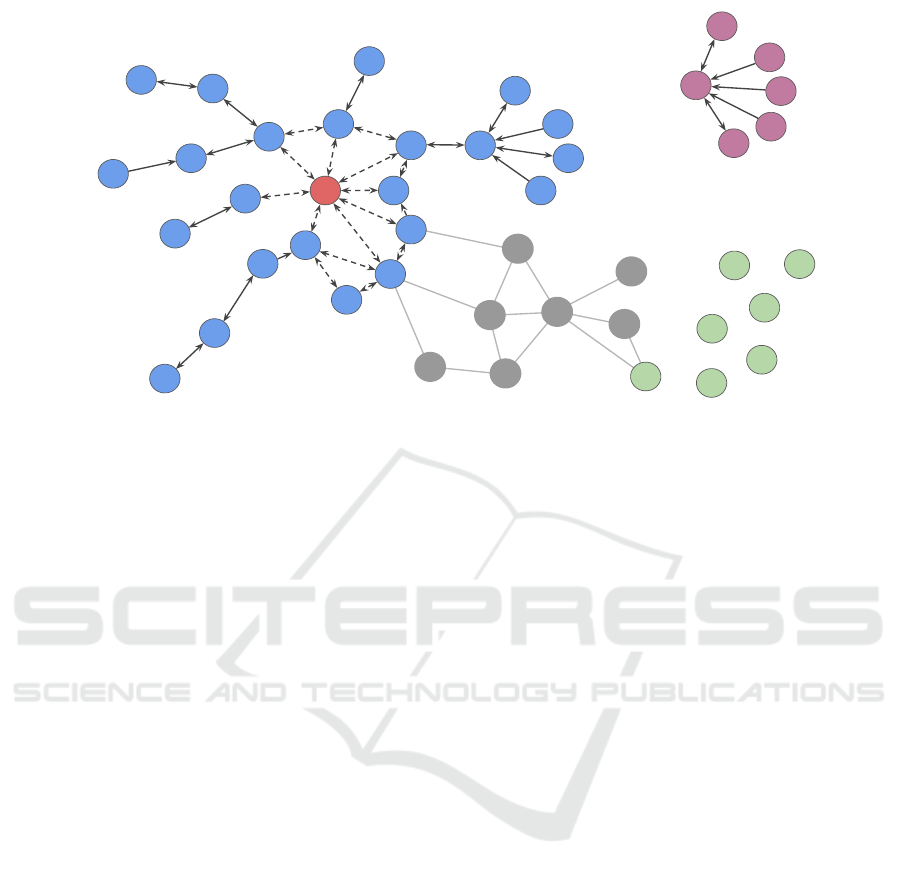
Figure 1: The Figure shows an example of the induced subgraph of a single status where nodes represent Twitter users.
Follower relationships connect to users and can be bidirectional. The red node represents the source status author, while
the purple nodes stage a connected component with no connection to the main component, as discussed in Section 7. This
happens when content propagates outside of the Twitter follower network. Green nodes correspond to users that retweeted
without a path to the source and followers in the subgraph. We assume that both purple and green nodes, as well as their
relationships to either each other or the main component, can be used to distinguish the classes (see Section 6). Beyond that,
the dotted edges mark unclear distribution channels, i.e. it is not clear which edge was responsible for spreading the message.
However, some of these ambiguous edges could be removed with the help of timestamps. Finally, the grey nodes represent
users who were not involved in distributing the status. This implies that even though there is a path from the red to the green
node, information traveled outside the network.
to enhance the dataset. Table 1 lists the number of
statues obtained from each class, along with support-
ing information such as the total number of user ac-
counts in the subgraphs and the number of accounts
that were deleted at the end of the data collection. In-
terestingly over 90% of the deleted users profiles were
created in 2020. Note that the tweets that were posted
before the collection began are a result of restoring
the threads.
6 CLASS LABELING
From the collected data we created a dataset of manu-
ally labeled statuses. The labeling was performed by
a diverse group of staff scientists, postdocs, and grad-
uate students. The primary criterion for our classifica-
tion was the potential spread of misinformation. Our
definition of spreading requires that the author gives
the impression of at least partially believing the pre-
sented misinformation. This includes statements that
present the misinformation as uncertain, e.g., state-
ments such as: ”Does 5G cause COVID-19?” as-
suming there is no additional information marking the
claim as highly unlikely. The rationale for this is that
by presenting such an idea as a valid hypothesis, a
tweet essentially spreads misinformation by implying
that the suggested idea could be considered possible
by established science. On the other hand, we do not
consider statements that merely point out that certain
misinformation exists to be spreading that misinfor-
mation since our focus lies on detecting intentions
contained in the wording. To this end, we classified
statuses into three categories:
5G Conspiracy. This class contains the subgraphs
of statuses that claim or insinuate some more pro-
found connection between COVID-19 and 5G, such
as the idea that 5G weakens the immune system and
thus caused the pandemic, or that there is no pan-
demic and radiation emitted by 5G network towers
harmed the presumed COVID-19 victims. The crucial
requirement is the claimed existence of some causal
link. There are 406 subgraphs in this category.
Other Conspiracy. This class contains the sub-
graphs of statuses that spread conspiracy theories
other than the ones related
to 5G. Such conspiracies include ideas about an inten-
tional release of the virus, forced or harmful vaccina-
tions, or the idea that the virus is a hoax. Because of
the pre-selection explained in Section 5, all these con-
ICAART 2021 - 13th International Conference on Agents and Artificial Intelligence
260
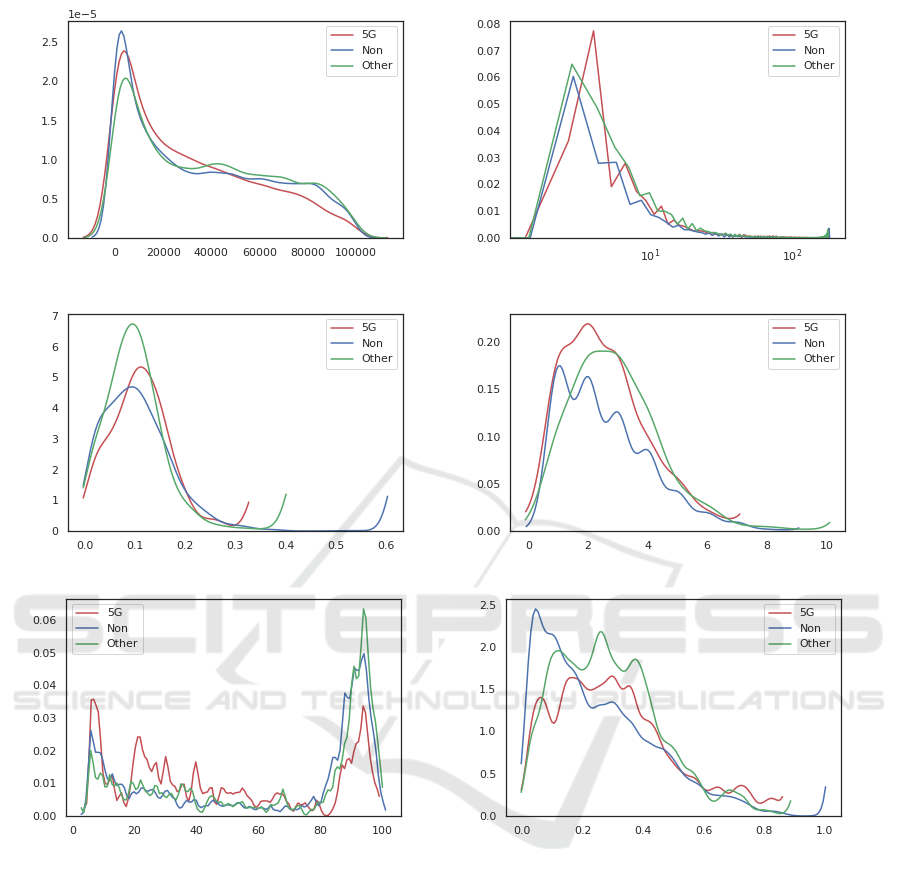
(a) Time difference in seconds (b) Degree Distribution
(c) Global CC (d) Radius
(e) Number of Nodes (f) Average Clustering Coefficient
Figure 2: Basic properties of the subgraphs by class. All key figures that can be seen here are normalized with the density
fuction on the Y-axis.
spiracies were tweets related to the COVID-19 pan-
demic. There are 596 subgraphs in this category.
Non-conspiracy. This class contains the subgraphs
of statuses not belonging to the previous two classes,
including claims that 5G is harmful without linking it
to COVID-19, as well as tweets claiming authorities
are pushing for the installation of 5G the public is dis-
tracted by COVID-19. Also, statuses pointing out the
existence of conspiracy theories or mocking them fall
into this class since they do not spread the conspiracy
theories by inciting people to believe in them. The re-
maining 2490 subgraphs fall into this class, making it
far larger than the other two.
Statuses that were not in English or could other-
wise not be classified were discarded and replaced by
new randomly selected statuses. For each valid status,
we scraped a subgraph of the Twitter graph induced
by the accounts that retweeted it, along with the ac-
count that tweeted the original status.
7 INDUCED SUBGRAPHS
We define the follower graph G
F
= (V, E) as the graph
where V represents the set of all Twitter users and
WICO Graph: A Labeled Dataset of Twitter Subgraphs based on Conspiracy Theory and 5G-Corona Misinformation Tweets
261
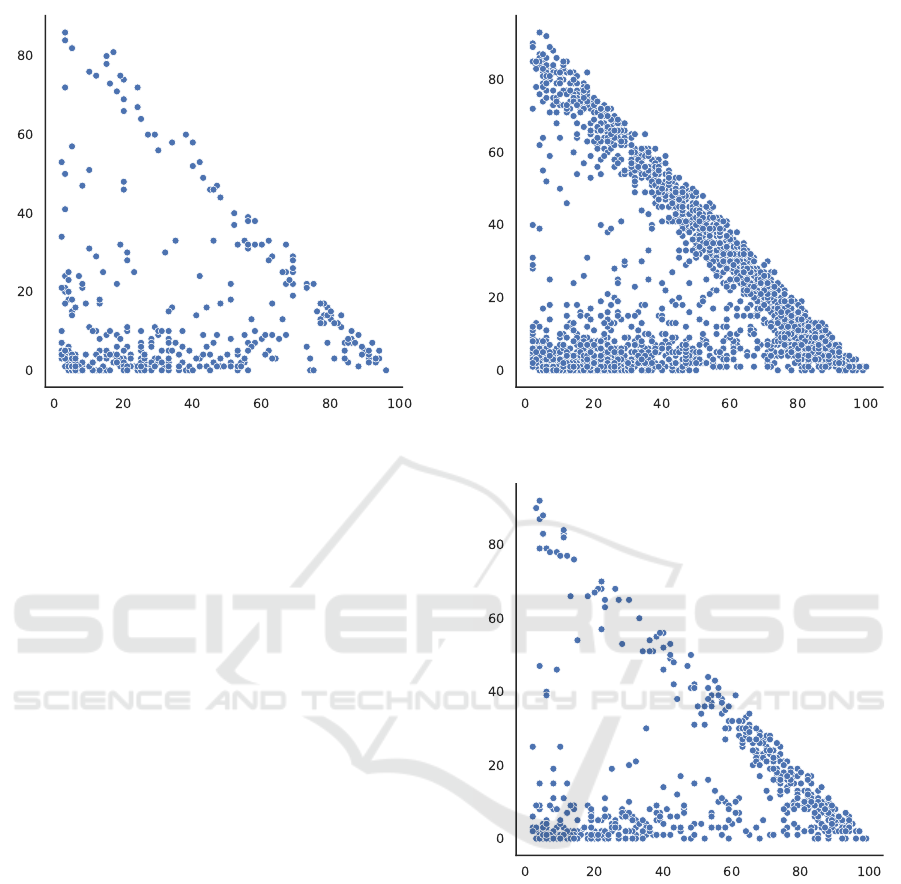
Figure 3: The size of the main component vs. the size of all
other components for the 5G Conspiracy class.
E the total of follower subscriptions. Let T be the
set of statuses. Each status t
i
has an author a
i
∈ V ,
a set of retweeters R
i
⊆ V , and a class label. The
dataset contains the subgraphs of G
F
where each sub-
graph H
i
= (V
i
, E
i
) belongs to a specific status t
i
. Let
V
i
= {a
i
} ∪ R
i
and H
i
= G
F
[V
i
] i.e. each such graph
is the subgraph of G
F
induced by the author and all
retweeters. Note that while the Twitter follower net-
work changes constantly, G
F
is a single, static graph.
Thus, if there is an edge (v
k
, v
l
) between two vertices
in some subgraph H
i
, the same edge exists in all sub-
graphs that contain both vertices. Figure 1 shows an
example of a subgraph derived from a Tweet. For
each element in each set of retweeters R
i
, the dataset
also contains the retweet time as the difference
in seconds from the posting of the original status t
i
.
Thus, the author vertex implicitly has a retweet time
of 0. Note that this time is a property of the tweet,
not the account. A vertex v ∈ V can be contained in
subgraphs and have a different retweet time in each of
them.
Figure 2 shows the basic properties of the sub-
graphs in all three classes. While the difference is
relatively small in most cases, we observe that graphs
not associated with a conspiracy theory tend to be
larger, have lower average degrees, higher cluster-
ing coefficient, and information spreads more slowly
among them. All these measurements indicate that
conspiracy theories are more likely to be shared
among smaller, more densely connected groups of
people, which, to a certain degree, is in line with the
idea of echo chambers (Flaxman et al., 2016).
To further investigate the connectivity between the
Figure 4: The size of the main component vs. the size of all
other components for the Non-Conspiracy class.
Figure 5: The size of the main component vs. the size of all
other components for the Other Conspiracy class.
groups of retweeters, we also plot the size of the
largest connected component in a subgraph against
the number of nodes not in the largest component
for each of the three classes. Results are shown in
Figures 3, 4, and 5. In each plot, the X-axis rep-
resents the number of nodes in the main component
and the Y-axis the number of other nodes in the sub-
graph. Since the subgraphs are limited to 100 nodes,
the number are not percentages. Between the figures,
we observe that the Non-Conspiracy class in Figure
4 contains a larger fraction of points on the diagonal,
i.e. subgraphs with a relatively smaller main compo-
nent. This further supports the observation that con-
ICAART 2021 - 13th International Conference on Agents and Artificial Intelligence
262

spiracy tweets are more likely to spread in highly con-
nected groups than other tweets. This is consistent
with Figure 2c, which shows that the global cluster-
ing coefficient is lower in the same category.
Limitations. An important limitation is that the
Retweet endpoint provided by the Twitter API, and
along with it the size of the graphs, is limited to one
hundred retweets. Thus, we have an accumulation
of graphs having close to one hundred vertices, as
shown in Figure 2e. Another aspect to consider is
that the graphs themselves are distribution graphs,
i.e. subgraphs of the Twitter follower graph. Thus,
they include all follower edges, which do not nec-
essarily represent the pathways via which the infor-
mation spread since this cannot be inferred from the
information available through the Twitter API. How-
ever, the dataset contains the direction of the spread of
information indirectly, via the retweeting times. This
allows excluding edges whose endpoint has a lower
retweet time than the starting vertex.
Moreover, it is essential to note that Twitter’s fol-
lower relation and the associated display of content
on a user’s newsfeed is not the only way content is
distributed. Links to statuses can be shared outside
of Twitter, for example, in news portals or in private
chats. In case the distribution takes place outside of
Twitter, connected components that are separate from
the original status or even isolated nodes are formed
(see Figure 1). We decided to provide these isolated
components since they likely contain information that
contributes to the classification. For methods that as-
sume connected graphs and thus only consider the
main connected component that contains the original
status, they can be removed easily.
8 DATASET STRUCTURE
The dataset will be published as soon as author
anonymity is lifted, using the format described below.
The graphs are located individually in folders that are
numbered in ascending order. Each folder contains
three files. The edges.txt file contains a directed edge
list source-id −→ target-id, the file nodes.csv contains
an assignment from the node id to its properties (see
Table 2), and the plot.png file contains a plot of the
corresponding subgraph.
The number of nodes in the nodes.csv file does
not necessarily match the number of nodes included
in the edges.txt because nodes without any edges are
not contained in the latter. The friends and followers
counts are rounded to the next power of two to pre-
serve anonymity.
Table 2: The list of properties assigned to each sub graph
node.
id An anonymized id which remains the
same for all graphs in the datasets of
all categories.
time The time difference in seconds from
each tweet to the original status. The
original status always has a difference
of 0 seconds to itself.
friends The next greater power of two of the
follower count from the user profile
of the respective user.
followers The next greater power of two of the
friend count from the user profile of
the respective user.
9 BASELINE EXPERIMENTS
The dataset aims to support the design of structure-
based detection of misinformation, i.e., detection of
misinformation tweets by analyzing the associated
distribution graph. Naturally, this is a challenging
task since there is no guarantee per se that the graphs
associated with conspiracy theories differ from those
that are not. Thus, in order to establish a baseline for
the attainable accuracy, we present the results of three
different classification approaches. The first two ap-
proaches, Naive Bayes and Random Forest, are used
to learn classification based on manually extracted
graph features. As a third approach, we use a graph
neural network (GNN) to test whether the structure of
the distribution graphs contains patterns aside from
those implied by the explicit features that allow clas-
sification. We have performed the classification in the
following variations to show how 5G-specific misin-
formation relates to misinformation in general. In
the first variant, we combined the graphs from the
5G Conspiracy class with the graphs from the Other
Conspiracy class to form the new class which we
call General Conspiracy. The second variant contains
only the classes 5G Conspiracy and Non-Conspiracy,
while the third variant contains only the classes Other
Conspiracy and Non-Conspiracy. In the case of the
first two simple classifications, we have added another
variant in which we try to distinguish all three classes.
In order to train the Naive Bayes and the Random
Forest classifier, we have extracted the following fea-
tures from the subgraphs:
1. Number of Nodes: The number of nodes per
graph. We count all nodes, including the isolated
ones (see Figure 1 blue, red, purple, green).
2. Number of Edges: The number of directed edges
WICO Graph: A Labeled Dataset of Twitter Subgraphs based on Conspiracy Theory and 5G-Corona Misinformation Tweets
263
for each graph. Thus, if two accounts follow each
other, we count this as two edges.
3. Radius: The node corresponding to the original
status of the subgraph. The radius of a distribution
graph is the longest shortest path from the origin
node. Each edge has length one.
4. Average Clustering Coefficient: The average
clustering coefficient is defined as C =
∑
n
i=1
C
i
n
where n is the number of vertices and C
i
the Clus-
tering Coefficient corresponding to node i.
For all experiments, we perform tenfold cross val-
idation. In Table 3 we show precision, recall, F1
score, and Matthew correlation coefficient in addition
to the accuracy. Both classifiers show a relatively sim-
ilar behavior. As expected, distinguishing 5G Con-
spiracy and Non-Conspiracy is the easiest case, while
the multiclass problem is the hardest.
We also perform a short test whether basic graph
neural networks (GNNs) can provide even better ac-
curacy. As there are numerous types of GNNs a full
investigation would be outside the scope of this pa-
per. We performed a comparison of a subset of the
available state-of-the-art GNNs based on the paper by
Errica et al. (Errica et al., 2020). Among the tested
alternatives, the Graph Isomorphism Network (GIN)
(Xu et al., 2018) performed best.
GINs are relatively simple, but they are proven to
be one of the most expressive architectures among the
GNNs. Since we are only performing graph classi-
fication, we use the pooling variant of GIN to get a
graph representation of the computed node embed-
dings. We perform a short hyperparameter optimiza-
tion for the main task, which is separating the 5G from
the non-conspiracy class. The results are listed in Ta-
ble 4.
Based on the accuracy, a network with 32 units,
three layers, and a batch size of 128 emerged as the
best alternative. This is understandable given the low
average diameter of the graphs, as shown in Figure
2d. We also trained and evaluated the same net-
work configuration for the other two classification
task. The accuracy for separating Non-Conspiracy
from the rest and for separating the Other Conspira-
cies class alone from Non-Conspiracy was 62.4% and
62.2% respectively. These results show that the sim-
ple GIN approach performs significantly worse than
the other classifiers. Using Random Forest or Naive
Bayes, structure-based classification of misinforma-
tion is possible. It remains to be seen whether the ac-
curacy of the GNN based approach can be improved.
This dataset aims to provide a basis for the develop-
ment of more accurate classifiers.
Table 3: Results of the feature-based classifiers using dif-
ferent performance metrics. PREC = Precision, SENS =
Recall, F1 = F1 Score, MCC = Matthew correlation coeffi-
cient.
Class PREC SENS F1 MCC
Random Forest
General - Non
Correctly Classified Instances 68.1558 %
general 0.415 0.269 0.327 0.136
non 0.742 0.847 0.791 0.136
avg. 0.649 0.682 0.658 0.136
5G - Non
Correctly Classified Instances 83.4599 %
5G 0.291 0.126 0.176 0.110
non 0.870 0.950 0.908 0.110
avg. 0.788 0.835 0.805 0.110
Other Non
Correctly Classified Instances 78.5159 %
other 0.352 0.134 0.194 0.114
non 0.820 0.941 0.876 0.114
avg. 0.729 0.785 0.744 0.114
Multiclass
Correctly Classified Instances 66.8671 %
other 0.240 0.114 0.155 0.055
non 0.734 0.893 0.805 0.117
5G 0.246 0.108 0.150 0.094
avg. 0.593 0.669 0.618 0.103
Naive Bayes
General - Non
Correctly Classified Instances 69.2153 %
general 0.341 0.078 0.127 0.031
non 0.717 0.939 0.813 0.031
avg. 0.609 0.692 0.616 0.031
5G - Non
Correctly Classified Instances 84.5304 %
5G 0.256 0.054 0.089 0.058
non 0.863 0.974 0.915 0.058
avg. 0.778 0.845 0.800 0.058
Other Non
Correctly Classified Instances 78.8723 %
other 0.245 0.045 0.076 0.025
non 0.809 0.967 0.881 0.025
avg. 0.700 0.789 0.725 0.025
Multiclass
Correctly Classified Instances 69.0722 %
other 0.200 0.034 0.057 0.013
non 0.715 0.955 0.818 0.020
5G 0.221 0.037 0.063 0.046
avg. 0.570 0.691 0.600 0.022
ICAART 2021 - 13th International Conference on Agents and Artificial Intelligence
264

Table 4: Hyperparameter optimization for the GNN exper-
iment on the 5G vs Non-Conspiracy classification problem.
Batch Size Units Layers Accuracy
32 32 3 64.2% 8.4%
32 32 5 62.3% 8.0%
32 64 2 64.8% 7.2%
32 64 5 64.8% 8.9%
128 32 3 67.4% 9.0%
128 32 5 62.7% 7.4%
128 64 2 64.4% 6.7%
128 64 5 66.7% 7.9%
10 CONCLUSION
We have presented a new dataset of Twitter graphs
associated with the spread of misinformation related
to COVID-19, particularly conspiracy theories con-
nected to 5G. This dataset can be used to train graph-
based misinformation detection methods. The dataset
is comparatively small, which is due to the effort
required for manual labeling, and because very few
such misinformation tweets have a substantial num-
ber of retweets. We have used basic classifiers to
verify that ML-based classification is possible and to
establish a baseline accuracy that more sophisticated
systems can compare against. However, since the ul-
timate goal for such systems will be to moderate or
at least flag content in social media, we believe that
explainability will be a quality in addition to high ac-
curacy, a consideration that was also pointed out in
previous work (Reis et al., 2019).
In the future, we will pursue the approach of find-
ing candidate misinformation tweets among the sta-
tuses that have sizeable subgraphs associated with
them using natural language processing. The re-
sulting candidate statuses can then be labeled man-
ually. The labeling showed that the differences be-
tween misinformation spreading and other Tweets can
be very subtle. Thus we believe that manual labeling
remains necessary as current NLP methods are not ca-
pable of reliably identifying misinformation. How-
ever, such methods can be developed with the help of
the labeled datasets. We assume that hybrid methods
that combine graph and NLP based approaches will
be the key to obtain reliable misinformation detection
systems.
REFERENCES
Ahmed, S., Hinkelmann, K., and Corradini, F. (2019).
Combining machine learning with knowledge engi-
neering to detect fake news in social networks-a sur-
vey. In Proceedings of the AAAI 2019 Spring Sympo-
sium, volume 12.
Ali, H. S. and Kurasawa, F. (2020). #covid19: Social media
both a blessing and a curse during coronavirus pan-
demic. https://bit.ly/3bjVQgQ.
Breiman, L. (2001). Random forests. Machine learning,
45(1):5–32.
Burkhardt, J. M. (2017). History of fake news. Library
Technology Reports, 53(8):5–9.
Castelo, S., Almeida, T., Elghafari, A., Santos, A., Pham,
K., Nakamura, E., and Freire, J. (2019). A topic-
agnostic approach for identifying fake news pages. In
Companion Proceedings of The 2019 World Wide Web
Conference, WWW ’19, page 975980, New York, NY,
USA. Association for Computing Machinery.
Cui, L. and Lee, D. (2020). Coaid: Covid-19 healthcare
misinformation dataset.
Cui, L., Seo, H., Tabar, M., Ma, F., Wang, S., and Lee, D.
(2020). Deterrent: Knowledge guided graph attention
network for detecting healthcare misinformation. In
Proceedings of the 26th ACM SIGKDD International
Conference on Knowledge Discovery & Data Mining,
KDD ’20, page 492502, New York, NY, USA. Asso-
ciation for Computing Machinery.
Dai, E., Sun, Y., and Wang, S. (2020). Ginger cannot cure
cancer: Battling fake health news with a comprehen-
sive data repository. In Proceedings of the Interna-
tional AAAI Conference on Web and Social Media,
volume 14, pages 853–862.
de Beer, D. and Matthee, M. (2020). Approaches to iden-
tify fake news: A systematic literature review. In
Antipova, T., editor, Integrated Science in Digital
Age 2020, pages 13–22, Cham. Springer International
Publishing.
Dhoju, S., Main Uddin Rony, M., Ashad Kabir, M., and
Hassan, N. (2019). Differences in health news from
reliable and unreliable media. In Companion Proceed-
ings of The 2019 World Wide Web Conference, pages
981–987.
Errica, F., Podda, M., Bacciu, D., and Micheli, A. (2020).
A fair comparison of graph neural networks for graph
classification. In International Conference on Learn-
ing Representations.
European External Action Service (EEAS) (2020). Disin-
formation can kill. https://bit.ly/32FKlwb.
Flaxman, S., Goel, S., and Rao, J. M. (2016). Filter Bub-
bles, Echo Chambers, and Online News Consumption.
Public Opinion Quarterly, 80(S1):298–320.
Ghebreyesus, T. A. and Ng, N. (2020). How the who is
leading the fight against coronavirus misinformation.
Ghenai, A. and Mejova, Y. (2018). Fake cures: user-centric
modeling of health misinformation in social media.
Proceedings of the ACM on human-computer interac-
tion, 2(CSCW):1–20.
Hassan, N., Arslan, F., Li, C., and Tremayne, M. (2017).
Toward automated fact-checking: Detecting check-
worthy factual claims by claimbuster. In Proceedings
of the 23rd ACM SIGKDD International Conference
on Knowledge Discovery and Data Mining, KDD ’17,
WICO Graph: A Labeled Dataset of Twitter Subgraphs based on Conspiracy Theory and 5G-Corona Misinformation Tweets
265

page 18031812, New York, NY, USA. Association for
Computing Machinery.
Horne, B. D. and Adali, S. (2017). This just in: Fake news
packs a lot in title, uses simpler, repetitive content in
text body, more similar to satire than real news. arXiv
preprint arXiv:1703.09398.
Hosseinimotlagh, S. and Papalexakis, E. E. (2018). Un-
supervised content-based identification of fake news
articles with tensor decomposition ensembles. In Pro-
ceedings of the Workshop on Misinformation and Mis-
behavior Mining on the Web (MIS2).
Howell, L. (2013). Digital wildfires in a hyperconnected
world. https://bit.ly/2GiEF4f.
Huang, Q., Zhou, C., Wu, J., Wang, M., and Wang, B.
(2019). Deep structure learning for rumor detection
on twitter. In 2019 International Joint Conference on
Neural Networks (IJCNN), pages 1–8. IEEE.
Kersting, K., Kriege, N. M., Morris, C., Mutzel, P., and
Neumann, M. (2016). Benchmark data sets for graph
kernels. http://graphkernels.cs.tu-dortmund.de.
Le, T., Wang, S., and Lee, D. (2020). Malcom: Generating
malicious comments to attack neural fake news detec-
tion models. arXiv preprint arXiv:2009.01048.
Ma, J., Gao, W., and Wong, K.-F. (2019). Detect rumors
on twitter by promoting information campaigns with
generative adversarial learning. In The World Wide
Web Conference, pages 3049–3055.
P
´
erez-Rosas, V., Kleinberg, B., Lefevre, A., and Mihal-
cea, R. (2018). Automatic detection of fake news. In
Proceedings of the 27th International Conference on
Computational Linguistics, pages 3391–3401, Santa
Fe, New Mexico, USA. Association for Computa-
tional Linguistics.
Reis, J. C., Correia, A., Murai, F., Veloso, A., and Ben-
evenuto, F. (2019). Explainable machine learning for
fake news detection. In Proceedings of the 10th ACM
Conference on Web Science, pages 17–26.
Salem, F. K. A., Al Feel, R., Elbassuoni, S., Jaber, M.,
and Farah, M. (2019). Fa-kes: A fake news dataset
around the syrian war. In Proceedings of the Inter-
national AAAI Conference on Web and Social Media,
volume 13, pages 573–582.
Schroeder, D. T., Pogorelov, K., and Langguth, J. (2019).
Fact: a framework for analysis and capture of twit-
ter graphs. In 2019 Sixth International Conference on
Social Networks Analysis, Management and Security
(SNAMS), pages 134–141. IEEE.
Shu, K., Mahudeswaran, D., Wang, S., Lee, D., and Liu,
H. (2018). Fakenewsnet: A data repository with news
content, social context and dynamic information for
studying fake news on social media. arXiv preprint
arXiv:1809.01286, 8.
Sivasangari, V., Anand, P., and Santhya, R. (2018). A mod-
ern approach to identify the fake news using machine
learning. Int. J. Pure Appl. Math, 118(20):10.
Wang, W. Y. (2017). ” liar, liar pants on fire”: A new bench-
mark dataset for fake news detection. arXiv preprint
arXiv:1705.00648.
Xu, K., Hu, W., Leskovec, J., and Jegelka, S. (2018).
How powerful are graph neural networks? CoRR,
abs/1810.00826.
Yang, Y., Zheng, L., Zhang, J., Cui, Q., Li, Z., and Yu,
P. S. (2018). Ti-cnn: Convolutional neural networks
for fake news detection.
Zhang, C., Gupta, A., Kauten, C., Deokar, A., and Qin, X.
(2019). Detecting fake news for reducing misinforma-
tion risks using analytics approaches. European Jour-
nal of Operational Research, 279.
ICAART 2021 - 13th International Conference on Agents and Artificial Intelligence
266
