
A Multi-spot Murmur Sound Detection Algorithm and Its Application to
a Pediatric and Neonate Population
Marisa Oliveira
1
, Jorge Oliveira
2,3
, Rui Camacho
1,4
and Carlos Ferreira
2
1
Faculdade de Engenharia da Universidade do Porto, Rua Dr. Roberto Frias, 4200-465 Porto, Portugal
2
Instituto Superior de Engenharia do Porto, Rua Dr. Ant
´
onio Bernardino de Almeida N
o
431, 4249-015 Porto, Portugal
3
Knowledge Engineering and Decision Support Research Group (GECAD),
Rua Dr. Ant
´
onio Bernardino de Almeida N
o
431, 4249-015 Porto, Portugal
4
LIADD-INESC TEC - Instituto de Engenharia de Sistemas e Computadores, Tecnologia e Ci
ˆ
encia,
Rua Dr. Roberto Frias, 4200-465 Porto, Portugal
Keywords:
Heart Sounds, Data Processing, Heart Auscultation, Cardiovascular Data, Machine Learning, Data Mining.
Abstract:
Cardiovascular diseases are one of the leading causes of death in the world. In low income countries, heart
auscultation is of capital importance since it is an efficient and low cost method to monitor the heart. In this
paper, we propose a multi-spot system that aims to detect cardiac anomalies and to support a diagnosis in
remote areas with limited heath care response. Our proposed solutions exploits data collected from the four
main auscultation spots: Mitral, Pulmonary, Tricuspid and Aorta in a asynchronous way. From the several
multi-spot systems implemented, the best results were obtained using a bi-modal system that only processes
the Mitral and the Pulmonary spot simultaneously. Using these two spots we have achieved an accuracy
between 85.7% (smallest value, using ANN) and the best value of 91.4% (obtained with a logistic regression
algorithm). Taking into a account the pediatric population and the incident cardiac pathologies, it happens
to be the spots where the observed murmurs were most audible. We have also find out that when using four
auscultation spots, the choice of the algorithm is of secondary priority, which does not seem to be the case
for a single auscultation spot system. With one single auscultation we have an average of 4% of difference
between the results obtained with the algorithms and with four auscultation spots we have a smaller average
of 2.1%.
1 INTRODUCTION
Cardiovascular diseases are the leading cause of death
in developed countries. It is estimated that, in 2015,
17.7 million people died from a cardiovascular dis-
ease, which represents about 31% of deaths world-
wide (OPAS/OMS, 2017). These are of particular
relevance in newborns and children and adolescents,
namely children who are born with congenital malfor-
mations, taking into account that heart disease is the
type of congenital disease responsible for more deaths
in the first year of life than any other condition, when
epidemic etiologies are excluded (Lopes et al., 2018).
In Brazil, this problem is even more accentuated due
to socioeconomic problems. According to the Multi-
dimensional Poverty Index (IPM), in 2015, 3.8 % of
the Brazilian population, which is equivalent to about
7.8 million people, lived in a situation of poverty,
that is, lack of infrastructures, few financial resources
for an efficient screening of cardiovascular diseases,
lack of medical health care, deprivations in access to
health, access to education, access to drinking water,
sanitation and electricity (PNUD, 2019). According
to the investigation, infant mortality has a major in-
fluence on the mortality rate in Brazil (PNUD, 2019).
The analysis of the heart sound might mitigate the
problem because auscultation gives a basic idea about
the state of the heart, allowing to know if patients need
close medical attention which helps to prevent deaths
by cardiovascular disease. Besides, a stethoscope has
a compact and lightweight design which makes it easy
to transport to environments with difficult access. In
this paper we propose a multi-spot system that aims to
detect cardiac anomalies analysing the heart sounds in
pediatric patients.
1.1 Related Work
Salleh et al. in (Sh-Hussain et al., 2013) were fo-
cused in finding the optimal auscultation spot. They
228
Oliveira, M., Oliveira, J., Camacho, R. and Ferreira, C.
A Multi-spot Murmur Sound Detection Algorithm and Its Application to a Pediatric and Neonate Population.
DOI: 10.5220/0010262502280234
In Proceedings of the 14th International Joint Conference on Biomedical Engineering Systems and Technologies (BIOSTEC 2021) - Volume 4: BIOSIGNALS, pages 228-234
ISBN: 978-989-758-490-9
Copyright
c
2021 by SCITEPRESS – Science and Technology Publications, Lda. All rights reserved

developed a framework based on the combination of
Time Frequency Distributions (TFD), Mel-Frequency
Cepstrum Coefficient (MFCC) and Hidden Markov
Model (HMM) and evaluate the performance in vari-
ous stages to observe the relative contribution of each
stage of auscultation.
Sh-Hussain et al. in (Sh-Hussain et al., 2012), de-
veloped comparative experiments using MFCC fea-
tures, various numbers of HMM states and various
numbers of gaussian mixtures to observe the impact
of these factors on the classification performance at
the four spots of auscultation. They evaluated in dif-
ferent stages to examine the relative contribution of
each stage of auscultation in identifying the presence
of murmurs. Pedrosa et al. in (Pedrosa et al., 2014)
developed two novel algorithms: one focuses on the
segmentation of the heart sounds into heart cycles,
based on the autocorrelation function to find the pe-
riodic components of the PCG signal, and another
is to detect heart murmurs, based on features col-
lected from different domains and its evaluation is
performed in two ways: a arbitrary distribution be-
tween train and test set and a division according to
patients.
Kobt et al. in (Kot, 2019) developed two auto-
matic computer cardiac auscultation (ACCA) models:
a model A ACCA recognition system (machine learn-
ing (interpreter independent)) and model B ACCA
recognition system (machine learning and interpreter
dependent visual analysis). The models used machine
learning based on mel-frequency cepstral coefficients
as a feature and Hidden Markov Model (HMM) as a
classifier and they performed visual analysis based on
phonocardiography (PCG) and spectrogram image.
Eslamizadeh et al. in (Eslamizadeh and Barati,
2017) heart cycles were divided from heart sounds us-
ing wavelet transformer. In this paper Eslamizadeh
et al. proposed the use of an Multi-layer Perceptron
(MLP) Feed-forward ANN trained with back prop-
agation learning and modified Neighbor Annealing
(NA) algorithms, to classify segmented heart sounds
into normal and murmur classes.
Kang et al. in (Kang et al., 2017) developed a
computer algorithm to identify Sill’s murmur in chil-
dren. They start with the development of an segmen-
tation algorithm to locate the first and second heart
sounds, then they extracted signal features and after
they used machine learning-based classifiers, artificial
neural network and support vector machine to identify
Still’s murmur in children.
Delgado-Trejos et al. in (Delgado-Trejos et al.,
2009) used three families of features to present a com-
parison between them. They used time-varying and
time-frequency features, perceptual features and frac-
tal features. The results of each family of features
extracted were evaluated with a k-nearest neighbors
classifier and they obtained better results when used
fractal features.
1.2 Overview Methodology
Our methodology starts by filtering the heart sounds
and then we proceed to the feature extraction phase.
We have chosen to extract features of the time do-
main (mean, standard deviation and amplitude) and
MFCCs (Mel frequency Cepstral Coefficients) and
the features extracted were normalized using a z-
score (McLeod, 2019). After this, seven machine
learning algorithms were used to make predictive
classification models.
In our method the data from each auscultation spot
are processed separately. Only at the end the results
from each spot will be aggregated and a diagnosis
must be assigned. In this work, a patient is classi-
fied as positive if a murmur is detected at least in a
single spot. Throughout this paper, spots will be re-
ferred according to the following acronyms: ’AV’ for
Aorta spot, ’MV’ for Mitral spot, ’PV’ for Pulmonary
spot and ’TV’ for tricuspid spot. The combinations
of spots are represented concatenating the combined
spot’s acronyms, like ’AVMVTV’ which means that
processes the Aortic, Mitral and the Pulmonary spots
simultaneously.
This paper has the following structure:
Section 2 Heart Sound: general concepts concern-
ing the heart sound are introduced.
Section 3 Methodology: this methodology used in
the experiments is presented in detail.
Section 4 Results: a summary of the results obtained
with the experiments are presented and discussed.
Section 5 Conclusion: the conclusions that may be
drawn from the experimental results are presented
together with the future work.
2 HEART SOUND PHYSIOLOGY
The vibrations and subsequent opening of the heart
valves caused by blood pressure during the cardiac
cycle, are the source of the cardiac sounds (Dorn-
bush and Turnquest, 2019). S1 sound of the heart is
produced when the mitral and tricuspid valves close
in systole and the S2 sound of the heart is produced
when the pulmonary and aortic valves close in dias-
tole (Dornbush and Turnquest, 2019). Systole occurs
between S1 and S2 and diastole occurs between S2
and S1. S1 and S2 are usually the events with the
A Multi-spot Murmur Sound Detection Algorithm and Its Application to a Pediatric and Neonate Population
229
highest amplitudes in a Phonocardiogram (PCG) sig-
nal (Figure 1) and have frequencies between 20-200
Hz (Naseri and Homaeinezhad, 2013).
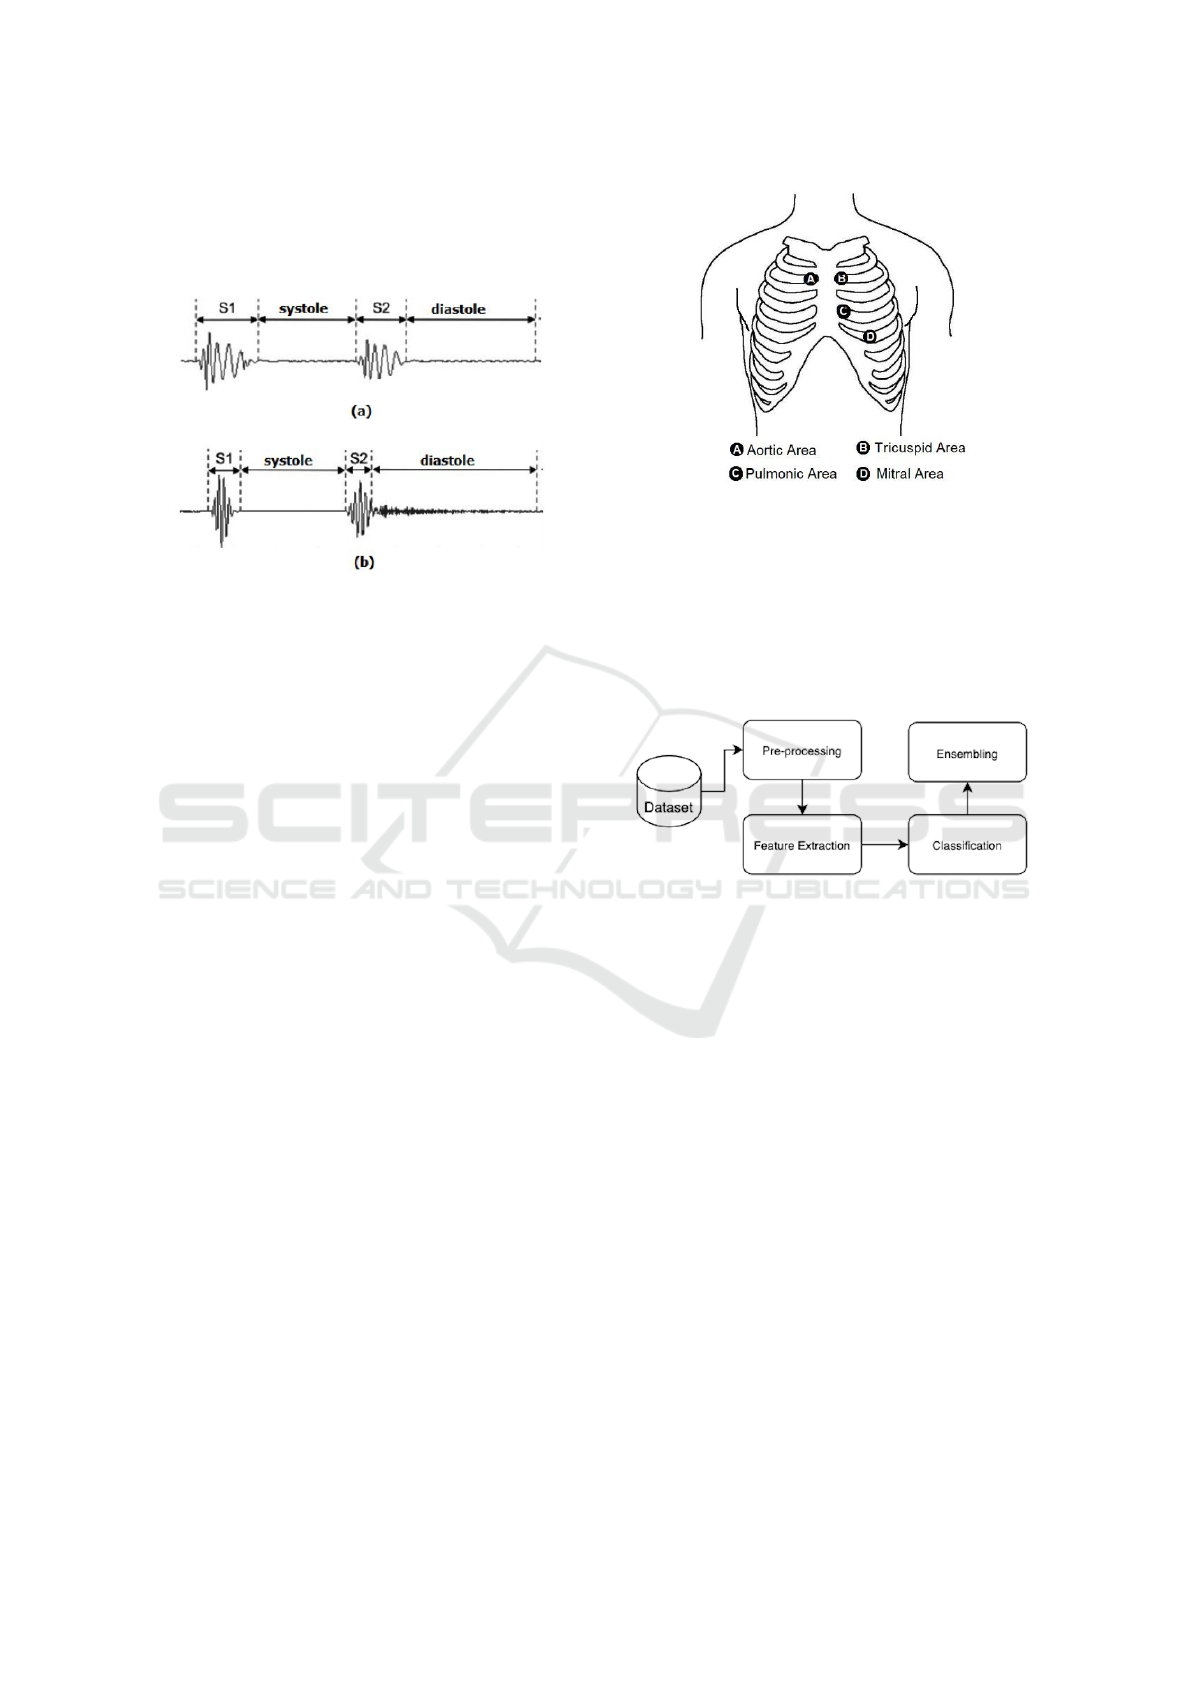
Figure 1: PCG signals of normal patient (a) and patient with
murmur (b).
It is possible to distinguish heart murmurs due to
their longer duration. In pediatric age three types of
murmurs can be identified (Oliveira et al., 2013):
• Innocent Murmur: It usually happens in a well-
structured and functional heart;
• Functional or Physiological Murmur: Al-
though there is no cardiovascular abnormality,
there is a hemodynamic modification that can al-
ter the normal blood flow;
• Pathological or Organic Murmur: When func-
tional and structural abnormalities are present in
the cardiovascular system.
Generally, murmurs are caused by turbulent blood
flow that can result in the narrowing or leaking of
heart valves or due to abnormal blood flow in the heart
(Carvalho, 2018). According to the physiological sit-
uation that leads to the murmur, different sounds are
generated.
2.1 Auscultation Spots
The classic tool for assessing heart sounds is the
stethoscope (Dornbush and Turnquest, 2019). The
stethoscope can be used to auscultate the four heart
valves, being positioned in a specific area, according
to the Figure 2 to hear the desired valve: the aor-
tic valve is best heard in the second intercostal space
(right), just near to the sternum; the pulmonary valve
is best heard in the second intercostal space (left), just
near to the sternum; the tricuspid valve is best heard
in the fourth intercostal space (left) (parasternal line)
and the mitral valve is best heard in the fifth inter-
costal space (left) (midline clavicular) (Dornbush and
Turnquest, 2019).
Figure 2: Cardiac auscultation spots.
3 METHODOLOGY
To solve the initial problem of this paper, it was de-
cided to build a methodology that follows a stan-
dard signal processing pipeline. Figure 3 shows the
scheme of our methodology.
Figure 3: Methodology scheme.
3.1 Data Set
The data set was collected during a screening cam-
paign entitled Caravana do Corac¸
˜
ao. The screenings
were carried out in Brazil, in the state of Pernambuco,
in 2014 and 2015. As part of the protocol, all par-
ticipants completed sociodemographic questionnaires
and were analyzed with a clinical examination (phys-
ical and mental), screening (physiological measures)
and cardiac investigations (radiography, electrocar-
diogram and echocardiogram). In addition, electronic
auscultations were performed for each patient at four
of the main auscultation spots and an individual au-
dio sample was collected from each one for further
analysis. The data set used contains 687 patients, of
which 545 (70.3%) have a normal heartbeat and 142
(20.7%) have a cardiac disease. In relation to gender
the dataset has 399 male, 270 female patients and 18
fetus. The collected samples are from different age
groups. The average age is 5 ± 4 years old. The
youngest patient is a fetus, and the oldest one is 18
years old. The heart sounds were collected at 4000Hz
BIOSIGNALS 2021 - 14th International Conference on Bio-inspired Systems and Signal Processing
230

sampling rate. The dataset samples were segmented
by a cardiopneumologist who manually identified S1,
systole, S2 and diastole.
3.2 Pre-processing
Recorded data includes dispensable noise that can be
removed to improve feature extraction. To suppress
the interference of cardiac sound signals, it was nec-
essary to remove some of the frequencies. It is known
that the the spectral content of heart sound signals is
between 0 Hz and 200 Hz and the frequency of S1 and
S2 is normally between 30-80 Hz (Oliveira, 2018). So
we decide to cut frequencies above 200 Hz to remove
some of the noise. Therefore, the IIR filter Butter-
worth order 5 with a cut-off frequency of 200Hz was
used.
3.3 Feature Extracting
Based in (Liu et al., 2016), the following features
were extracted:
• Time-frequency Domain: Mean of S1 intervals,
Standard deviation of S1 intervals, Amplitude of
S1 intervals, Mean of systolic intervals, Standard
deviation of systolic intervals, Amplitude of sys-
tolic intervals, Mean of S2 intervals, Standard de-
viation of S2 intervals, Amplitude of S2 intervals,
Mean of diastolic intervals, Standard deviation of
diastolic intervals, Amplitude of diastolic inter-
vals.
• Perceptual Features: MFCCs (Mel-Frequency
Cepstrum Coefficients): for the extraction of
MFCCs, we used a 25ms window and a 10ms step
and a total of 5 MFCC per window were calcu-
lated.
3.4 Classification
To apply the Machine Learning (ML) algorithms, the
sets of sounds were previously divided into a training
and test set and also combined according to the car-
diac spot. After this, the features were divided three
times into a training and test set. To be divided into
a training and test set, initially all sounds with a heart
murmur were placed in one list and sounds without a
heart murmur in another list. For the training set, 70%
of the sounds were removed from the murmur list and
the other 70% from the list of non-murmur list, with
the remaining 30% of each list for the test set to be
possible to obtain the global distribution in the test set
and, with the training and test sets properly formed.
The following ML algorithms were used, with an ex-
haustive search over specified parameters values, to
make predictive classification models: Support Vec-
tor Machine (SVM) (Evgeniou and Pontil, 2001), K
Nearest Neighbors (KNN) (Guo et al., 2003), Artifi-
cial Neural Networks (ANN) (Zupan, 1994), Gradient
Boost (XGBoost) (Chen and He, 2014), Light Gradi-
ent Boost (LightGBM) (Ke et al., 2017), Random For-
est (RF) (Cutler et al., 2012) and Logistic Regression
(LogR) (Kleinbaum and Klein, 2010).
3.5 Decision Process
The ML models were constructed to make prediction
on samples. In order to make predictions on patients
we have combined the predictions, and a voting sys-
tem was used as follows: ”If at least one sound from
the patient is classified as a heart murmur, the pa-
tient has a heart murmur”. To assess the predictive
performance of the ML models some evaluation met-
rics were used. The metrics used to assess the per-
formance of the constructed models include the ac-
curacy, precision, recall and F1-Score. The results
in this paper are obtained from the test set in order
to assess the quality of the generalization and are fo-
cused on the F1-Score because it is one of the most
common metrics used for binary classification in ma-
chine learning and the data set used have unbalanced
classes.
4 RESULTS
When analyzing the results obtained in general, an in-
crease in the number of spots used does not always
mean better results. The best results were obtained,
in almost all the algorithms used, in the combina-
tion of two spots, namely in the spots ’MVPV’ and
’PVTV’. The second best results were achieved with
three spots combinations.
In addition to this observation, the variation in the
results obtained with the algorithms when using only
one auscultation spot is greater than with the use of all
spots. In the Figure 4 we present the average of F1-
Score of all experiments and it is possible to observe
that the variability between algorithms is decreasing,
as more channels are used. This means that the im-
portance of the chosen algorithm decreases with the
increase in the number of spot.
In the Figure 5 it is possible to observe in detail the
difference in performance when a system with four
auscultation spots is used. The difference is lower
than 3%. In this case, we obtain the best result by
logistic regression with an average of performance of
89.9% and worst result by KNN with an average of
performance of 87.8%.
A Multi-spot Murmur Sound Detection Algorithm and Its Application to a Pediatric and Neonate Population
231
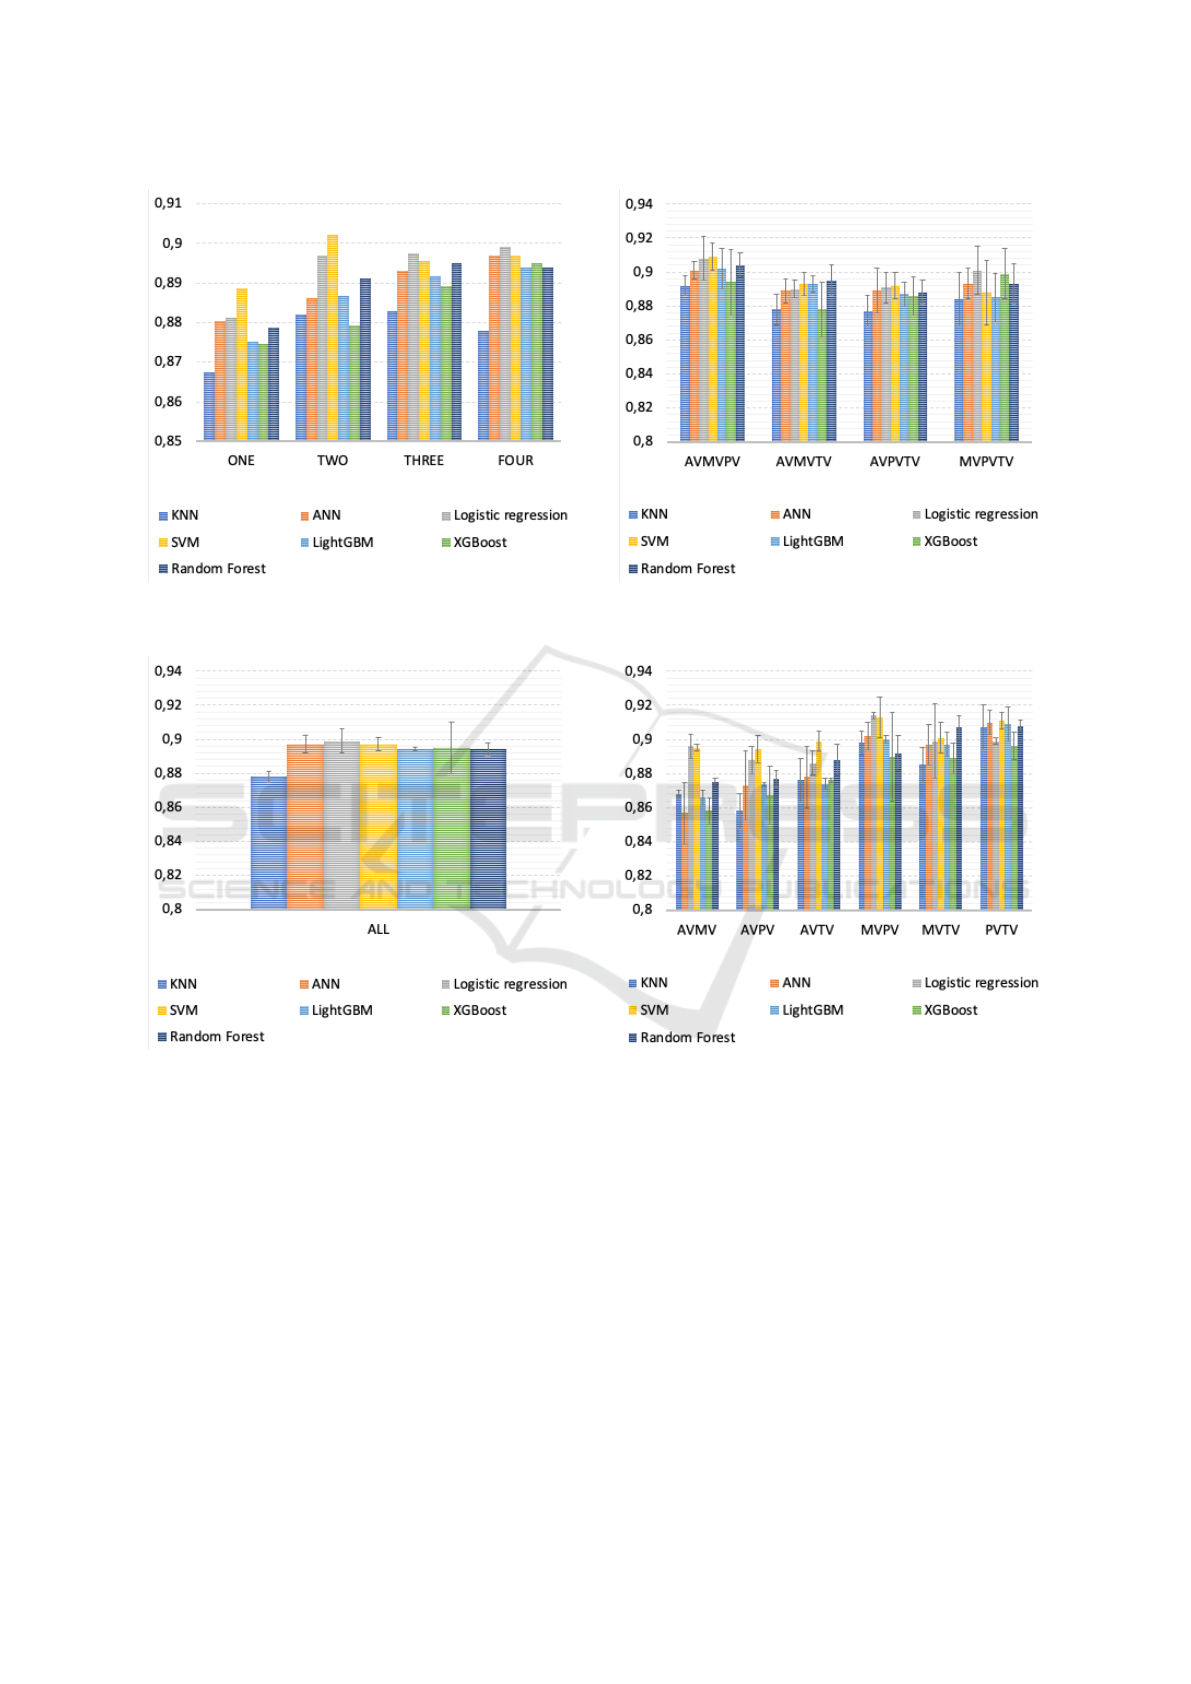
Figure 4: Average performance of all experiments with one,
two, three and four spots using F1-Score metric.
Figure 5: F1-Score in a four spot auscultation system with
its standard deviation.
In the Figure 6 the results obtained by the met-
ric F1-Score are found when the three auscultation
spots are used. When looking at the graph, more vari-
ability is found than when using the four auscultation
spots. The difference between the highest achieved
value and the lowest value is approximately 6%. In
addition to this observation, it appears that the high-
est value results are found with the combination of
’AVMVPV’ spot. With three spots, we obtain the best
result by logistic regression with an average of per-
formance of 89.8% and worst result by KNN with an
average of performance of 88.3%.
In the Figure 7 the results obtained by the metric
F1-Score are found when using the two auscultation
Figure 6: F1-Score in a three spot auscultation system with
its standard deviation.
Figure 7: F1-Score in a two spot auscultation system with
its standard deviation.
spot. Note that the values have greater variability than
with three and four spot. The difference between the
lowest and the highest value reached is approximately
9 %. It appears that the combination that obtained the
most valuable results was the ’MVPV’ combination,
followed by the ’PVTV’ combination. The best result
was obtained by the SVM with an average of perfor-
mance of 90.2% and worst result were obtained by
XGBoost with an average of performance of 87.9%.
In the Figure 8 the results obtained by the met-
ric F1-Score are found when using an auscultation
spot. When observing the variability between the al-
gorithms, it is noted that it is greater than with two,
three or four auscultation spots. The difference be-
BIOSIGNALS 2021 - 14th International Conference on Bio-inspired Systems and Signal Processing
232
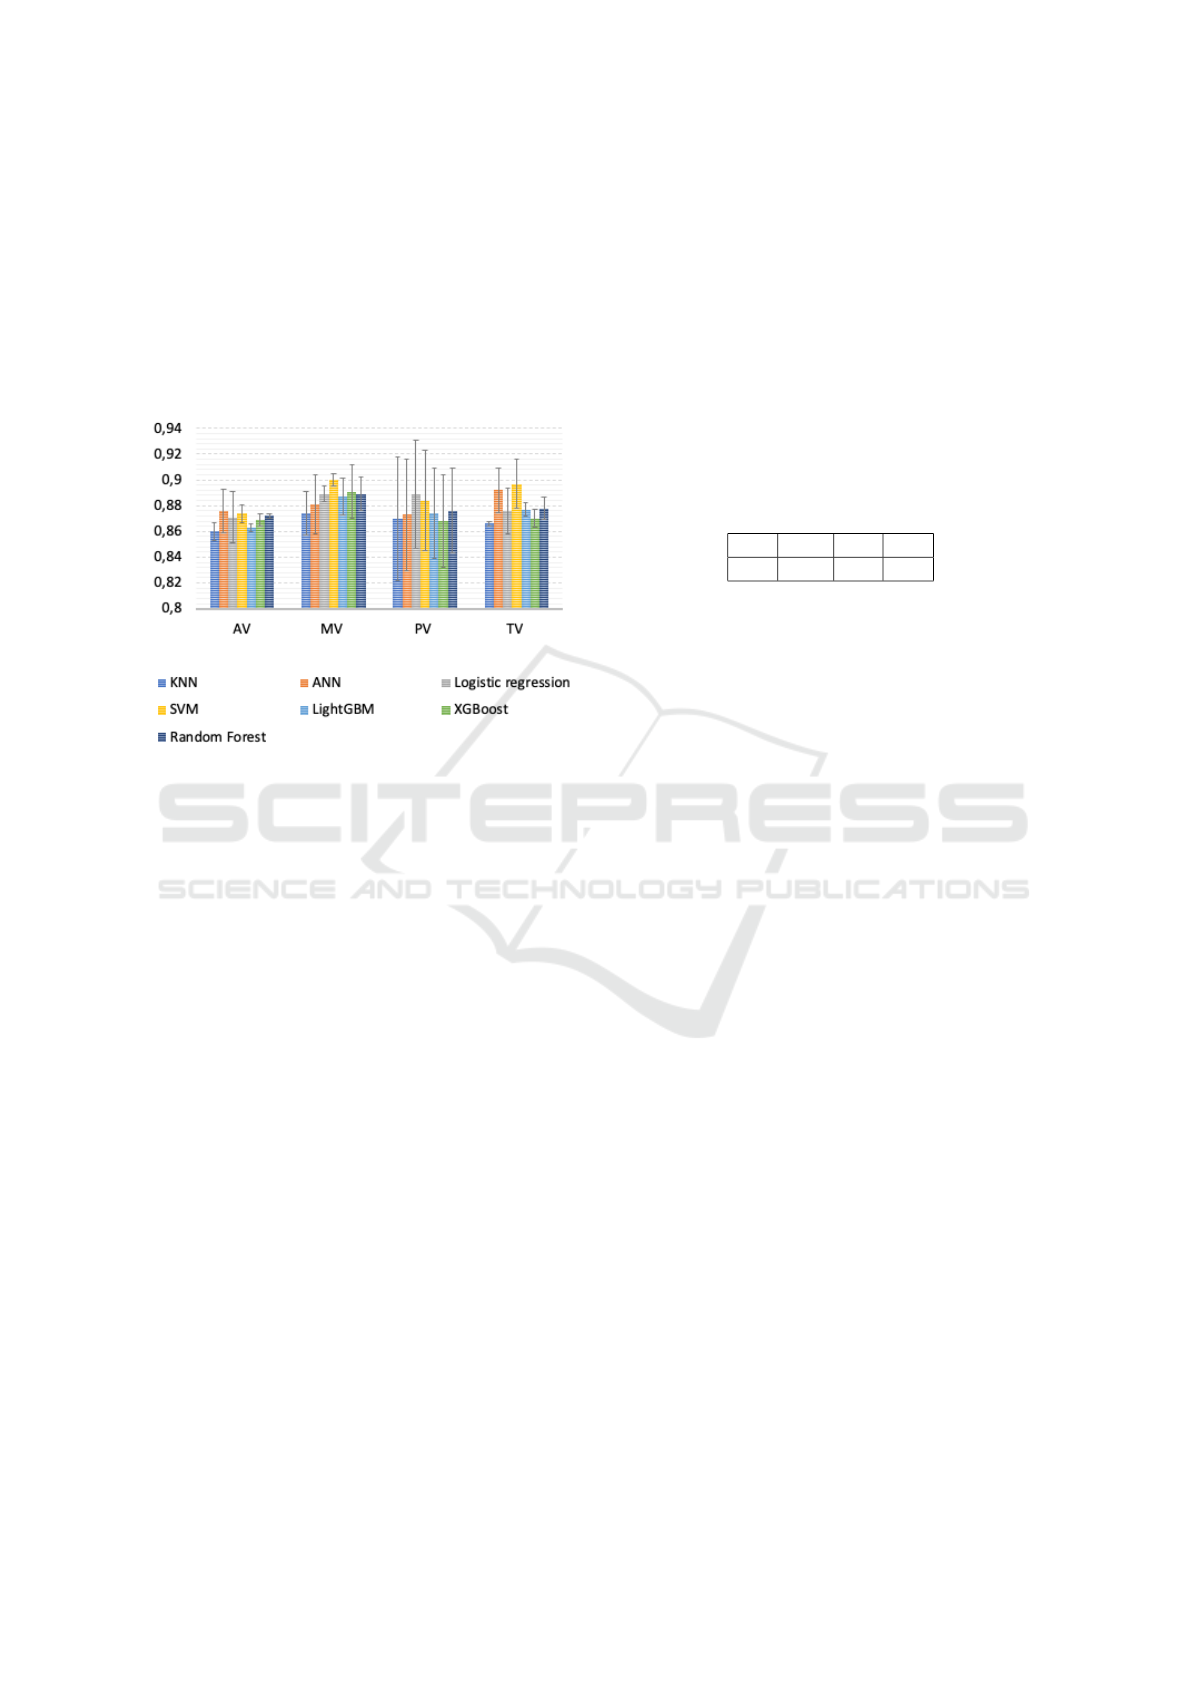
tween the highest and lowest value is approximately
11%. With one spot, the best result was obtained by
the SVM with an average of performance of 88.9%
and worst result with KNN with average of perfor-
mance of 86.7%. The spot that obtained results with
higher values was the ’MV’ spot. Thus, it is possible
to conclude that the choice of the algorithm to be used
is more important with a smaller number of spot than
with a larger number of spot.
Figure 8: F1-Score in a one spot auscultation system with
its standard deviation.
5 CONCLUSION
The best results were obtained with two ausculta-
tion spots with logistic regression (with 91.1% of F1-
Score). When analyzing the results obtained, it can be
concluded that with the increase in the number of aus-
cultation spot in the experiments, the difference in re-
sults between the computational learning algorithms
used decreased, which means that the importance of
choosing an algorithm decreases with the increase of
number of auscultation spot used.
The F1-Score of all algorithms, when four aus-
cultation spots are used, contains approximate val-
ues. The average of the variance it is 0.005%. The
best result was obtained by logistic regression with
an average of F1-Score of 89.9%. When three aus-
cultation spots are used, the average of the variance
it is 0.012%. The best result was obtained by logis-
tic regression with an average of F1-Score of 89.8%.
When two auscultation spots are used, the average of
the variance it is 0.011%. The best result was ob-
tained by the SVM with an average of F1-Score of
90.2%. When one auscultation spot is used, the aver-
age of the variance it is 0.052%. The best result was
obtained by the SVM with an average of F1-Score of
88.9%. This fact may be an indicator that the choice
of the algorithm is more relevant when using only one
auscultation spot.
It was found that the best values obtained in
the results of most algorithms corresponded to the
’MVPV’. Are these the most important spots for doc-
tors? To answer this question, we have requested a
student from medicine to analyze a sample (81 pa-
tients) of our data set, not only she verified the pres-
ence of heart murmurs, but she also identified the
spots on which the murmurs are most audible, their
frequency by auscultation spot is displayed on Table
1.
Table 1: Number of times where the spot was the most au-
dible.
AV MV PV TV
13 20 31 17
In this sense, there is a hypothesis that when com-
bining spot where the murmur is more audible, better
results are obtained than if spot are used where the
murmur is not so audible. It is observed that the spot
that appears less often as the most audible spot is the
’AV’ spot and when combinations are made with this
spot, lower results are obtained. There is a possibility
that, in children, the ’MV’, ’PV’, ’TV’ spots are the
most important in view of the pathologies of the study
population.
ACKNOWLEDGMENTS
The authors would like to acknowledge the Mestrado
Integrado em Engenharia Inform
´
atica e Computac¸
˜
ao
(MIEIC), Faculdade de Engenharia da Universidade
do Porto (FEUP).
This work was also supported by the DigiScope2
project (POCI-01-0145-FEDER-029200-PTDC/CCI-
COM/29200/2017), funded by Fundo Europeu de De-
senvolvimento Regional (FEDER), through Programa
Operacional Competitividade e Internacionalizac¸
˜
ao
(POCI).
REFERENCES
(2019). Recognition of heart murmur based on machine
learning and visual based analysis of phonocardiog-
raphy, volume 857. Springer International Publishing.
Carvalho, B. N. D. (2018). Diagn
´
ostico autom
´
atico de pa-
tologias card
´
ıacas baseado em descritores sonoros e
SVM.
Chen, T. and He, T. (2014). xgboost: Extreme Gradient
Boosting. R Lecture, (2016):1–84.
A Multi-spot Murmur Sound Detection Algorithm and Its Application to a Pediatric and Neonate Population
233

Cutler, A., Cutler, D. R., and Stevens, J. R. (2012). Random
Forests, pages 157–175. Springer US.
Delgado-Trejos, E., Quiceno-Manrique, A. F., Godino-
Llorente, J. I., Blanco-Velasco, M., and Castellanos-
Dominguez, G. (2009). Digital auscultation analysis
for heart murmur detection. Annals of Biomedical En-
gineering, 37(2):337–353.
Dornbush, S. and Turnquest, A. E. (2019). Physiology,
Heart Sounds.
Eslamizadeh, G. and Barati, R. (2017). Heart murmur de-
tection based on wavelet transformation and a syn-
ergy between artificial neural network and modified
neighbor annealing methods. Artificial Intelligence in
Medicine, 78:23–40.
Evgeniou, T. and Pontil, M. (2001). Support vector ma-
chines: Theory and applications. Lecture Notes in
Computer Science (including subseries Lecture Notes
in Artificial Intelligence and Lecture Notes in Bioin-
formatics), 2049 LNAI(January 2001):249–257.
Guo, G., Wang, H., Bell, D., Bi, Y., and Greer, K. (2003).
KNN Model-Based Approach in Classification. In
Meersman, R., Tari, Z., and Schmidt, D. C., editors,
On The Move to Meaningful Internet Systems 2003:
CoopIS, DOA, and ODBASE, pages 986–996, Berlin,
Heidelberg. Springer Berlin Heidelberg.
Kang, S., Doroshow, R., McConnaughey, J., and Shekhar,
R. (2017). Automated identification of innocent Still’s
murmur in children. IEEE Transactions on Biomedi-
cal Engineering, 64(6):1326–1334.
Ke, G., Meng, Q., Finley, T., Wang, T., Chen, W., Ma,
W., Ye, Q., and Liu, T.-Y. (2017). LightGBM: A
Highly Efficient Gradient Boosting Decision Tree. In
Guyon, I., Luxburg, U. V., Bengio, S., Wallach, H.,
Fergus, R., Vishwanathan, S., and Garnett, R., editors,
Advances in Neural Information Processing Systems,
volume 30, pages 3146–3154. Curran Associates, Inc.
Kleinbaum, D. G. and Klein, M. (2010). Introduction to
Logistic Regression, pages 1–39. Springer New York,
New York, NY.
Liu, C., Springer, D., Li, Q., Moody, B., Juan, R. A.,
Chorro, F. J., Castells, F., Roig, J. M., Silva, I., John-
son, A. E., Syed, Z., Schmidt, S. E., Papadaniil, C. D.,
Hadjileontiadis, L., Naseri, H., Moukadem, A., Di-
eterlen, A., Brandt, C., Tang, H., Samieinasab, M.,
Samieinasab, M. R., Sameni, R., Mark, R. G., and
Clifford, G. D. (2016). An open access database for
the evaluation of heart sound algorithms. Physiologi-
cal Measurement, 37.
Lopes, S. A. V. D. A., Guimar
˜
aes, I. C. B., Costa, S. F.
d. O., Acosta, A. X., Sandes, K. A., and Mendes, C.
M. C. (2018). Mortality for critical congenital heart
diseases and associated risk factors in newborns. A co-
hort study. Arquivos Brasileiros de Cardiologia, 111.
McLeod, S. (2019). Z-Score: Definition, Calculation and
Interpretation.
Naseri, H. and Homaeinezhad, M. R. (2013). Detection and
boundary identification of phonocardiogram sounds
using an expert frequency-energy based metric. An-
nals of Biomedical Engineering, 41(2).
Oliveira, J. H. S. (2018). Subject-driven supervised and
unsupervised Hidden Markov Models for heart sound
segmentation in real noisy environments. PhD thesis,
Faculdade de Ci
ˆ
encias da Universidade do Porto.
Oliveira, R., Martins, L., Andrade, H., Pires, A., and
Castela, E. (2013). Sopro card
´
ıaco pedi
´
atrico: es-
tudo de s
´
erie de casos. Revista Portuguesa de Cl
´
ınica
Geral, 29(6).
OPAS/OMS (2017). OPAS/OMS Brasil - Doenc¸as cardio-
vasculares. Available at https://www.paho.org/bra/
index.php?option=com content&view=article&id=
5253:doencas-cardiovasculares&Itemid=1096.
Pedrosa, J., Castro, A., and Vinhoza, T. T. (2014). Auto-
matic heart sound segmentation and murmur detec-
tion in pediatric phonocardiograms. 2014 36th Annual
International Conference of the IEEE Engineering in
Medicine and Biology Society, EMBC 2014, (Decem-
ber 2015):2294–2297.
PNUD (2019). PNUD: mis
´
eria priva brasileiros
de condic¸
˜
oes b
´
asicas de vida. Available at
https://nacoesunidas.org/pnud-miseria-priva-38-
dos-brasileiros-de-condicoes-basicas-vida/.
Sh-Hussain, H., Salleh, S. H., Ariff, A. K., Alhamdani,
O., Tian-Swee, T., Noor, A. M., Oemar, H., and Yu-
soff, K. (2012). Application of multipoint auscultation
for heart sound diagnostic system (MAHDS). 2012
11th International Conference on Information Sci-
ence, Signal Processing and their Applications, ISSPA
2012.
Sh-Hussain, S., Kamarulafizam, I., Noor, A. M., Harris,
A. A., Oemar, H., and Yusoff, K. (2013). Classifi-
cation of heart sound based on multipoint auscultation
system. 2013 8th International Workshop on Systems,
Signal Processing and Their Applications, WoSSPA
2013.
Zupan, J. (1994). Introduction to artificial neural network
(ANN) methods: what they are and how to use them.
Acta Chimica Slovenica, 41(September):327–327.
BIOSIGNALS 2021 - 14th International Conference on Bio-inspired Systems and Signal Processing
234
