
GREE-COCO: Green Artificial Intelligence Powered Cost Pricing
Models for Congestion Control
Meghana Kshirsagar
1
a
, Tanishq More
2
, Rutuja Lahoti
2
, Shreya Adgaonkar
3
, Shruti Jain
3
,
Conor Ryan
1
and Vivek Kshirsagar
3
1
Biocomputing Developmental Systems, University of Limerick, Ireland
2
Department of Information Technology, Government College of Engineering, Aurangabad, India
3
Department of Computer Science, Government College of Engineering, Aurangabad, India
Keywords: Intelligent Transportation, Traffic Management, Congestion Control, Cost Pricing, YOLOv3, F-RCNN,
Mask R-CNN, Energy Efficient.
Abstract: The objective of the proposed research is to design a system called Green Artificial Intelligence Powered
Cost Pricing Models for Congestion Control (GREE-COCO) for road vehicles that address the issue of
congestion control through the concept of cost pricing. The motivation is to facilitate smooth traffic flow
among densely congested roads by incorporating static and dynamic cost pricing models. The other
objective behind the study is to reduce pollution and fuel consumption and encourage people towards
positive usage of the public transport system (e.g., bus, train, metro, and tram). The system will be
implemented by charging the vehicles driven on a particular congested road during a specific time. The
pricing will differ according to the location, type of vehicle, and vehicle count. The cost pricing model
incorporates an incentive approach for rewarding the usage of electric/non-fuel vehicles. The system will be
tested with analytics gathered from cameras installed for testing purposes in some of the Indian and Irish
cities. One of the challenges that will be addressed is to develop sustainable and energy-efficient Artificial
Intelligence (AI) models that use less power consumption which results in low carbon emission. The GREE-
COCO model consists of three modules: vehicle detection and classification, license plate recognition, and
cost pricing model. The AI models for vehicle detection and classification are implemented with You Only
Look Once (YOLO) v3, Faster-Region based Convolutional Neural Network (F-RCNN), and Mask-Region
based Convolutional Neural Network (Mask RCNN). The selection of the best model depends upon their
performance concerning accuracy and energy efficiency. The dynamic cost pricing model is tested with both
the Support Vector Machine (SVM) classifier and the Generalised Linear Regression Model (GLM). The
experiments are carried out on a custom-made video dataset of 103 videos of different time duration. The
initial results obtained from the experimental study indicate that YOLOv3 is best suited for the system as it
has the highest accuracy and is more energy-efficient.
a
https://orcid.org/0000-0002-8182-2465
1 INTRODUCTION
Universally there is a severe issue of growing traffic
congestion causing severe traffic problems which is
contributing to the rise of pollution in cities and
towns, leading to emissions of carbon monoxide gas
and smog. Further, the emissions from fossil fuel
vehicles produce greenhouse gases contributing to
warmer temperatures. Hence a need for traffic
analysis is essential for exploring the possibility of
building large-scale infrastructures needed for public
transportation. Such systems, which are critical
components of any government, can be utilised to
provide communities with the most effective,
functional, and environmentally friendly
transportation. This research work’s primary
motivation is to design a system that collects traffic
data for analysing traffic volume measurements
from video recordings in different weather
conditions. To alleviate congestion problems,
various states and legislatures worldwide have
implemented cost pricing systems with the Pricing
strategy (U.S. Department of Transportation, 2008)
to be either Static Pricing (SP) or Dynamic Pricing
(DP). SP is fixed throughout whereas DP changes
according to various factors like timestamp and
traffic count. Singapore (DP) (Ye and S, 2012)
916
Kshirsagar, M., More, T., Lahoti, R., Adgaonkar, S., Jain, S., Ryan, C. and Kshirsagar, V.
GREE-COCO: Green Artificial Intelligence Powered Cost Pricing Models for Congestion Control.
DOI: 10.5220/0010261209160923
In Proceedings of the 13th International Conference on Agents and Artificial Intelligence (ICAART 2021) - Volume 2, pages 916-923
ISBN: 978-989-758-484-8
Copyright
c
2021 by SCITEPRESS – Science and Technology Publications, Lda. All rights reserved
implements Radio Frequency Identification (RFID)
systems, while cities like London (SP) and
Stockholm (Variable Pricing) (Börjesson and
Kristoffersson, 2018) implement Camera-based
congestion pricing systems (AECOM Consult team,
2006). Variable Pricing depends on changing the
charging rate only during the peak periods. In this
paper, the authors propose a combined approach that
applies Static Pricing for peak hours and Dynamic
Pricing for the non-peak hours. It also focuses on the
development of vehicle detection and classification
system that is energy efficient and hence contributes
towards the development of ‘Green AI’ (Schwartz et
al., 2019) sustainable models.
2 METHODS
The authors in (Song et al., 2019) proposed a
segmentation method consisting zones placed into
the YOLO v3 architecture to detect the vehicle type
and location that obtains the vehicle trajectories. The
authors in (Tourani et al., 2019) discuss a robust
method for detecting vehicles in video frames based
on Faster RCNN instead of the Residual neural
network (Resnet-50). In (Al-Ariny et al., 2020) used
the Mask RCNN instance segmentation model for
performing vehicle detection. In their proposed
approach, once objects are detected, corner points
are extracted and then tracked. In (Dorbe et al.,
2018), the authors built a system that performs
segmentation on an input image for detecting the
license plate and vehicle type classification. In
(Clements et al., 2020), the authors discuss in detail
the technologies that can be implemented for
congestion pricing applications, such as Vehicles-
miles-travelled, Zone-based tolling and Credit-based
pricing.
3 PROPOSED SYSTEM
ARCHITECTURE
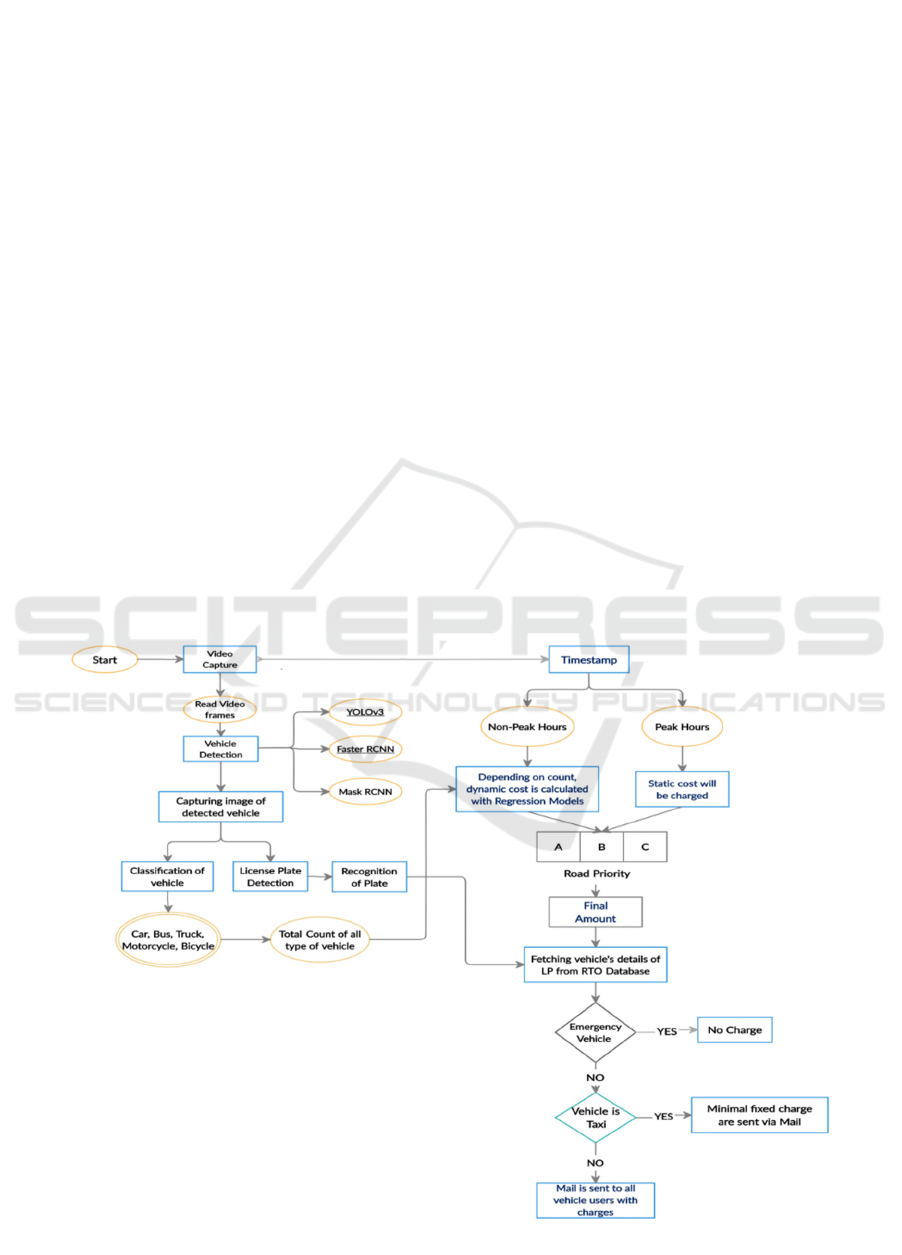
Figure 1 describes the proposed integrated system
for congestion control. The video is captured and
given as an input to extract frames for performing
vehicle detection. The vehicle detection module is
implemented with three algorithms- YOLOv3 (Song
et al., 2019), Faster RCNN (Tourani et al., 2019) and
Mask RCNN (Al-Ariny et al., 2020). The detected
vehicle’s image is captured and further processed for
classification of the vehicle into five classes (car,
Figure 1: Proposed Architecture for GREE-COCO.
GREE-COCO: Green Artificial Intelligence Powered Cost Pricing Models for Congestion Control
917

bus, truck, bicycle, motorcycle), and license plate
detection and recognition. Based on the video
timestamp, the categorisation of peak and non-peak
hours is done. Along with the vehicle classification,
we calculate the total and individual count of the
vehicle to calculate the congestion charge for non-
peak hours. In contrast, the cost for peak hour is
static. The user’s details of the recognised license
plates of all vehicles are retrieved from the Regional
Transport Office (RTO) database, the Indian
government organisation responsible for maintaining
a database of drivers and vehicles for various states
of India, for which the Indian Government has
granted us access. Similarly, the detail of Irish
vehicles owners is accessed from the Transportation
Department. Based on the information from the
database, if a vehicle is classified as an emergency
service vehicle, it is exempted from the congestion
charge. If the vehicle is a taxi, then a separate
minimal cost is decided and sent via Email, and for
all other vehicle users, an Email is sent with details
of the congestion charge.
3.1 Vehicle Detection and Counting
In order to perform Vehicle Detection, Linear filters
are used for video pre-processing to correct the non-
uniform lights or colour and intensity adjustment.
Convolution operation performs linear filtering,
which is a technique in which the value of output
pixel is linear combination of the values of
neighbouring input pixel. The obtained weight
matrix is called as convolution kernel. The initial
step is to load an input video as a number of images.
The splitting frame rate can be monitored. To reduce
the noise, we need to blur the input image with
Gaussian Blur filter then convert it to grey scale.
Different morphological operations are applied to
enhance the edges of the image. To reveal the object,
we binarize the image then adaptive thresholding is
applied to eliminate irrelevant important
information. This is done to remove all the other
entities other entities except from image.
This module detects, recognises, and tracks the
vehicles in the video frames and classifies them into
one of the five classes as mentioned above. The
accurate selection of a region of interest (ROI) is
vital to decrease the false positives in the detection
and classification of vehicles. ROI provides the
flexibility of just working within a particular area
instead of manipulating the whole video. When a
specific vehicle is present in the ROI, then it gets
detected and the count increases. The Deep Sort’
algorithm (Wojke et al., 2017) is implemented for
calculating the count of vehicles by tracking vehicle
movements within a tracking zone labelled as a
virtual loop. This algorithm is known for the quality
real-time object tracking and can perform both
single object tracking and multiple object tracking.
For further analysis, the total count of vehicles is
stored in a database. The statistics of vehicles are
then given as an input to the dynamic congestion
pricing model to determine the congestion cost.
3.2 Cost Pricing Model
According to the cost pricing model, the user will be
charged for using a road as defined by its priority
level and time of usage. The factors used to calculate
the cost are the time of the day, the priority of the
road, season, and the vehicle class. A priority is
assigned to all types of roads, congested as well as
non-congested. The priority is directly proportional
to the number of vehicles on that road. The cost of
peak hours is constant, while that of the non-peak
hours is dynamic. The non-peak hour cost will be
calculated based on vehicle count at that particular
instance of time.
3.2.1 Peak Hours
For Peak Hours, the static prices will be charged to
all vehicles. Charges for trucks and buses will be
higher than that of cars and motorcycles. Emergency
vehicles such as ambulance, fire-trucks will be
exempted from this system. Moreover, Government
vehicles (for e.g. Police Department vehicles) will
not be charged.
3.2.2 Non-peak Hours
We have divided the total traffic count for a
particular hour into different classes. Each class has
a class width of 150. The first class starts with a
threshold count of 100 vehicles (e.g. 100 - 250 1st
vehicle count class). If the total count of vehicles at
that particular hour is less than threshold count, then
no vehicle will be charged.
A, B, C represents High, Medium, and Low
Priority roads, with weight value 30, 25 and 20
respectively. The values of A, B and C were
finalised after performing a series of experiments for
calculating the total congestion cost. The above road
priority values were finalized such that the total
congestion cost for the vehicles should lie between
(0, 30) Indian Rupee (INR).
Consider Total Traffic count at a given
timestamp as T, and Total Individual Count of Car,
ICAART 2021 - 13th International Conference on Agents and Artificial Intelligence
918

Bus, Truck, and Motorcycle are C
1
, C
2
, C
3
and C
4
,
respectively.
We Define,
𝑅𝑖 =
𝐶𝑖
𝑇
(1)
Where R
i
= Ratio of particular vehicle class
contributing to traffic, where i∈ (1,4)
R
1
..R
4
representing the ratio of car, bus, truck, and
motorcycle contributing to traffic, respectively.
Ci = Count of particular vehicle class, here i∈ (1,4)
We have,
∑
𝑅𝑖
=1
(2)
We calculate the cost factor for a vehicle as
𝐶𝑓 = (𝑀𝑖 × 𝑅𝑝 )
(3)
Where C
f
= Cost Factor;
M
i
= Mean of the class in which Total traffic lies;
and R
p
= Road Priority value.
So,
𝑀𝑖 =
𝑈𝑖 𝑥 𝐿𝑖
2
(4)
Here U
i
= Upper frequency of the class in Total
traffic (T) lies while
L
i
= Lower frequency of the class in Total traffic (T)
lies.
𝐴
𝑖 =
𝑅𝑖 𝑥 𝐶𝑓
𝑇
(5)
∀ A
i
= Congestion cost of each vehicle class, where
i∈ (1,4) and
A
1
..A
4
represents the congestion cost of the car, bus,
truck, and motorcycle, respectively.
For electric vehicles, there is an incentive of a 0.7
reduction in the cost, as shown in equation 6.
𝐴
𝐸𝑖 = (
𝐴
−(
𝐴
𝑖×0.7))
(6)
∀AE
i
= Congestion cost of each electric vehicle
class, where i ∈ (1,4) and AE
1
..AE
4
represents
electric vehicle congestion cost of the car, bus, truck
and motorcycle respectively.
The cost for a particular road, for example, road
‘A,’ is calculated using equations 1 to 6. The vehicle
detection and classification module are used to
detect vehicles on road ‘A’. After classifying and
finalising the cost of the vehicles, the image is
captured and given as an input to the next module,
License Plate Detection and Character Recognition.
3.3 License Plate Detection and
Recognition
Algorithm 1: DLP: Detection of License Plate.
Input: Coloured Image A of a vehicle
Output: License plate number
1: START:
2: image Input Image
3: grayscale convert image to gray
4: for each pixel in image:
5: pixel=pixel/255.0
6: end for
7: R_image resize (224,224)
8: Input R_image to Wpod network
9: License_Plates[] save license plates
10: for license_plate in License_Plates:
11: x,y,x+h,y+w get coordinates of
license_plate
12: A crop image with the coordinates x,y,x+h,y+w
13: G_A cv2.cvtColor(A,
cv2.COLOR_BGR2GRAY)
14: M_A Perform noise reduction and morphological
operations on G_A
15: Draw contours cv2.findContours(binary,
cv2.RETR_EXTERNAL,
cv2.CHAIN_APPROX_SIMPLE)
16: for contours in Contours:
17: B crop & save contours
18: Input cropped_contour to Letter &Digit recognition
model
19: A[] append the predicted the letter
20: end for
21: end for
22: Display A
23: END
The module uses a set of a convolutional neural
network, computer vision techniques with OpenCV,
and character recognition as shown in Algorithm
DLP. The license plate character recognition is
performed using OpenCV methods such as changing
colour spaces, image filtering, edge detection and
image contours. The process is divided in three
steps. The first part implements a pre-trained model
Wpod Net (Silva and Jung, 2018), to detect and
extract the license plates from the vehicle images.
Wpod Net is known for its ability to detect multiple
license plates from a single frame. In the second
part we perform plate character segmentation.
Finally, the CNN recognises the digits from the
extracted license plate. The extracted license plate
image follows a series of transformations, as
illustrated in Figure 2.
GREE-COCO: Green Artificial Intelligence Powered Cost Pricing Models for Congestion Control
919
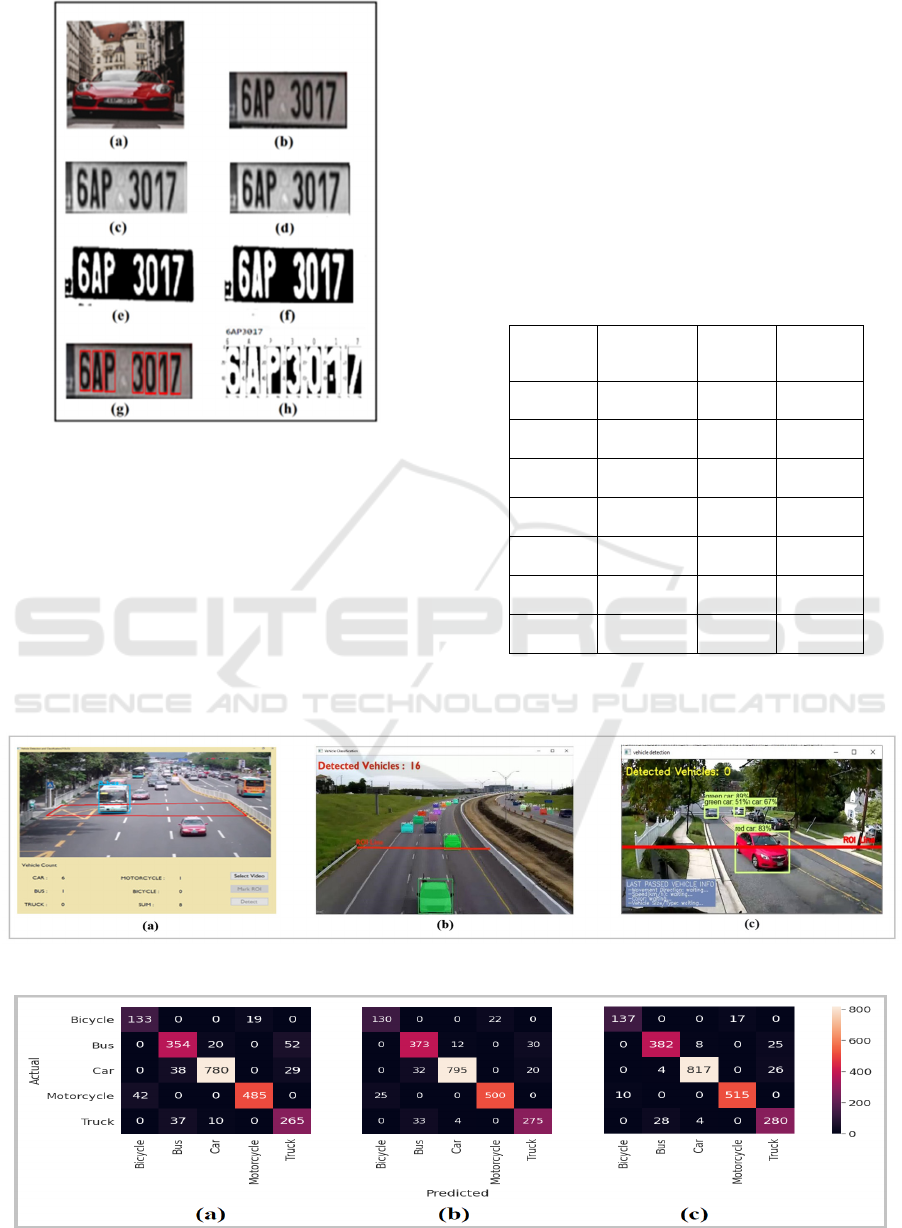
Figure 2: License Plate and Character Recognition in
different scenarios. (a) Vehicle, (b) Detected Plate, (c)
Gray LP, (d) Blur LP, (e) Binary LP, (f) Dilation LP,
(g)Character detection, (h) Digit Recognition.
The license plate number of the vehicle obtained
from the License Plate Recognition module is stored
in a database. License Plate database is connected to
the RTO database to fetch the user’s details. The
RTO database attributes are vehicle type,
registration number, date of issue, fuel or electric
based engine, and the user’s detail. The charges for
the user are sent on their Email.
4 RESULTS
This section will discuss the performance of all three
modules based upon accuracy and energy efficiency.
4.1 Vehicle Detecting and
Classification
Here we discuss the performance of the AI models.
4.1.1 Video Dataset
Table 1: Test Video Dataset.
Dataset
Time
Duration
No of
videos
No of
frames
D1 10 sec 30 7780
D2 15 sec 25 9780
D3 30 sec 17 13380
D4 1 min 8 12120
D5 2 min 12 37200
D6 5 min 11 87000
Total 103 167260
The vehicle detection and classification module were
tested on 103 videos, which were a combination
Figure 3: Vehicle Detection with (a) YOLOv3 (b) Mask RCNN (c) Faster RCNN.
Figure 4: Confusion Matrix for vehicle counting and classification with (a) YOLOv3, (b) Faster RCNN, (c) Mask RCNN.
ICAART 2021 - 13th International Conference on Agents and Artificial Intelligence
920
of public datasets (Chan and Vasconcelos, 2005)
(Wang et al., 2019) and YouTube videos of varying
time duration. In Table 1, each Dataset D1, D2 and
D3 consists of a total of 30, 25 and 17 videos of
10sec, 20sec and 30sec time duration respectively.
The total number of frames in the three datasets are
7780, 9780 and 13380. In a similar way, there are 8,
12 and 11 videos of 1 min, 2 min and 5 min in
dataset D4, D5 and D6.
4.1.2 Classification Accuracy
Figure 3(a), (b), (c) displays the output of vehicle
detection and classification modules with all the
three algorithms which are compared to identify the
best suited model. Figure 4 shows the confusion
matrices for vehicle counting and classification
models for all the three approaches which highlight
that Mask RCNN has the highest accuracy. Each cell
in the matrix describes the accuracy for a specific
class. For testing the model, the video datasets as
illustrated in Table 1, were used.
4.2 Cost Pricing with SVM and GML
The training dataset of the cost pricing model was
created using the NumPy library for 10,000
(465days) hours of data. The dataset consists of a
count of individual vehicle classes, the total count of
vehicle, road priority, and the expected particular
cost of each vehicle class. In the dataset the car
count lies between n (0, 400) per hour and, the bus
count is in the range (0, 80) per hour. The
Motorcycles, count varies from 0 to 550 while the
truck count lies in the range 0 to 4.
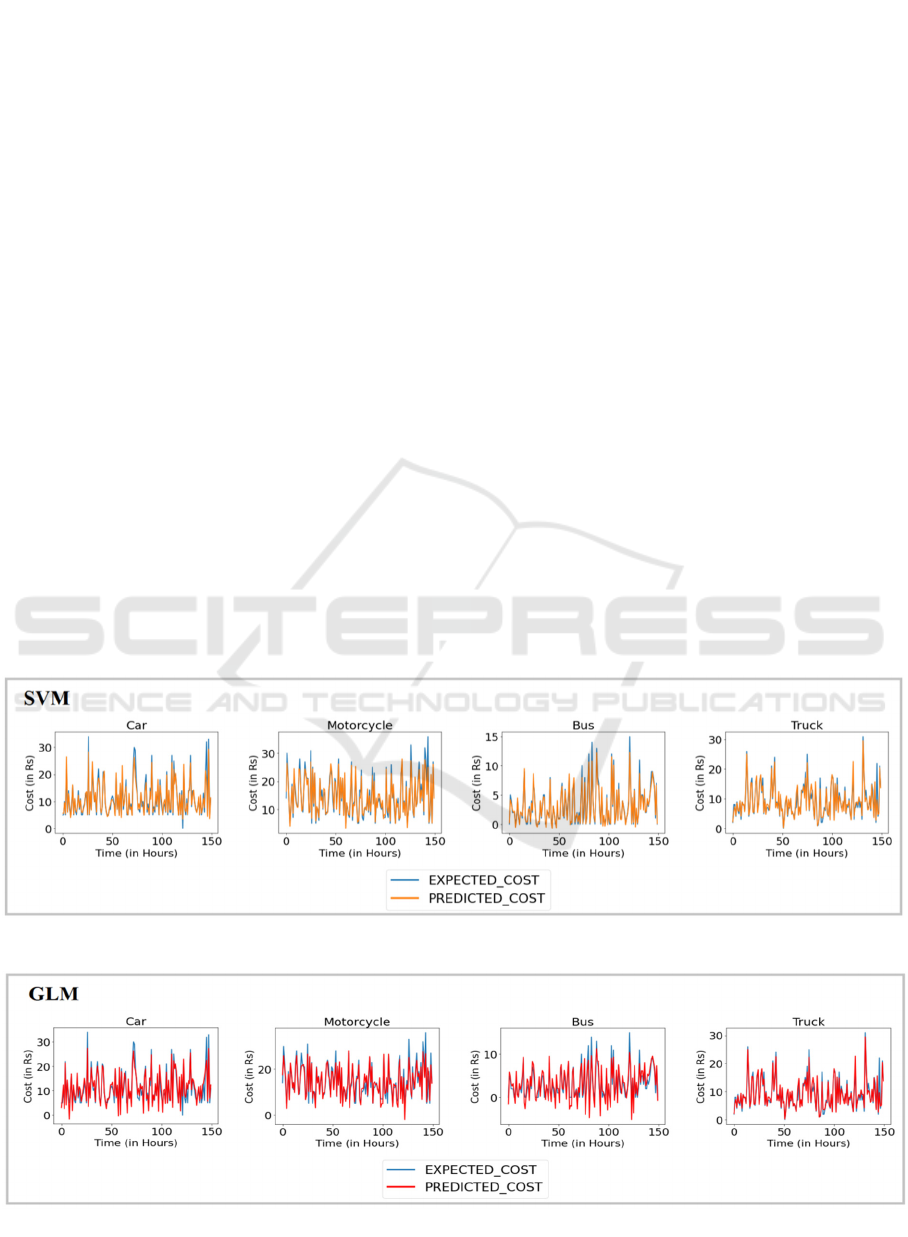
Figure 8 represents the data used for the training
SVM and GLM regression models, which predicts the
congestion charge for each vehicle class depending
upon peak and non-peak hours. The testing dataset
consisted of 1000 (41 days) hours of data.
4.3 Accuracy of Regression Models
The SVM and GLM models are trained on cost
pricing dataset as mentioned in (4.2) to predict the
congestion charge of vehicles at a particular hour.
Figure 5 (a) and 5 (b) illustrate the actual vs.
predicted congestion charge of Car, Motorcycle, Bus
and Truck for 100 hours respectively
4.4 License Plate Recognition
For recognition of a License Plate, we used a
publicly available dataset (Esther, 2018) on Kaggle.
The Data Set comprised 42,000 images. The dataset
Figure 5 (a): Expected vs. Predicted cost for different vehicle classes with SVM.
Figure 5 (b): Expected vs. Predicted cost for different vehicle classes with GLM.
GREE-COCO: Green Artificial Intelligence Powered Cost Pricing Models for Congestion Control
921
was split into the ratio of 80:20 for training and
testing the model. Mobile net pre-trained network
(Howard et al., 2017) was used to save
computational energy and time. The model was
trained for 50 epochs with a batch size of 64. The
training loss obtained was 0.0809, and the accuracy
was 0.9749.
4.5 Estimation of Energy Efficiency
The power consumed by the models on both
software and hardware platform was calculated,
which helped towards ranking the models according
to their energy consumption and carbon emission.
The hardware testing was performed on both CPU
and GPU platforms (Strubell et al., 2019). System
requirements for both CPU and GPU are X86_64
OS (Ubuntu 18.04) and 8GB RAM. Hardware
requirements for CPU are Packages, Core or
Noncore system and Dram.
The hardware used for the GPU was an “Nvidia-
GTX, 1050” with the latest drivers from Nvidia June
2020 release. The Python library ‘Energy Usage’
was used to calculate the energy consumption of
models which is based on ‘Running Average Power
Limit’ (RAPL) technology and supports the Nvidia-
smi program. The testing was performed on various
videos of duration 10sec, 20 sec, 30sec, and 40sec
on the YOLOv3 model, Faster RCNN, and Mask
RCNN model. The authors calculated the energy
consumed by the model based on baseline wattage
that calculates the computer's average power
required to initiate a process. Total wattage
calculates the energy consumed by the computer's
average power usage while the process runs. Process
wattage is the difference between the baseline and
total, highlighting the usage solely from the specific
process evaluated, and the process used is the total
amount of energy required to run the model. Carbon
emission is calculated by converting the kWh to
Carbon Dioxide (CO
2
) based on the energy mix of
the location as the emission differ based on the
country’s energy mix (García-Martín et al., 2019).
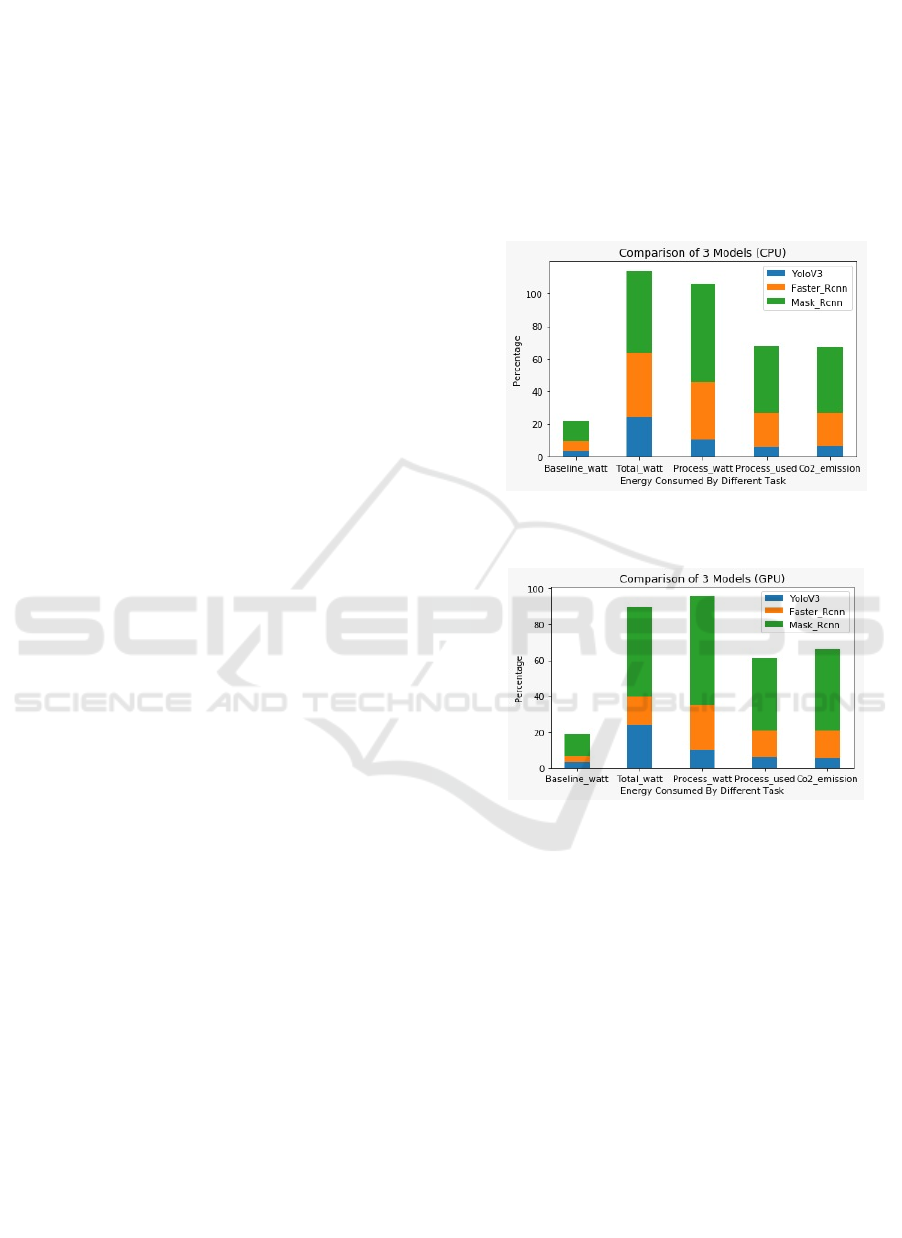
Figure 6 (a) and 6 (b) depict the total energy
consumed by different operations based on CPU and
GPU, respectively. Here the baseline wattage of all
the three models lies between 3.00 and 5.80 watts.
We can infer that more the time required to run total
processes in a model is directly proportional to CO
2
emitted by an individual model. The main difference
between the CPU and GPU performance is that GPU
requires less computational power to run a model
than CPU.
The energy estimation results are preliminary
and based on short samples of 103 videos as of now.
In future we will explore this avenue in more detail
by investigating the possibilities of parallelising the
process. This will be important especially when we
will test real time traffic data where millions of
videos may be needed to be processed and the idea
of incorporating distributed computing may lead
towards more efficient speeds while maintaining the
accuracy.
Figure 6 (a): The total amount of energy required to run a
model on the CPU.
Figure 6 (b): The total amount of energy required to run a
model on GPU.
5 CONCLUSIONS AND FUTURE
SCOPE
The research work proposes the design of an
intelligent transportation system named GREE-
COCO for managing road vehicle congestion. The
working prototype of the system is designed by
incorporating the approach of cost pricing. Traffic
data analytics is performed on 103 videos used in
experimentation. The authors tested the working
prototype on three popular multi-object detections
AI models like YOLOv3, F-RCNN and Mask-
RCNN. The comparative analysis was performed in
terms of accuracy and energy efficiency among
ICAART 2021 - 13th International Conference on Agents and Artificial Intelligence
922

models. The dynamic cost pricing model was tested
using regression models, SVM and GLM. It was
shown that YOLOv3 is best among three in terms of
accuracy, speedup while also being energy efficient.
Future work of the authors includes real-time testing
for camera-based approach in several Indian and
Irish cities. To overcome implementation challenges
like Public Acceptance, initially, the vehicles will be
charged with minimal cost. The problems related
with improper License Plate (Muddy, Snowy, Blank
or Damaged License Plate), will be mitigated by the
implementation of the RFID system in authors future
work. Moreover, Social and Political barriers can
also be overcome by making the system robust and
sustainable.
ACKNOWLEDGEMENTS
This work is supported under World Bank Technical
Education Quality Improvement Programme Seed
Grant (Government. College of Engineering,
Aurangabad) and partially supported by Science
Foundation Ireland grant #16/IA/4605.
REFERENCES
US Department of Transportation. 2008. Technologies
That Enable Congestion Pricing A Primer.
https://ops.fhwa.dot.gov/publications/fhwahop08042/f
hwahop08042.pdf
Ye, S. 2012. Research on Urban Road Traffic Congestion
Charging Based on Sustainable Development. In
Physics Procedia, 24, 1567-1572.
Börjesson, M., Kristoffersson, I. 2018. The Swedish
congestion charges: Ten years on. Transportation
Research Part A: Policy and Pra ctice, 107, 35–51.
AECOM Consult team. 2006. International Urban Road
Pricing,
http://bic.asn.au/_literature_93770/International_Urb
an_Road_Pricing.
Schwartz, R., Dodge, J., Smith, N.A., &Etzioni, O.
(2019). Green AI.
Song, H., Liang, H., Li, H., Dai, Z., & Yun, X.
2019.Vision-based vehicle detection and counting
system using deep learning in highway scenes.
European Transport Research Review, 11(1).
Tourani, A., Soroori, S., Shahbahrami, A., Khazaee, S.,
&Akoushideh, A. 2019. A Robust Vehicle Detection
Approach based on Faster R-CNN Algorithm. In 2019
4th International Conference on Pattern Recognition
And Image Analysis (IPRIA).
Al-Ariny, Z., Abdelwahab, M., Fakhry, M., &Hasaneen,
E. 2020.An Efficient Vehicle Counting Method Using
Mask R-CNN. In 2020 International Conference on
Innovative Trends In Communication And Computer
Engineering (ITCE).
Dorbe, N., Jaundalders, A., Kadikis, R., &Nesenbergs, K.
2018. FCN and LSTM Based Computer Vision
System for Recognition of Vehicle Type, License
Plate Number, and Registration Country. Automatic
Control and Computer Sciences, 52(2), 146–154.
Clements, L. M., Kockelman, K. M., & Alexander, W.
2020. Technologies for congestion pricing. Research
in Transportation Economics, 100863.
Wojke, N., Bewley, A., & Paulus, D. 2017. Simple online
and realtime tracking with a deep association metric.
In 2017 IEEE International Conference On Image
Processing (ICIP).
Silva S.M., Jung C.R. 2018 License Plate Detection and
Recognition in Unconstrained Scenarios. In: Ferrari
V., Hebert M., Sminchisescu C., Weiss Y. (eds)
Computer Vision – ECCV 2018. ECCV 2018. Lecture
Notes in Computer Science, vol 11216. Springer,
Cham. .
Chan, A., &Vasconcelos, N. Probabilistic Kernels for the
Classification of Auto-Regressive Visual Processes. In
2005 IEEE Computer Society Conference on
Computer Vision and Pattern Recognition (CVPR'05).
Wang, H., Lou, X., Cai, Y., Li, Y., & Chen, L. 2019. Real-
Time Vehicle Detection Algorithm Based on Vision
and Lidar Point Cloud Fusion. Journal of Sensors,
2019, 1–9.
Esther Swarna. 2018. English Typed Alphabets and
Numbers Dataset, Version 1. https://www.kaggle.com/
passionoflife/english-typed-alphabets-and-numbers-
dataset/version/1
Howard, A., Zhu, M., Chen, B., Kalenichenko, D., Wang,
W., Weyand, T., Andreetto, M., & Adam, H.
2017.MobileNets: Efficient Convolutional Neural
Networks for Mobile Vision Applications.
Strubell, E., Ganesh, A., & McCallum, A. 2019.Energy
and Policy Considerations for Deep Learning in NLP.
García-Martín, E., Rodrigues, C., Riley, G., &Grahn, H.
2019.Estimation of energy consumption in machine
learning. Journal of Parallel and Distributed
Computing, 134, 75-88.
GREE-COCO: Green Artificial Intelligence Powered Cost Pricing Models for Congestion Control
923
