
Geovisto: A Toolkit for Generic Geospatial Data Visualization
Ji
ˇ
r
´
ı Hynek
1 a
, Jakub Kachl
´
ık
1 b
and V
´
ıt Rus
ˇ
n
´
ak
2 c
1
Faculty of Information Technology, Brno University of Technology, Brno, Czech Republic
2
Institute of Computer Science, Masaryk University, Brno, Czech Republic
Keywords:
Geospatial Data, Geovisualizations, Visual Authoring Tools.
Abstract:
Today’s requirements for visualization of geospatial data are continually rising. Visualization authoring tools
provide only limited support for this purpose. The ability to create geovisualizations by non-programmers is
often reliant on template editing or visualization authoring tools. However, these tools are often limited either
in configuring visual parameters or interaction capabilities. In our work, we identify the main limitations of
current tools. Then, we propose design requirements and describe the implementation of Geovisto—a toolkit
combining capabilities of the React, Leaflet, and D3.js frameworks in order to provide tools for processing
generic geospatial data and creating multilayered reusable map widgets. We demonstrate our approach on
two usage scenarios from conceptually different application areas (DDoS attacks from a network monitoring
system and COVID-19 pandemics open data). Finally, we discuss the pros and cons of our approach and
outline our future work.
1 INTRODUCTION
Many people worldwide use Google Maps or GPS
navigation applications like Waze, almost daily.
Working with maps and interactive map visualiza-
tions have become ubiquitous nowadays. They have
many forms and usage scenarios, ranging from sim-
ple choropleths used in newspaper articles to spe-
cialized analytical applications for disaster manage-
ment (Huang et al., 2015) or ornitology (Xavier and
Dodge, 2014). These so-called geovisualizations
work with the geospatial data, which combines lo-
cation information, descriptive attributes (numerical
or textual), and optional temporal information (times-
tamp, duration). The geovisualizations has many
forms ranging from point markers placed on the car-
tographic maps through visualizing connections be-
tween them to heatmaps or choropleths. The interac-
tive geovisualizations offer the ability to display data
in multiple layers and enable users to explore them
at different detail levels through zooming and pan-
ning. The layers might be shown at once, enabling
the reasoning and supporting analytical tasks. How-
ever, identifying the proper visualization method for
geospatial data is often tricky, which might lead to ob-
a
https://orcid.org/0000-0002-7292-6094
b
https://orcid.org/0000-0002-0621-8778
c
https://orcid.org/0000-0003-1493-2194
scuring data perspectives essential for the users (Deg-
belo and Kauppinen, 2018).
With the growing popularity of the open data
concept, various geospatial data have become avail-
able to the general public. Nevertheless, creat-
ing meaningful geovisualizations, especially the in-
teractive ones, predominantly requires programming
skills. In the last decade, we can observe growing ef-
forts toward developing visualization authoring sys-
tems enabling creation such interactive visualizations
for non-programmers (Grammel et al., 2013; Mei
et al., 2018). The shortcoming of these tools is that
they focus mainly on 2D charts, and there are only
a few which target the geovisualizations. Moreover,
they offer only limited capabilities in terms of input
data or support for multi-layer interaction. We real-
ized that it would be useful to provide the users with a
tool that would visualize generic geospatial data, sup-
port users in authoring their use cases, and let users
analyze their data through a user-friendly interface.
In our work, we address the area of geovisual-
ization authoring tools and contribute to the research
body with: a) the identification of limitations and
shortcomings of existing tools, b) the prototype im-
plementation of Geovisto—a novel geovisualization
authoring toolkit, and c) its demonstration via two us-
age scenarios.
Hynek, J., Kachlík, J. and Rus
ˇ
nák, V.
Geovisto: A Toolkit for Generic Geospatial Data Visualization.
DOI: 10.5220/0010260401010111
In Proceedings of the 16th International Joint Conference on Computer Vision, Imaging and Computer Graphics Theory and Applications (VISIGRAPP 2021) - Volume 3: IVAPP, pages
101-111
ISBN: 978-989-758-488-6
Copyright
c
2021 by SCITEPRESS – Science and Technology Publications, Lda. All rights reserved
101

The paper is structured as follows. Section 2
overviews the related work and summarizes the short-
comings of current approaches of geovisualization
authoring tools. Section 3 presents the design require-
ments and propose the solution. Section 4 shows the
real prototype of the solution and Section 5 demon-
strates its applicability on two usage scenarios. Fi-
nally, Section 6 discusses the advantages, disadvan-
tages and outlines future research directions, and Sec-
tion 7 summarizes the paper.
2 RELATED WORK
Listing all geovisualization types is far beyond the
scope of this paper. Thus, we first introduce only
the most common two-dimensional ones. Next, we
present the visualization authoring methods with a
particular focus on authoring tools and their limita-
tions.
Most of the web mapping applications available
to the general public (e.g., Google Maps, Bing Maps,
Open Street Maps) contain only the basic features
such as route planning or adding own point mark-
ers. Moreover, their spatial analytical functionality
is often severely limited or non-existent. Similarly,
the geographic information systems (e.g., QGIS
1
or ArcGIS
2
focus rather on map-making than map
use. However, both categories can provide the car-
tographic layers through public APIs, which can be
used in the visualization authoring process.
2.1 Geovisualization Types
Geovisualizations often take advantage of combining
multiple layers where each layer presents only a sub-
set of data. The standard base layer is a cartographic
map that provides a spatial context. Further, we list
the most common types of geospatial data visualiza-
tion.
Point distribution maps represent the simplest
geovisualizations that serve for visualizing datasets
of elements containing only the location information
(1 a)). If the elements contain the location and one
descriptive numerical value, they could be plotted as
(proportional) symbol maps (1 b)). The symbol can
be a circle or a glyph whose physical size determines
the value. Symbol maps are also useful when the el-
ement has two or three descriptive attributes since we
can distinguish their size, shape, and color. More ad-
vanced modifications enable us to show even more
1
https://qgis.org/en/site/
2
https://www.arcgis.com/index.html
data, e.g., when the glyph symbol is replaced by
small 2D charts (e.g., pie/donut/bar charts). When
the dataset contains information, not for single loca-
tions but the whole regions, choropleth maps (or filled
maps) are the best option. The color fill of the re-
gion represents value (1 c)). Another type of spatial
visualization is heatmaps (or density maps) that are
common, e.g., from weather maps showing the mea-
sured temperature or precipitation (1 f)). A particu-
lar category is geovisualizations showing routes and
paths. Well-known from navigations, the basic path
maps show direction between two points. However,
in the case of flight monitoring websites or computer
network visualizations, we can naturally extend the
point-to-point to multipoint connections, also known
as spider maps (1 d)). Finally, by adding the tempo-
ral dimension, we can visualize flow maps, enabling
traffic visualization on the edges (1 e)).
2.2 Geovisualization Authoring
Approaches
We can distinguish three general approaches for au-
thoring the interactive visualizations for informative
or analytical purposes: a) programming, b) template
editing, c) authoring tools and applications.
Programmatic approaches are the most demand-
ing in terms of users’ skills and learning curve but
offer the most versatility for fine-tuning of visual
appearance and interaction capabilities. The frame-
works for developing interactive visualizations are
usually designed for use in web applications. D3 (Bo-
stock et al., 2011) is one of the most popular im-
perative frameworks nowadays, and many other li-
braries use it. It allows mapping the input data to
a Document Object Model (DOM) and transforms it
via data-driven operations. ProtoVis (Bostock and
Heer, 2009) toolkit, also leveraging the imperative
paradigm, is based on the idea of decomposing visu-
alizations into hierarchies of visual primitives whose
visual properties are data functions. The declarative
paradigm frameworks represent Vega (Satyanarayan
et al., 2015) and Vega-lite (Satyanarayan et al., 2017).
They both provide a set of building blocks for inter-
active visualization designs. They differ in the level
of abstraction and primary use cases. Vega-lite is a
high-level grammar build on top of Vega and was de-
signed for rapid prototyping of standard chart types.
Backward-compatibility allows programmers to im-
plement more advanced use cases in Vega if needed.
Template editing is the exact opposite of program-
matic approaches. It is a well-established way to cre-
ate simple charts in spreadsheet applications such as
Microsoft Excel or Apache OpenOffice. The main
IVAPP 2021 - 12th International Conference on Information Visualization Theory and Applications
102
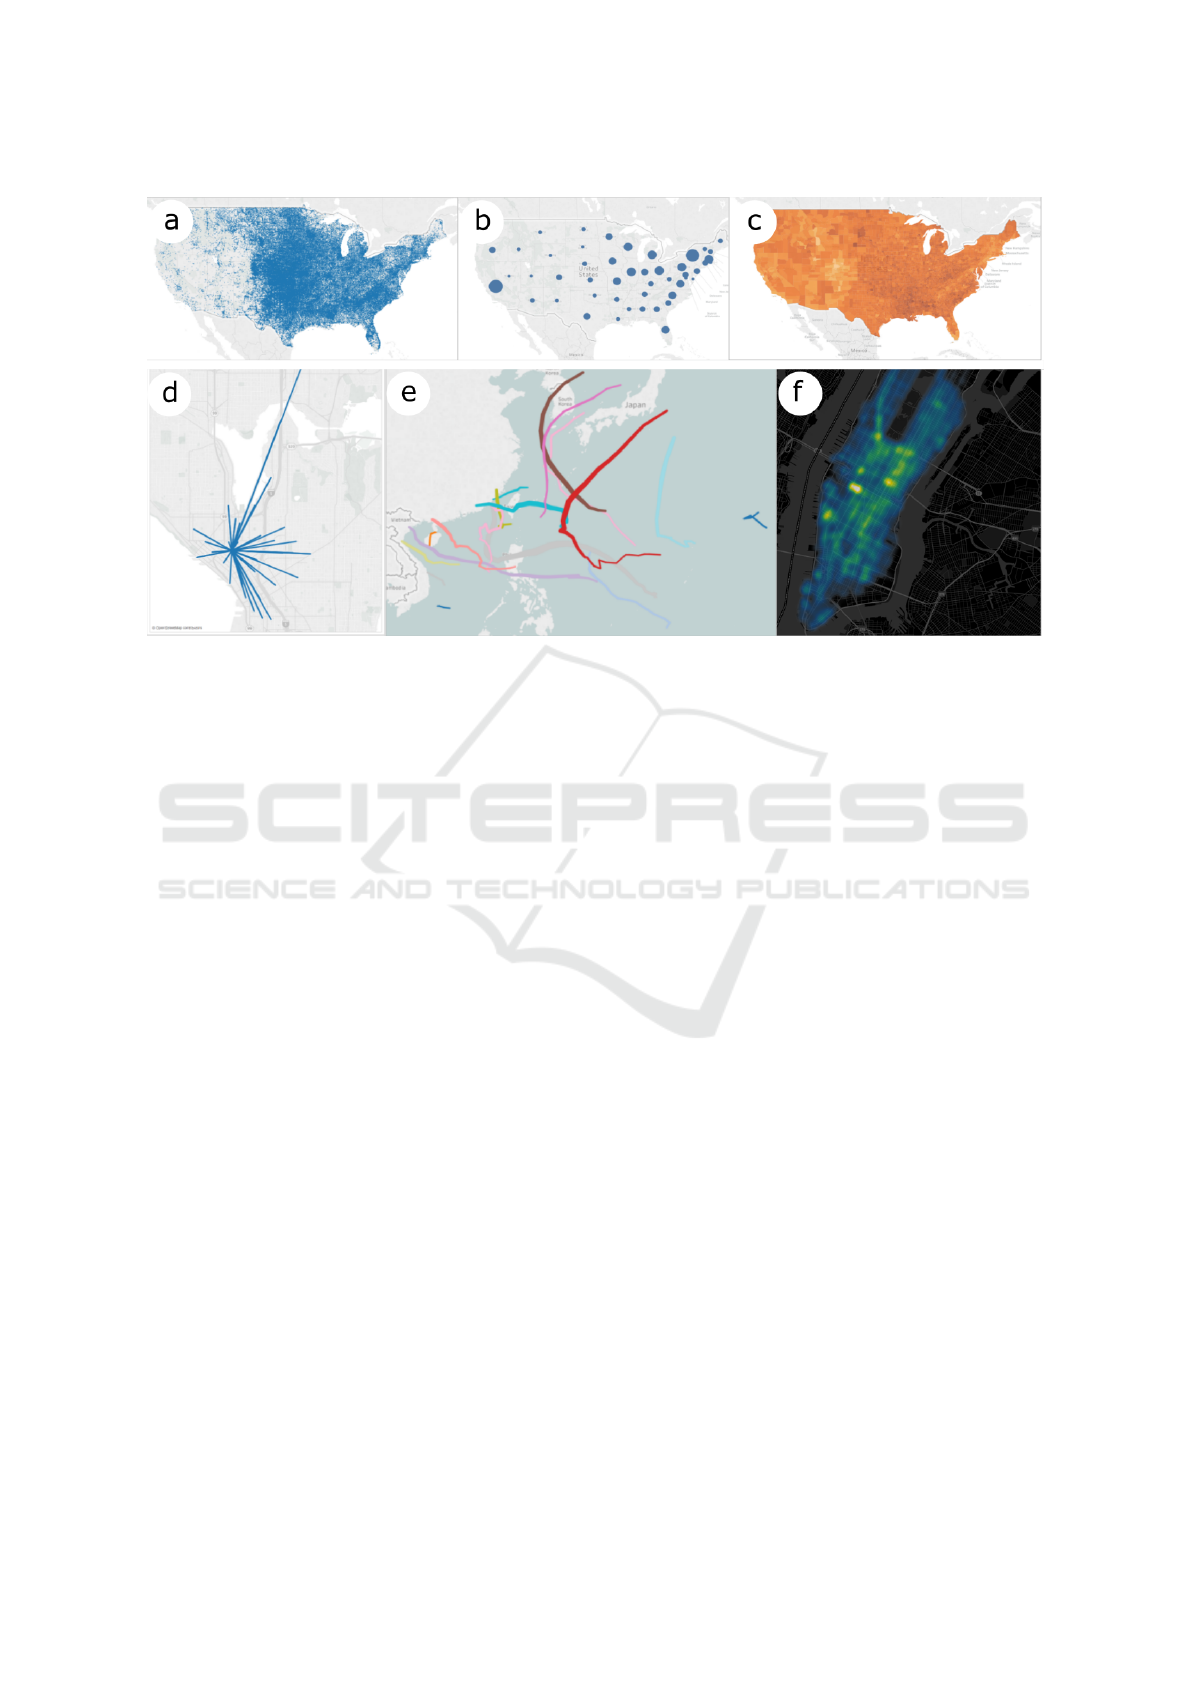
Figure 1: Common geovisualization types: a) point distribution maps; b) proportional symbol map; c) choropleth; d) spider
map; e) flow map; f) heatmap. Source: Tableau Software LLC.
characteristics are limited functionality in terms of in-
teraction and ability to visualize tabular-based data in
a pre-defined set of charts (e.g., pie charts, bar charts,
or choropleths). Users can modify only a basic set of
parameters such as color, font, chart shape, or legend
position. Template editing is also available in dash-
board platforms like Grafana (Grafana Labs, 2020)),
data analysis tools such as Tableau (Tableau Software,
LLC., 2020), or analytical frameworks such as Elas-
ticSearch in the form of extension library (Elastic-
search, 2020). They allow the users to connect their
dataset through API. On the other hand, their main
disadvantage is that they centralize their platform’s
visualization with limited support for their export.
The authoring tools build on the advantages of
the former two. We can imagine them as advanced
graphics software focusing on designing interactive
charts. They allow users to create visualizations from
basic building blocks that can be widely customized
in terms of visual appearance and interaction capa-
bilities through GUI. The output visualizations can
be exported as web components and published still
without the need for programming skills. Lyra (Satya-
narayan and Heer, 2014), Data Illustrator (Liu et al.,
2018), or Charticulator (Ren et al., 2019) represents
such tools or systems.However, their primary focus
is on authoring 2D charts, and geospatial data vi-
sualization is often limited to data presentation in a
single layer. Another downside is that the tools re-
quire specific visual design knowledge, which might
be limiting for some users. There are also examples of
domain-specific visualization authoring applications.
For example, NewsViews (Gao et al., 2014) targets on
data journalists to help them create interactive geovi-
sualizations for online news articles. GeoDa Web (Li
et al., 2015) platform leverages the cloud storage and
computing capabilities and enables data analysts to
visualize and publish maps and plots to social media
in a user-friendly way. Unlike the general visualiza-
tion authoring systems, the domain-specific ones are
simpler and reduce the need for specific visual design
knowledge.
2.3 Limitations of Current Authoring
Tools
We aim to generalize the geovisualization authoring
tool while focusing on ease of use for professional and
novice users. In general, we identified three limita-
tions of the current tools that we address in our work.
Tabular data as the primary input format. Most
of the tools expect the data in a tabular format (e.g.,
CSV), where columns are attributes (or domains) of
elements in rows. However, many of the recent data
sets are in hierarchical object formats such as JSON
or NoSQL databases. For these, additional data trans-
formation or preprocessing is necessary before their
use in visualizations. Our goal is to allow users to
upload arbitrary geospatial data in an object-oriented
format and select the visualization attributes.
Limited Number of Configuration Options. Since the
existing tools focus mainly on general 2D chart visu-
alizations, the list of available geovisualization types
and their configuration options are narrow. The most
Geovisto: A Toolkit for Generic Geospatial Data Visualization
103
frequent are choropleths, heatmaps, or spider maps.
As a result, the user can often display only a few data
attributes. Our goal is to enable a combination of vi-
sualization types in multiple layers and let users de-
cide which suits their needs.
Limited Interaction Capabilities. Finally, current
tools provide only limited interaction capabilities
with visualized geospatial data such as their filtering
or region-based selection. Our goal is to let users con-
figure the output geovisualization in line with the ex-
pected usage and allow them to set multi-layer inter-
action capabilities and cross-layer data linkage.
We propose Geovisto—the geovisualization au-
thoring toolkit, which enables configuring geospatial
data visualizations for use in web-based dashboard
applications or as a part of visual analytics workflows.
In the reminder, we present its design and prototype
implementation. Two usage scenarios demonstrate its
applicability.
3 GEOVISTO DESIGN AND
IMPLEMENTATION
The main idea of Geovisto is based on (Few, 2006)
who recommends presenting the same data in differ-
ent perspectives, but in one visualization with multi-
ple data layers. Such approach saves screen space,
emphasize data contextualization, and streamline dis-
covering hidden relations in the data.
Based on a critical reflection of the related work
and limitations of current tools and applications, we
defined four design requirements:
• Geovisto’s user interface should enable user-
defined data mapping to multiple configurable
layers.
• Geovisto should automatically transform the input
data to a generic data model and served to the user
through the UI.
• Geovisto should enable the export and import of
user-defined map configurations.
• Geovisto should follow the component-based ar-
chitecture principles, which enable its future ex-
tensibility.
In the reminder, we discuss design decisions and im-
plementation details related to these design require-
ments.
3.1 User Interface
Since we focus on geospatial data, we have chosen
the zoomable world map as our multilayer diagram’s
core. The ability to zoom and move in the map im-
proves the scalability of the widget. It can be used
for different purposes, such as visualization of global
data on world countries’ level or visualization of de-
tailed data presenting some regional aspects. This is
an advantage in contrast to the single-purpose maps.
It also provides drill-down action, which improves the
comprehensibility of data.
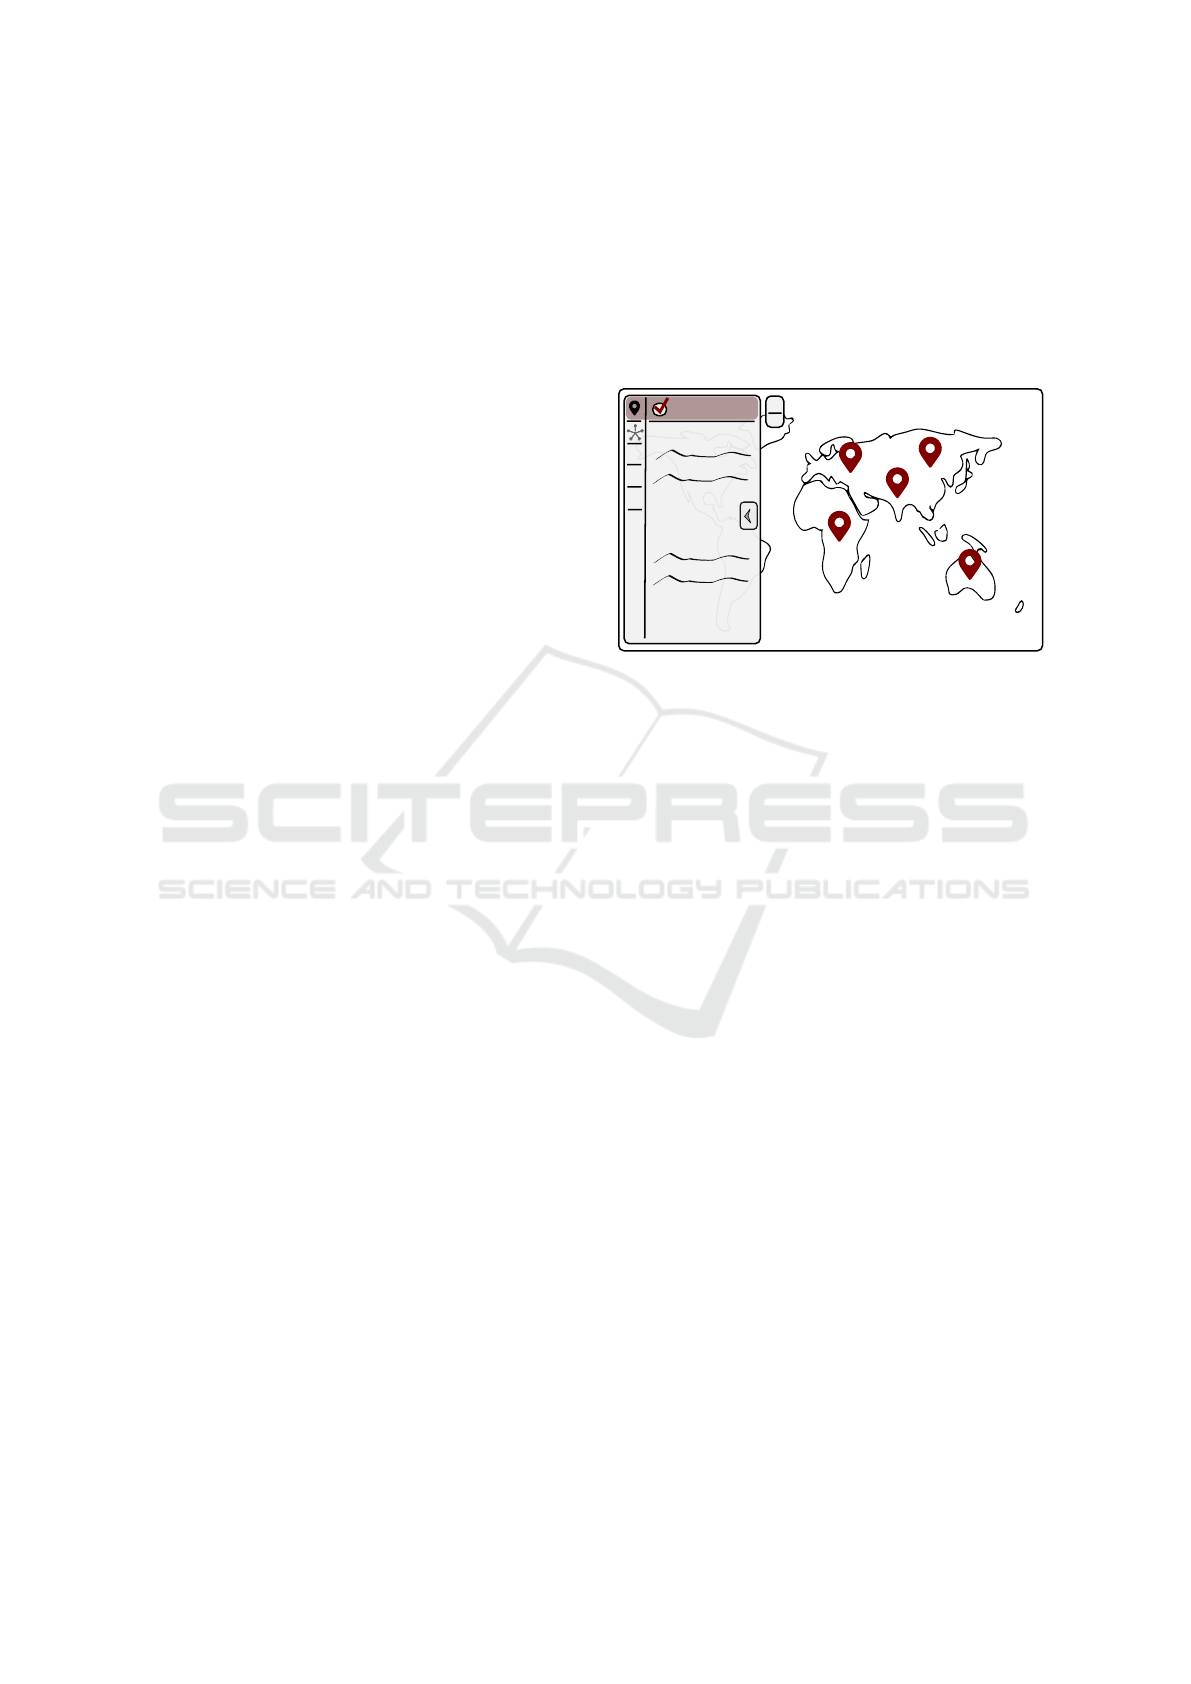
Marker layer
Data settings
Appearance
+
-
...
...
...
Figure 2: Geovisto UI design sketch. The left sidebar is
composed of tabs managing the settings of particular map
layers. It allows the users to show or hide specific layers
(e.g., the marker layer demonstrated by the figure) and con-
figures the data they display.
The user interface is sketched in Figure 2. It
is composed of independent layers that display data
from different perspectives (e.g., choropleth, mark-
ers, connections). Since the layers are independent,
it is up to the user which of them will be included in
the map.
3.2 Data Model
Considering various data models can represent the
data, it is essential to create a mechanism for process-
ing such data models. We need to provide the ability
to choose the data domains and bind them to the map
layers’ visual dimensions. Examples of problem so-
lutions can be seen in the well-known visualization
software. Grafana provides a text editor to assemble
queries to various database systems. Tableau allows
a drag-n-drop tool to map specific data columns to the
selected chart characteristics. Our approach is similar
to those examples. Every map layer provides the list
of visual dimensions, which can be associated with
data domains. The users can, manually, select the data
domains using the layer settings provided by the map
sidebar. In contrast to existing authoring tools, this
approach focuses only on geospatial data. Users can
work with multiple data domains representing geo-
graphic location formats (such as the ISO 3166 coun-
try codes) and use them in various use cases.
IVAPP 2021 - 12th International Conference on Information Visualization Theory and Applications
104
In contrast to the mentioned visualization soft-
ware, we instead try to provide a standalone reusable
widget that can be placed in a custom web front-end,
rather than provide a complex monolithic visualiza-
tion system. Hence, we work instead with non-tabular
data structures, which can be seen in data formats like
JSON or XML. This can be useful, especially for the
quick processing and visualization of custom serial-
ized data provided by web APIs (like REST API).
Since the chosen non-tabular formats are not flat
structures, we do a recursive preprocessing of the data
to construct a valid data model representing data do-
mains. Then, we provide a list of the data domains to
the users. Figure 3 shows an example demonstrating
the principle.
[
{ id: CZE, v1: [ 2, 4 ], v2: 6 },
{ id: SVK, v1: [ 8, 9 ], v2: 1 }
]
[
{ id: CZE, v1: 2, v2: 6 },
{ id: CZE, v1: 4, v2: 6 },
{ id: SVK, v1: 8, v2: 1 },
{ id: SVK, v1: 9, v2: 1 }
]
2
12
17
6
country: id
value: v1
country: id
value: v2
1. data preprocessing
2. data projection
Figure 3: An example of data composed of two records
stored in the pseudo-JSON format. Since the records con-
tain nested lists, they need to be preprocessed first. They are
expanded into four records represented by all combinations
of the values. This representation is characterized by data
domains that can be mapped into visual dimensions. The
figure shows two different projections and aggregation of
data.
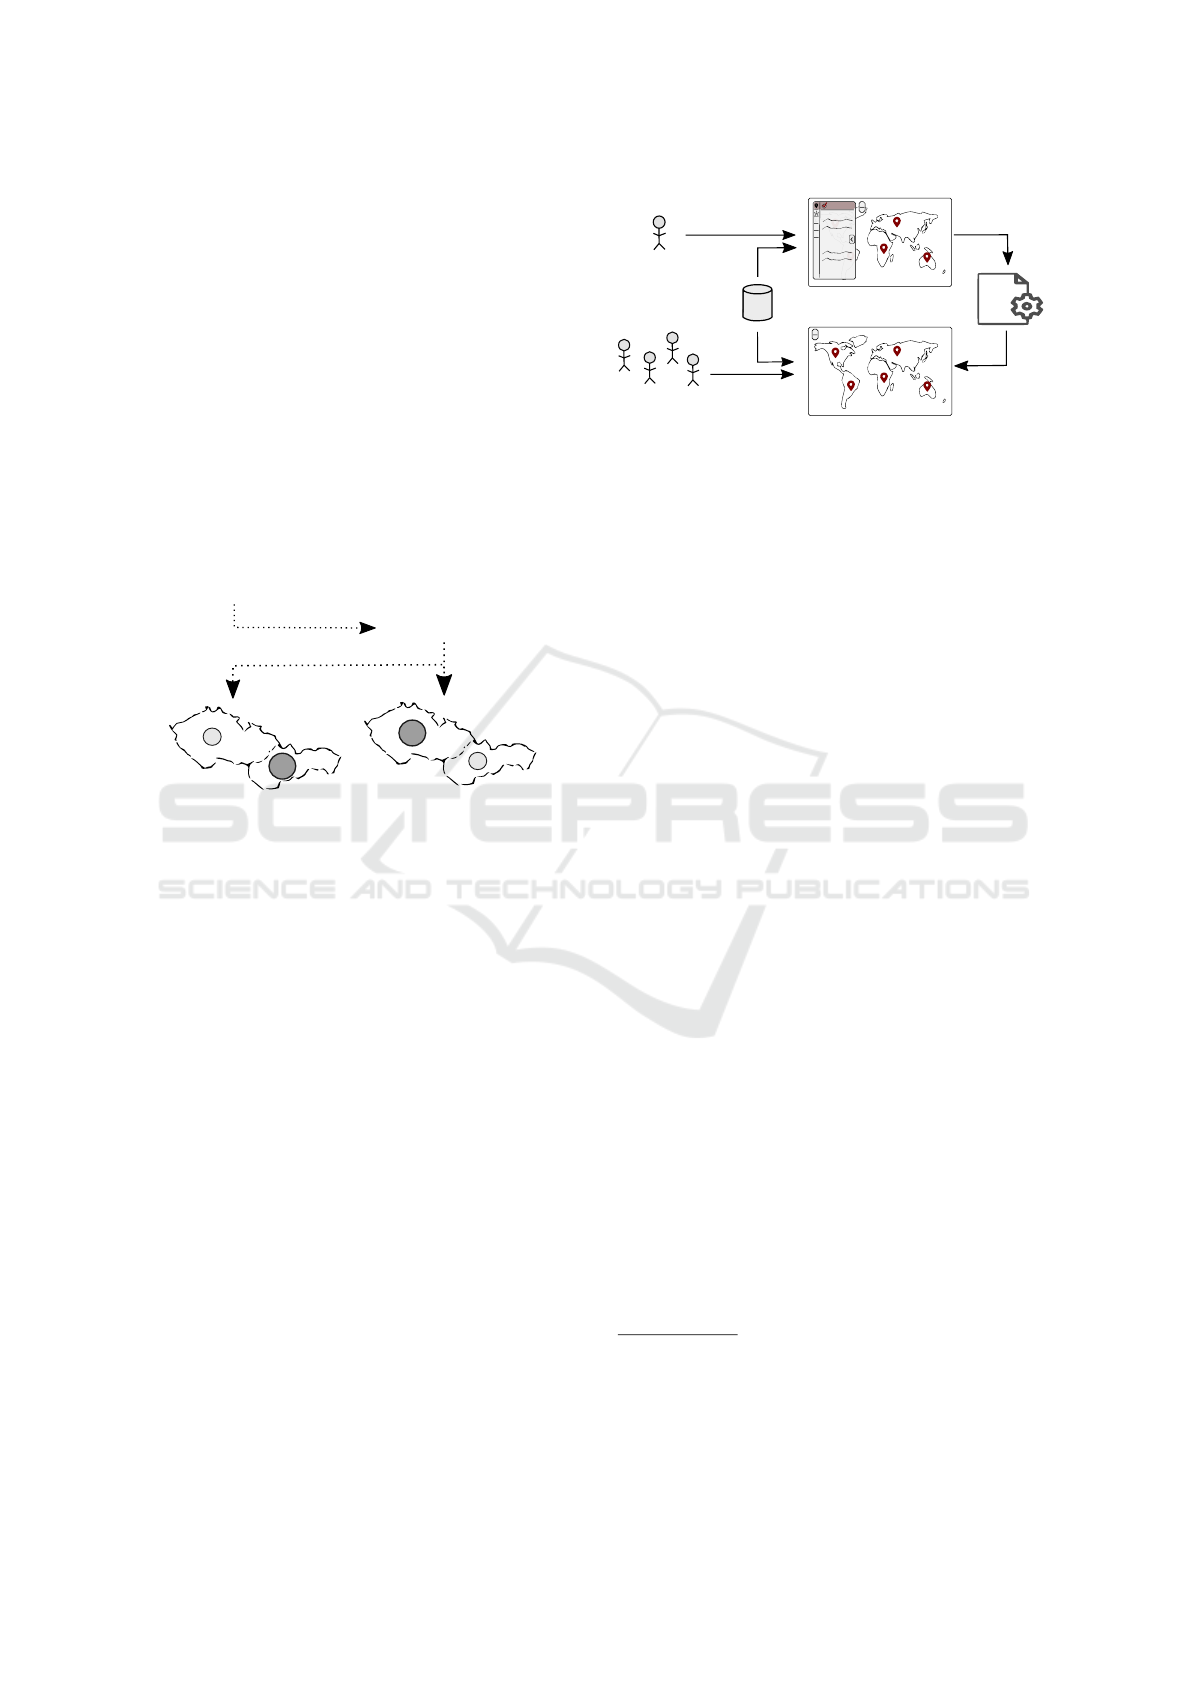
3.3 Map Configuration
Geovisto enables to create views that relate to the spe-
cific use cases. An example might be the visualization
of network anomalies in a particular region or a coun-
try’s pandemic situation. Then, these views can be
used with different datasets. Our approach provides
the ability to prepare such views and export their con-
figurations for further use. Every configuration in-
cludes selecting data domains and visual settings of
the map (e.g., zoom, position, filters). Besides that,
the map configuration defines whether its state can be
modified via the map sidebar.
The map configuration can be either exported and
imported. The users can use the configuration with
different datasets of the same data model. UI design-
ers can also customize the data visualizations without
the programming skills and export the configurations
for further use by end-users (see Figure 4).
+
-
data analyst /
UI designer
DB
Marker layer
Data settings
Appearance
...
...
...
+
-
end-users
export
import
.json
Figure 4: Illustration of visualization authoring and config-
uration sharing workflow in Geovisto. First, the UI designer
creates a projection of the data into the map layers and ex-
ports the configuration (in the JSON file). This configura-
tion can then be provided directly to the end-users or the
programmers developing the web front-end.
3.4 Architecture
Figure 5 provide a high-level architectural overview.
The component-based architecture helps to maximize
the scalability and enables the implementation of new
geovisualization layers in the future. The toolkit pro-
vides a web component implemented in ReactJS
3
,
Leaflet
4
and D3.js
5
. The toolkit, thus, can be shared
as a standalone ReactJS library and included as a wid-
get in third-party web applications. The prototype im-
plements a simple form allowing users to specify their
dataset in JSON file and import/export map configu-
rations.
There are two types of input data:
1. Geographical Data: the specification of poly-
gons and their centroids represented in GeoJSON
format. The prototype uses the specification of
world countries published by J. Sundstr
¨
om
6
but it
can be replaced with generic specifications. The
only requirement is that every GeoJSON feature
must contain a polygon identifier (e.g., country
code), which is needed to connect the geographi-
cal data with the dataset.
2. Dataset: the values stored in a serialized format
(JSON). There should be at least one data domain
representing an identifier of the geographical fea-
ture (e.g., country code).
The component renders the base map, whose core
is based on Leaflet. The library provides functions
for the projection of geographic features onto the
map and interaction capabilities with the base map.
3
https://reactjs.org/
4
Leaflet (https://leafletjs.com/) is a Javascript library for
developing interactive maps.
5
https://d3js.org/
6
https://github.com/johan/world.geo.json
Geovisto: A Toolkit for Generic Geospatial Data Visualization
105
The library also provides API for processing Geo-
JSON and integrating additional overlay layers (usu-
ally vector objects that are rendered in the form of
SVG elements—e.g., country polygons, connections,
markers). We use this to implement map layers that
display particular data perspectives (see Section 4).
Geovisto implements the infrastructure for enabling
and management of these layers. It also handles
events invoked by the map layers (user interaction)
and ships them to other layers, which can process
them (since the map layers are independent). We also
use several Leaflet plugins (e.g., the leaflet-sidebar-
v2
7
for the sidebar control) and the D3.js library to
render custom layer items.
Map
render()
(ReactJS component)
Map core
(Leaflet API)
createLayers()
importConfig()
exportConfig()
fireEvents...()
props: geodata
dataset
config
Layer2
(Leaflet plugins,
D3.js)
LayerN
(Leaflet plugins,
D3.js)
...
Layer1
(Leaflet plugins,
D3.js)
Base map
(OSM, ...)
Figure 5: Geovisto architecture overview. The map com-
ponent renders a Leaflet-based map composed of map
layers—usually SVG elements generated via the D3.js li-
brary. The map layers are independent of each other and
communicate via events. The base map represents a carto-
graphic layer provided through the open APIs (e.g., Open-
StreetMap).
4 GEOVISTO PROTOTYPE
FEATURES
Currently, the Geovisto prototype contains the choro-
pleth, marker, and connection layers. Besides them,
it includes the map layer, which can show a real-
world map based on available providers
8
(e.g., Open-
StreetMaps, CARTO). Also, the map provides tools
for filtering and data highlighting. Figure 6 shows the
user interface.
7
https://github.com/noerw/leaflet-sidebar-v2
8
https://leaflet-extras.github.io/leaflet-providers/
preview/
4.1 Choropleth Layer
The choropleth layer provides the possibility to use
GeoJSON specifications of polygons representing ge-
ographic regions and link them with the data. Un-
like basic choropleth widgets, our implementation can
process custom definitions of geographic areas. Pri-
marily, we work with the specification of world coun-
tries. However, different GeoJSON files can be used,
as described in Section 3. The advantage of this ap-
proach is the higher scalability of the layer. We can
use the layer in different situations and detail (e.g.,
countries, districts, custom areas). We can also adjust
it according to the foreign policy of specific countries
(e.g., visualization of disputed territories).
The layer provides two visual dimensions: the
country should be linked with the data domain rep-
resenting the geographic feature identifier; the value
should be paired with the data domain values the user
wants to display. The values paired with the same
region identifiers are aggregated according to the ag-
gregation function (e.g., sum or count). Color inten-
sities are used to distinguish values between the re-
gions. Figure 6 depicts an example of a choropleth
displaying the sample numerical values representing
the sum of DDoS attacks from individual countries.
4.2 Marker Layer
Another frequent use case is to visualize data related
to specific geographic locations via points (mark-
ers). For this purpose, the widget provides the marker
layer. Similarly to the choropleth polygons, every
marker has a unique identifier and geographic po-
sition (by default, we work with country centroids;
hence, we use country codes).
Besides country, value, and aggregation, the user
can link the data with the category dimension, al-
lowing visualizing categorical data via donut charts.
Thanks to the optional selection of data domains, the
users can categorize values according to different data
domains, analyzing the data.
On the other hand, marker visualization could be
problematic when many are close to each other (clut-
ter of markers). We use Leaflet.markercluster plugin
9
to overcome this issue by clustering the close markers
into groups and aggregating the values.
4.3 Connection Layer
The connection layer visualizes relations between
geospatial locations in the form of edges. The layer
enables the user to select two required dimensions:
9
https://github.com/Leaflet/Leaflet.markercluster
IVAPP 2021 - 12th International Conference on Information Visualization Theory and Applications
106
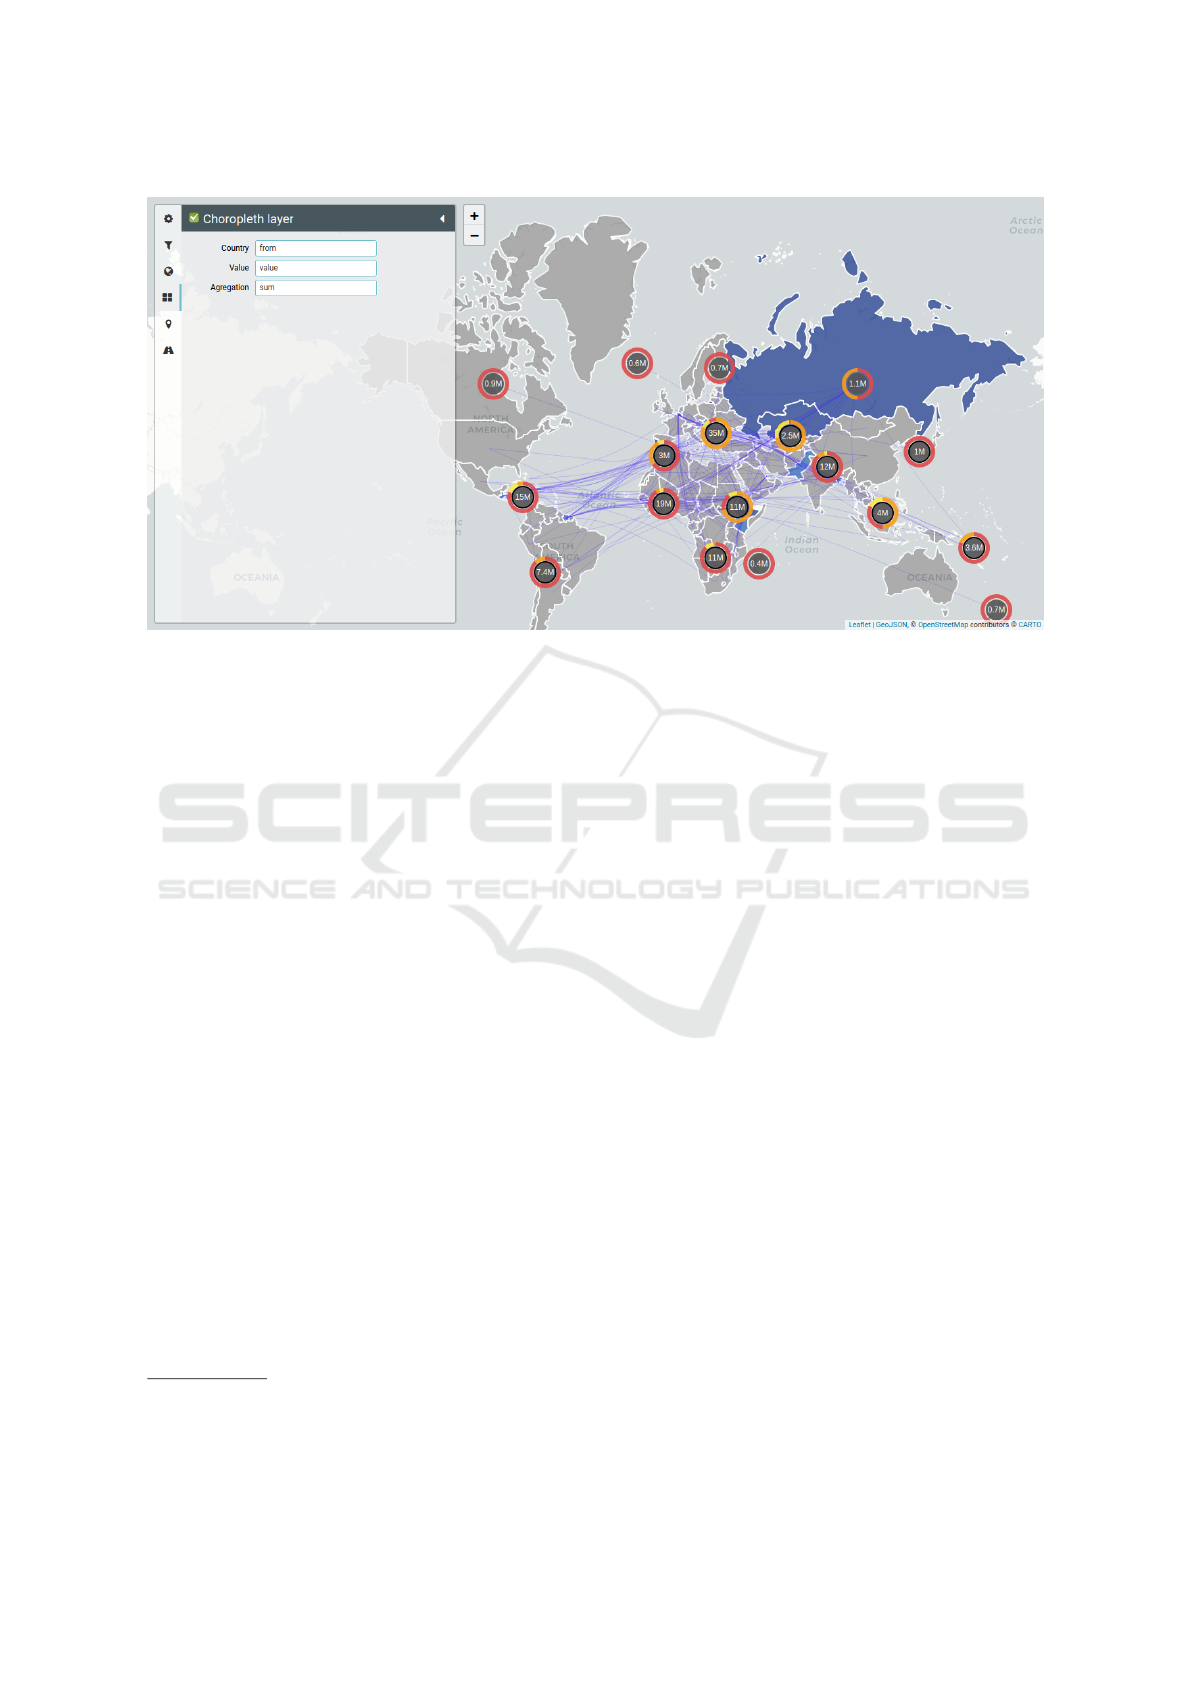
Figure 6: An example of the final map widget. It contains the sidebar (on the left) used for the configuration of layers, the
definition of filter rules, and the map’s general setting. This map contains three layers: the choropleth, marker, and connection
layer. The example shows the configuration of the choropleth layer. It links the ‘from’ data domain with the ‘country’ visual
dimension, the ‘value’ data domain with the ‘value’ visual dimension, and use the ‘sum’ function to aggregate the values.
from and to, representing nodes of the rendered edges
(by default, we work with the country centroids iden-
tified by country codes). Optionally, the user can set
the value, which affects the strength of the lines.
A common problem of connection maps is their
complexity and poor edge placement. (Holten and
Van Wijk, 2009) presented a force-directed edge
bundling rendering technique that significantly re-
duces the clutter of edges. S. Engle demonstrated its
application
10
on a flight map in the US. The example
implements the technique using the d3-force
11
mod-
ule of the D3.js library, which “implements a veloc-
ity Verlet numerical integrator for simulating physi-
cal forces on particles.” In Geovisto, we implemented
an SVG overlay layer using the Leaflet API and ren-
dered the SVG elements representing edges using the
D3.js library and the d3-force module according to
Engle’s approach. It was necessary to implement cor-
rect projections of the SVG elements into the Leaflet
map concerning the map’s zoom and current position.
The result provides a comprehensive view of edges
that can be zoomed in/out.
4.4 Filters and Highlighting
One of the frequent users’ requirements is the possi-
bility to focus on a specific subset of data. Existing
10
https://bl.ocks.org/sjengle/
2e58e83685f6d854aa40c7bc546aeb24
11
https://github.com/d3/d3-force
map tools usually display data from one perspective
(e.g., choropleth or markers), and users can filter in
these single perspectives only. The possibility to filter
the data displayed in one perspective, according to the
result of the filtering performed in another perspective
is often missing. In our approach, users can select the
element in any layer, which results in data filtering of
all related elements in other layers (see Figure 7).
The application provides the possibility to spec-
ify filter rules as conditional expressions evaluating
selected data domains’ values. Also, it allows the
users to select specific map elements (e.g., country
polygons in a choropleth) and filter all the data re-
lated to this selection. Since every map layer is in-
dependent, the communication between the layers is
implemented via the observer design pattern. Every
event passed to the layers contains the information
about the source element selected by the user. It con-
sists of the identifier of the geographic element (e.g.,
country codes) and the layer. The identifiers of geo-
graphic elements can be used in more than one layer
(e.g., choropleth country, country marker, connection
node). Then, the filtering is based on the search of
these identifiers through the map layer elements. The
search algorithm avoids the cyclic event invocation.
The elements found map are highlighted.
Geovisto: A Toolkit for Generic Geospatial Data Visualization
107
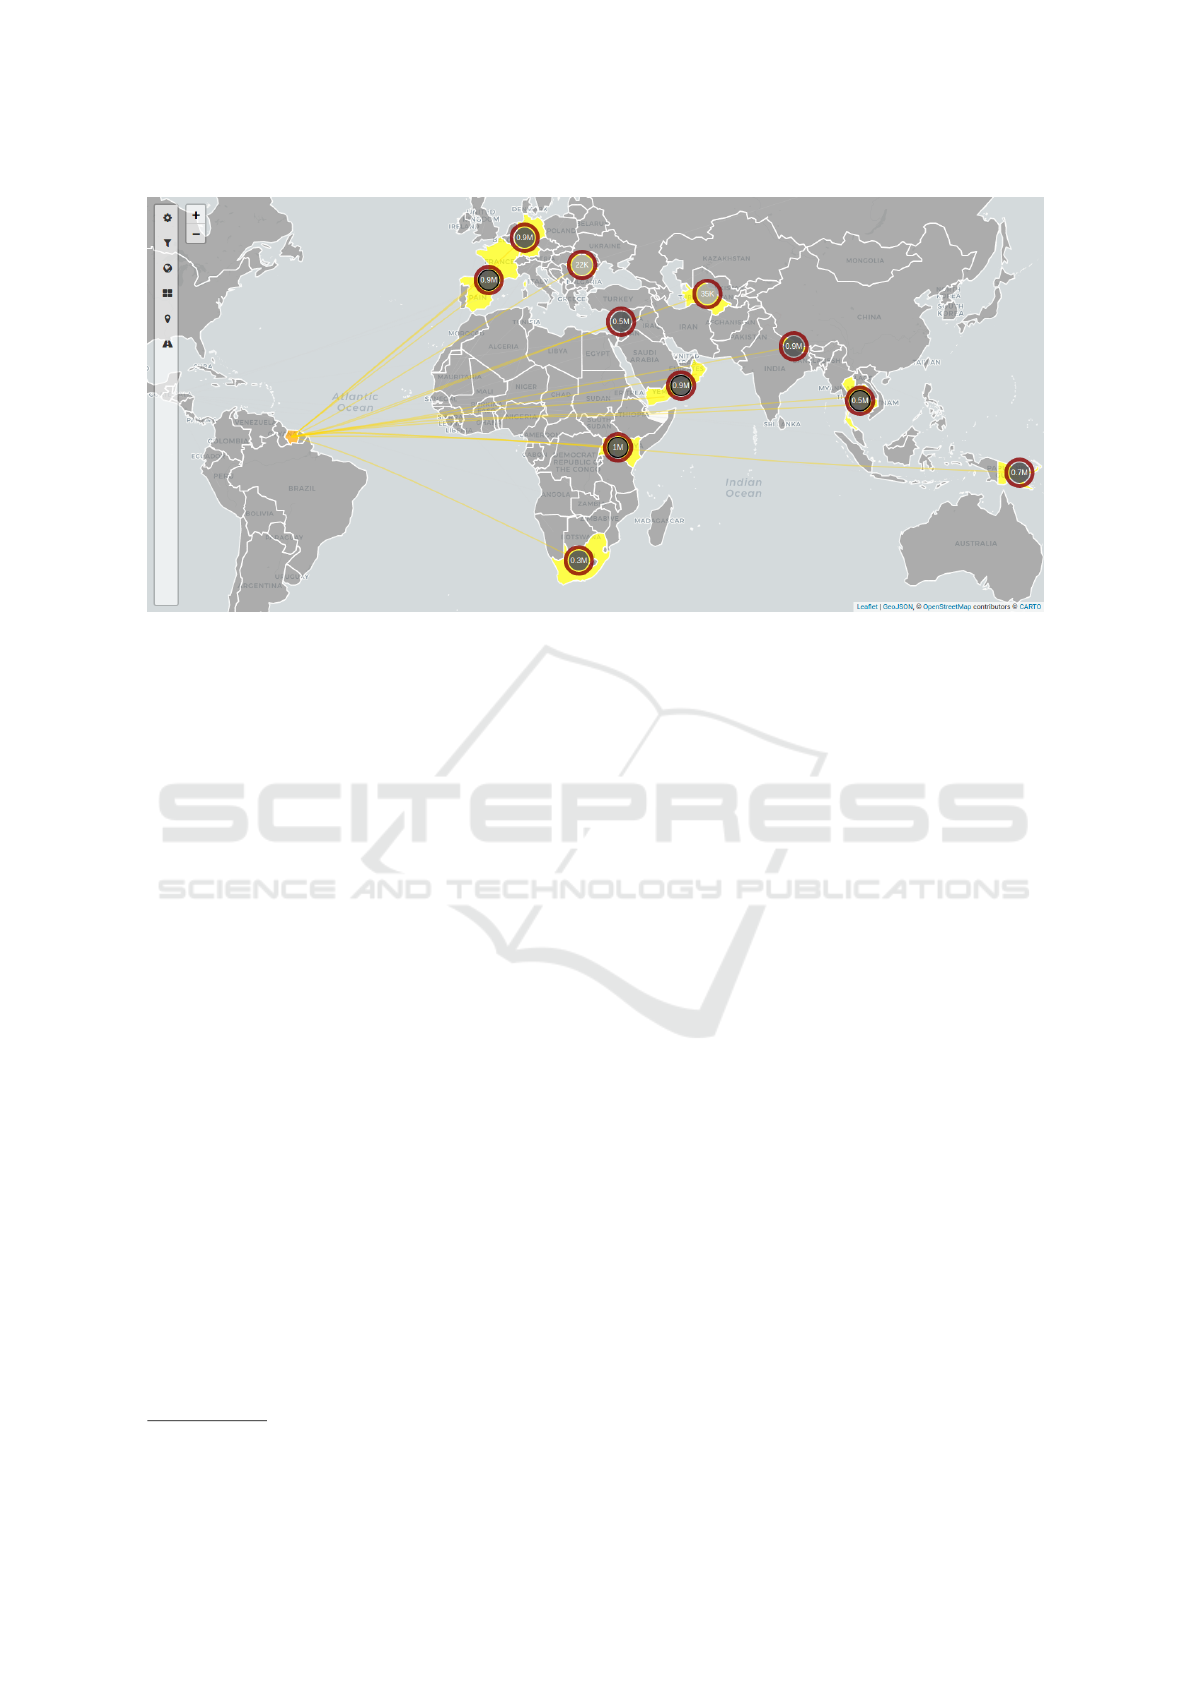
Figure 7: Geographic element selection. The selection of Suriname in the choropleth layer invokes an event that is passed to
other map layers. The connection layer handles the event, finds, and highlights all the edges which connect Suriname with
other countries. This selection invokes another event which contains all the countries connected with Suriname. It affects the
choropleth and marker layer, which highlights appropriate countries. Further invocations of events are stopped.
5 USAGE SCENARIOS
In this section, we demonstrate Geovisto on two con-
ceptually different usage scenarios.
5.1 DDoS Attack Analysis
The first scenario was performed in cooperation with
Flowmon Networks a.s.
12
, a company providing com-
plex tools for automated monitoring, analysis, and
network traffic protection. Such examples are anal-
ysis of network behavior and encrypted traffic or de-
tecting ransomware and other unknown threats (e.g.,
DDoS attacks protection). Flowmon provides dash-
boards for overall monitoring or in-depth analysis of
traffic flows (sequences of packets between a source
and destination computer). In our joint project, we
cooperate on designing and prototyping novel visual-
izations for their tools. Geovisto is one of them since
the input data also contain geographic locations (e.g.,
source and destination of DDoS attacks, country of
origin for public IP addresses).
We collaborated with the company’s UX team
on clarifying the user requirements and possible use
cases. However, they could hardly imagine the pos-
sibilities of how these could be fulfilled. Our solu-
tion helped to solve this problem. Since Geovisto
can work with custom datasets, we could let the UX
12
https://www.flowmon.com/en
team members play with the prototype independently,
which results in generating multiple map configu-
rations providing perspectives of their custom data
without any coding knowledge. This approach im-
proved mutual communication and rapidly increased
the ability to generate new geovisualization use cases.
Figure 8 presents an example of the use cases. It
displays the DDoS monitoring data, so the users can
view all attacks and see the source and destination
countries of the attacks. Also, they want to empha-
size relations between the countries in order to de-
tect the dominant traffic flows. They can then focus
on a selected country and analyze specific aspects of
the attacks related to this country—e.g., state (active,
mitigated, finished). The multilayer map meets the
requirements. It can hold either the information about
the source of DDoS attacks and the information about
their destinations. Then, the connection layer can dis-
play the relations between the countries. The users
can use the filters to show only a specific subset of
data. Finally, they can select a particular country in
the choropleth and highlight all the related data pre-
sented in the same or other map layers.
Since we implemented the map widget in the form
of a reusable component, it can fulfill other use cases
(e.g., the analysis of traffic anomalies). The widget
can be attached to different endpoints of the back-end
REST API, which provide the JSON format data. Us-
ing the predefined configuration created by the UX
team members, the users will see the arranged map
IVAPP 2021 - 12th International Conference on Information Visualization Theory and Applications
108
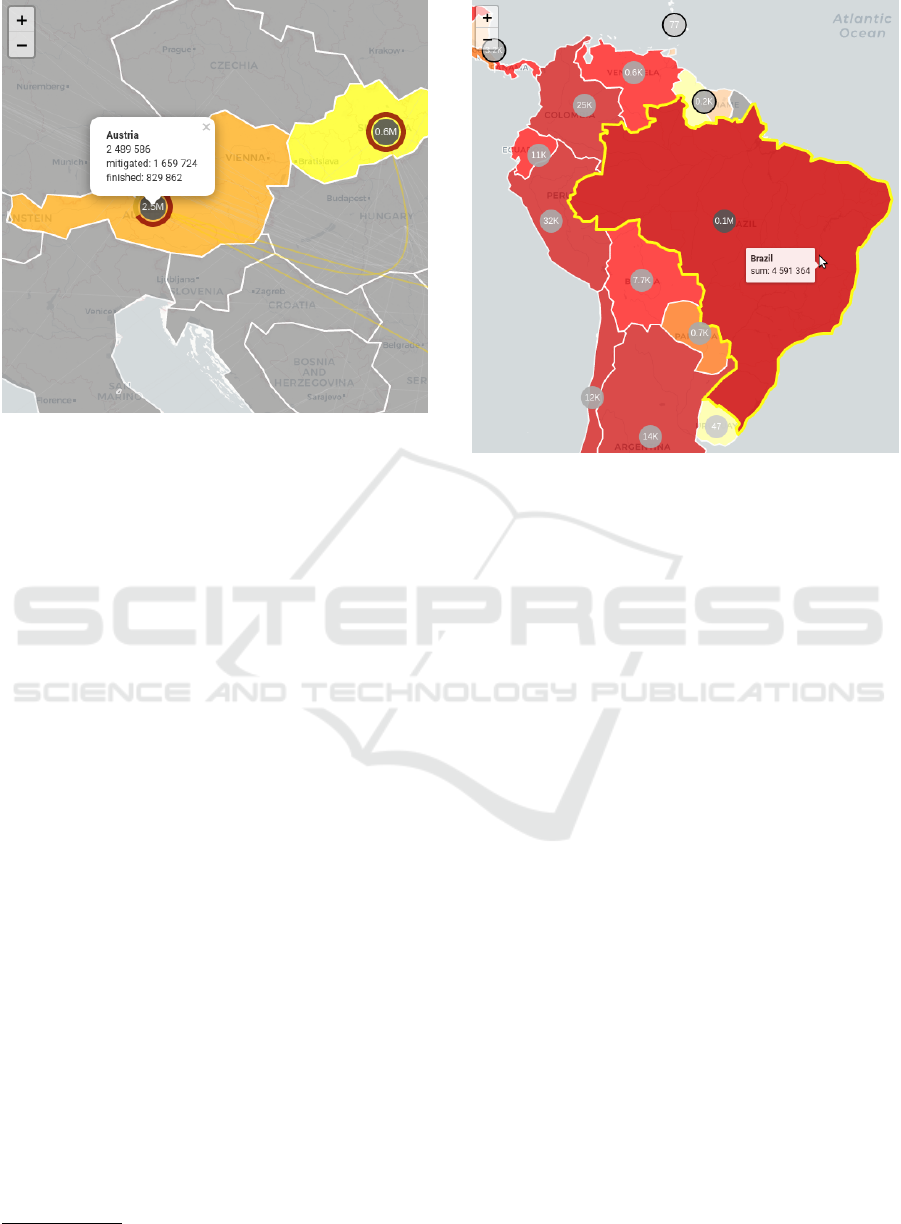
Figure 8: The focus on a particular country and further anal-
ysis of the attacking packets. The users can group the data
according to different data domains. This example shows
the share of mitigated or finished attacks.
layers without manually binding the data domains to
the layers’ visual dimensions. If required, the abil-
ity to manually redesign the layers and its data can be
disabled for the end-users too.
5.2 COVID-19 Pandemic
The second scenario reflects the current world situ-
ation. We used the map to visualize the worldwide
spread of the COVID-19 disease to demonstrate the
widget’s general applicability. We used the data from
the rapidapi.com
13
service and converted them to the
JSON format to import them into the map widget.
Since the map allows the users to change the data do-
mains, the users can compare the countries from dif-
ferent aspects (sum of confirmed cases, numbers of
recoveries, and deaths). They can also combine these
views using the choropleth and marker layers. Figure
9 shows an example of the use case.
Similarly, the map could visualize various geospa-
tial indicators (e.g., economic, political, educational).
6 DISCUSSION
In this section, we discuss the advantages and limita-
tions of the prototype implementation based on the
presented usage scenarios. Further, we outline our
13
https://rapidapi.com/
Figure 9: The choropleth layer compares the number of
confirmed cases with the disease. The marker layer shows
the number of deaths caused by the disease.
plans toward providing Geovisto as a web service for
general use.
6.1 Advantages and Limitations
We demonstrated Geovisto applicability in two dif-
ferent usage scenarios. The simple user interface en-
ables even non-programmers to manipulate with the
geospatial data and ideate novel contextualization op-
tions.
The capability to load custom JSON files and se-
lect various data domains allows users to explore in-
formation further. Showing more layers at the same
time helps the users to see the data in context. The
interactive data filtering emphasizes the relations be-
tween geographical locations. Map configuration can
be serialized and paired with a different dataset using
the same model.
The presented usage scenarios are somewhat pre-
liminary evaluation, and we need to evaluate the Geo-
visto more rigorously. The usage scenarios show only
a fragment of geospatial data types that could be visu-
alized. Gevisto is, so far, only a prototype which we
plan to extend significantly in the following months.
We plan for a series of lab usability studies to im-
prove the user experience. More usage scenarios and
case studies are needed to validate the generalization
of our approach.
For instance, combining several map layers is lim-
ited by the comprehensibility of the widget by people.
Geovisto: A Toolkit for Generic Geospatial Data Visualization
109

The users might be overwhelmed by the data,
mostly when inappropriate color combinations are
chosen. The z-index of the layers is hardcoded and
cannot be changed by the user. Usually, the users
should not need to change the default settings (e.g.,
the marker and connection layers are above the
choropleth). In the future, with more layers added,
users should be in control of their ordering.
Another limitation relates to the data preprocess-
ing that has to be done to gain a flat data structure,
which can be mapped to the visual dimensions of the
map layers. Our approach causes enlargement and re-
dundancy of the data. Thanks to that, the data can
be processed and quickly. However, it would be use-
ful to design an algorithm that can work with the data
without preprocessing and more efficiently.
6.2 Future Work
We can divide further extensions and improvements
into three areas. First of all, we want to provide
Geovisto as a service that enables users to configure
the geovisualizations and include them as widgets on
their websites. Currently, we are developing an infras-
tructure that will be used for managing map config-
urations datasets. The system will provide the front-
end part, used as an application wrapper, including the
UI tools to manage user-defined maps. The back-end
part will provide a configuration database and API
for fetching the configurations remotely. Since the
map application works only with the JSON files, we
would like to connect to popular relational and non-
relational database systems.
The second area deals with layer improvements
and creating new ones. Many other map diagram
types are suitable for different use cases. We are cur-
rently implementing the heatmap layer, which plays
a role in the comprehensive data distribution visual-
ization. Also, we will revise the visual appearance of
the layers. Since the users can show multiple layers in
the map simultaneously, we will pay closer attention
to the color pallets used in the layers (e.g., sufficient
color contrast, color-blind safe pallet combinations).
Also, we plan to add further visual dimensions to the
layers as well as controls for manipulation of the lay-
ers. By default, the layers support the built-in zoom of
the Leaflet library and simple pop-ups. We also add
more interactive map legends of value categories.
The third area focuses on Geovisto architecture
improvement. We extend its modularity by wrapping
the layers shown in Figure 5 into the tool objects.
The map core works with multipurpose tools provid-
ing various kinds of functionality, such as additional
layers or controls (e.g., map legends or menus). For
instance, we develop a timeline control tool, which
extends all layers presenting geospatial data with a
temporal dimension. It enables to animate spatiotem-
poral data domains and seek them to the defined time
frame. As a result, it will help the user see the evo-
lution of values in individual geographic regions in
time.
7 CONCLUSIONS
There are different possibilities of how to visualize
geospatial data. Template editing allows users to
choose from a pre-defined set of visualizations and
configure only their basic parameters. On the other
hand, frameworks such as D3.js allow for developing
more advanced visualizations but require program-
ming skills. It also requires understanding the cho-
sen mapping library or framework and applying it
in a particular situation correctly. The visualization
authoring tools combine these two approaches but
mostly focus on regular 2D chart visualizations, and
their support for visualizing geospatial data is usually
limited.
We identified the limitations of current approaches
and proposed the prototype of the Geovisto toolkit
that addresses them. Our approach combines the ad-
vantages of the existing ones and provides a user-
friendly interface for non-programmers who want to
visualize geospatial data. Geovisto allows the users
to load their datasets and map the data domains into
multiple map layers. Through user-defined configura-
tions, data filtering, and visual highlighting, users can
explore the related data even from different layers.
Geovisto is implemented in ReactJS, which allows
its integration in third-party web applications and is
available under MIT License at GitHub
14
.
We demonstrated its applicability in two usage
scenarios showed. The multilayered map has ap-
peared to be an excellent way to display geographic
locations of network nodes. Flowmon Networks can
use the map to display information about DDoS at-
tacks or network traffic anomalies. Interactive filters
and the ability to change the data domains allow the
users to analyze the data and see the hidden relations
better. The second usage scenario showed that the
widget could be used for visual analysis of arbitrary
geospatial data, such as visualization of the COVID-
19 pandemic.
In the future, we would like to improve the user
management of map configurations, implement new
map layers (such as heatmap) and add the time di-
14
https://github.com/geovisto
IVAPP 2021 - 12th International Conference on Information Visualization Theory and Applications
110

mension, including animations, which will allow the
users to see the evolution of values in time better.
ACKNOWLEDGEMENTS
Ji
ˇ
r
´
ı Hynek was supported by The Ministry of Educa-
tion, Youth and Sports from the National Programme
of Sustainability (NPU II) project “IT4Innovations
excellence in science – LQ1602”.
Jakub Kachl
´
ık was supported by the Technol-
ogy Agency of the Czech Republic project ”Na-
tional Centre of Competence in Cybersecurity” (No.
TN01000077).
V
´
ıt Rus
ˇ
n
´
ak was supported by ERDF “Cy-
berSecurity, CyberCrime and Critical Informa-
tion Infrastructures Center of Excellence” (No.
CZ.02.1.01/0.0/0.0/16 019/0000822) project.
REFERENCES
Bostock, M. and Heer, J. (2009). Protovis: A Graphical
Toolkit for Visualization. IEEE Transactions on Visu-
alization and Computer Graphics, 15(6):1121–1128.
Bostock, M., Ogievetsky, V., and Heer, J. (2011). D
3
data-
driven documents. IEEE Transactions on Visualiza-
tion and Computer Graphics, 17(12):2301–2309.
Degbelo, A. and Kauppinen, T. (2018). Increasing trans-
parency through web maps. In Companion Proceed-
ings of the The Web Conference 2018, WWW ’18,
page 899–904, Republic and Canton of Geneva, CHE.
International World Wide Web Conferences Steering
Committee.
Elasticsearch, B. (2020). Maps for geospatial analy-
sis. https://www.elastic.co/maps. (Accessed on
10/02/2020).
Few, S. (2006). Information Dashboard Design: The Effec-
tive Visual Communication of Data. O’Reilly Series.
O’Reilly Media, Incorporated.
Gao, T., Hullman, J. R., Adar, E., Hecht, B., and Diakopou-
los, N. (2014). Newsviews: An automated pipeline for
creating custom geovisualizations for news. In Pro-
ceedings of the SIGCHI Conference on Human Fac-
tors in Computing Systems, CHI ’14, page 3005–3014,
New York, NY, USA. Association for Computing Ma-
chinery.
Grafana Labs (2020). Grafana: The open observabil-
ity platform. https://grafana.com/. (Accessed on
10/06/2020).
Grammel, L., Bennett, C., Tory, M., and Storey, M.-A.
(2013). A Survey of Visualization Construction User
Interfaces. In Hlawitschka, M. and Weinkauf, T., edi-
tors, EuroVis – Short Papers. The Eurographics Asso-
ciation.
Holten, D. and Van Wijk, J. J. (2009). Force-Directed Edge
Bundling for Graph Visualization. Computer Graph-
ics Forum, 28(3):983–990.
Huang, Q., Cervone, G., Jing, D., and Chang, C. (2015).
Disastermapper: A cybergis framework for disaster
management using social media data. In Proceedings
of the 4th International ACM SIGSPATIAL Workshop
on Analytics for Big Geospatial Data, BigSpatial’15,
page 1–6, New York, NY, USA. Association for Com-
puting Machinery.
Li, X., Anselin, L., and Koschinsky, J. (2015). GeoDa Web:
Enhancing Web-Based Mapping with Spatial Analyt-
ics. In Proceedings of the 23rd SIGSPATIAL Inter-
national Conference on Advances in Geographic In-
formation Systems, SIGSPATIAL ’15, New York, NY,
USA. Association for Computing Machinery.
Liu, Z., Thompson, J., Wilson, A., Dontcheva, M., Delorey,
J., Grigg, S., Kerr, B., and Stasko, J. (2018). Data Il-
lustrator: Augmenting Vector Design Tools with Lazy
Data Binding for Expressive Visualization Authoring.
In Proceedings of the 2018 CHI Conference on Hu-
man Factors in Computing Systems, CHI ’18, page
1–13, New York, NY, USA. Association for Comput-
ing Machinery.
Mei, H., Ma, Y., Wei, Y., and Chen, W. (2018). The Design
Space of Construction Tools for Information Visual-
ization: A Survey. Journal of Visual Languages &
Computing, 44:120 – 132.
Ren, D., Lee, B., and Brehmer, M. (2019). Charticu-
lator: Interactive construction of bespoke chart lay-
outs. IEEE Transactions on Visualization and Com-
puter Graphics, 25(1):789–799.
Satyanarayan, A. and Heer, J. (2014). Lyra: An interactive
visualization design environment. Computer Graph-
ics Forum (Proc. EuroVis).
Satyanarayan, A., Moritz, D., Wongsuphasawat, K., and
Heer, J. (2017). Vega-lite: A grammar of interac-
tive graphics. IEEE Transactions on Visualization and
Computer Graphics, 23(1):341–350.
Satyanarayan, A., Russell, R., Hoffswell, J., and Heer, J.
(2015). Reactive vega: A Streaming Dataflow Archi-
tecture for Declarative Interactive Visualization. IEEE
transactions on visualization and computer graphics,
22(1):659–668.
Tableau Software, LLC. (2020). Mapping Con-
cepts in Tableau. https://help.tableau.com/current/
pro/desktop/en-us/maps build.htm. (Accessed on
10/02/2020).
Xavier, G. and Dodge, S. (2014). An exploratory visu-
alization tool for mapping the relationships between
animal movement and the environment. In Proceed-
ings of the 2nd ACM SIGSPATIAL International Work-
shop on Interacting with Maps, MapInteract ’14, page
36–42, New York, NY, USA. Association for Comput-
ing Machinery.
Geovisto: A Toolkit for Generic Geospatial Data Visualization
111
