
User-centred Development of a Clinical Decision-support System for
Breast Cancer Diagnosis and Reporting based on Stroke Gestures
Suzanne Kieffer
1 a
, Annabelle Gouze
2
and Jean Vanderdonckt
1 b
1
Universit
´
e catholique de Louvain, Louvain-la-Neuve, Belgium
2
EVS Broadcast Equipment, Rue Bois Saint-Jean 13, B-4102 Seraing, Belgium
Keywords:
Clinical Decision-support System, Stroke Gesture, Multi-fidelity Prototype, User-centred Design.
Abstract:
We conducted a user-centred design of a clinical decision-support system for breast cancer screening, diagno-
sis, and reporting based on stroke gestures. We combined knowledge elicitation interviews, scenario-focused
questionnaires and paper mock-ups to understand user needs. Multi-fidelity (low and high) prototypes were
designed and compared first in vitro in a usability laboratory, then in vivo in the real world. The resulting
user interface provides radiologists with a platform that integrates domain-oriented tools for the visualisation
of mammograms, the manual, and the semi-automatic annotation of breast cancer findings based on stroke
gestures. The contribution of this work lies in that, to the best of our knowledge, stroke gestures have not yet
been applied to the annotation of mammograms. On the one hand, although there is a substantial amount of
research done in stroke-based interaction, none focuses especially on the domain of breast cancer annotation.
On the other hand, typical gestures in breast cancer annotation tools are those with a keyboard and a mouse.
1 INTRODUCTION
Breast Cancer (BC) is the most common type of can-
cer among women worldwide. In particular, one in
nine women is expected to develop the disease during
her lifetime. In 2050, this number will have doubled.
Early detection improves BC treatment and recovery.
Actually, 80 percent of the patients recover when the
diagnostic is made early, in comparison with only 30
percent when not. At the present time, there are two
promising ways to address these issues :
• Screening mammography exams, which aim at
discriminating BC findings into benign and malig-
nant lesions; screening mammography programs
are promoted to facilitate the early detection of
breast cancer for women 50 up to 70 of age.
• Clinical decision support systems (CDSS)
(Pawloski et al., 2019) such as computer-aided
diagnosis (CAD) systems, which rely on image
processing and help detecting missed findings.
The screening mammography is the most reliable
exam as it enables the early detection of BC disease
and its treatment. The exam is composed of four X-
ray images, or four standard projections of the breasts:
a
https://orcid.org/0000-0002-5519-8814
b
https://orcid.org/0000-0003-3275-3333
left and right Cranio-Caudal (CC) and Medio-Lateral
Oblique (MLO) projection. Recent advances in ac-
quisition system allow to directly producing digital
mammography instead of X-ray film. Some per-
formance comparisons demonstrated the benefit of
digital mammography over screen-film mammogra-
phy (Skaane and Skjennald, 2004; Vinnicombe et al.,
2009). The screening workflow consists for the ra-
diologist in doing image screening, lesion detection,
interpretation and reporting. The report includes the
complete and structured description of any significant
finding, the comparison to previous studies, the over-
all diagnosis and follow-up recommendations.
Since digital mammography has replaced screen-
film mammography, information and communication
technology (ICT) has progressively been introduced
in BC screening and diagnosis, leading to an in-
creasing number of supporting devices and interac-
tive tools. Such interactive systems improve the re-
liability of the diagnosis: e.g., magnification, orien-
tation, brightness, and contrast of the image may be
altered after the exam is completed to explore fur-
ther certain areas. Moreover, such interactive sys-
tems improve the productivity of the radiologist: e.g.,
they improve and facilitate the access and the sharing
of medical information (Sainfort and Booske, 2017).
However, radiologists still deplore three main issues
concerning the current interactive systems supporting
60
Kieffer, S., Gouze, A. and Vanderdonckt, J.
User-centred Development of a Clinical Decision-support System for Breast Cancer Diagnosis and Reporting based on Stroke Gestures.
DOI: 10.5220/0010258900600071
In Proceedings of the 16th International Joint Conference on Computer Vision, Imaging and Computer Graphics Theory and Applications (VISIGRAPP 2021) - Volume 2: HUCAPP, pages
60-71
ISBN: 978-989-758-488-6
Copyright
c
2021 by SCITEPRESS – Science and Technology Publications, Lda. All rights reserved
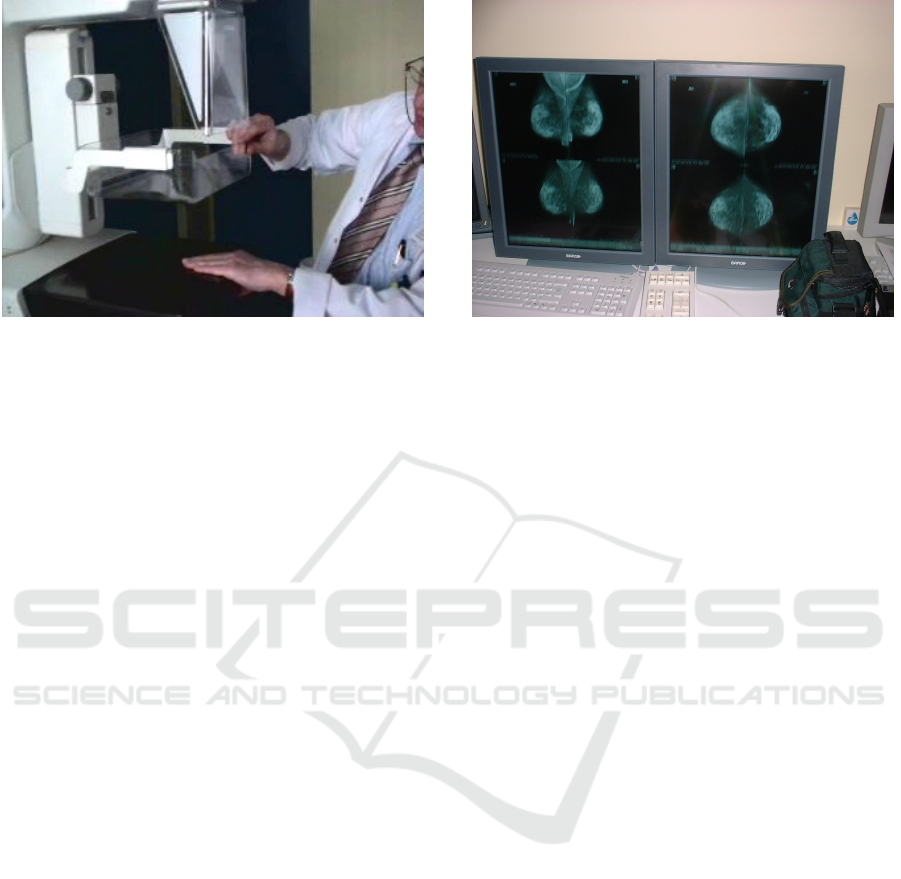
Figure 1: Image acquisition system.
Figure 2: Modality console.
their activity: (1) they are not integrated in a unique
system; (2) they do not enable the standardised an-
notation of BC findings; (3) they do not provide any
means to interact with the CAD tools. First, radiolo-
gists need a unique and integrated system supporting
their activity in order to maximise the image view-
ing time and minimise any distractions from both the
equipment and the software (ACR, 2007). Recent ef-
forts have been made to develop and improve the digi-
tal mammography equipment from image acquisition
systems (Fig. 1) up to image viewing and analysing
systems (Fig. 2). The setting for screening procedures
has to be compliant with the European guidelines
for quality assurance in BC screening and diagnosis
(Perry N., 2006), and is most often composed of two
screens, a task-oriented keypad, and a mouse. More-
over, owing to the specificity and the complexity of
each task involved in mammogram analysis, research
efforts have been focusing mainly on the implemen-
tation of task-oriented interactive systems such as im-
age viewers (Fig. 2), radiology information systems
(which are used in order to store, manipulate, and
distribute the patient radiological data and imagery),
CAD software, and digital case databases. Hence, ra-
diologists currently tend to split their work between
a growing number of interactive tools (e.g., case re-
trieval databases, viewers, and CAD tools), worksta-
tions, and media (e.g., screen, mouse, keyboard, and
handheld recorder). This equipment heterogeneity
decreases their productivity.
Second, radiologists need the system to charac-
terise the findings to be compliant with the domain
standard. While many research efforts have been car-
ried out separately on the implementation of task-
oriented systems, much less effort has been under-
taken to the design and the development of tech-
nologies compliant with the domain standard, i.e.,
the Breast Imaging Reporting And Data System (BI-
RADS). The BI-RADS is an approved quality insur-
ance system of descriptive terms and reporting guide-
lines (ACR, 2007). Such tools not only facilitate
reporting, providing radiologists with homogeneous,
structured, and standardized reports, but lead to data
accessibility as well. They enable data exchange and
storage, interpretation monitoring (Wittenberg et al.,
2007), retrieval of useful and interesting cases for
teaching and research purposes (Zheng et al., 2004).
Third, radiologists need the CAD systems to en-
able the possible modification of the detected area.
Mammography is the most commonly used method
for BC screening since it enables early detection and
treatment. Two important and early signs of the dis-
ease in breast tissues are cluster of microcalcifica-
tions (small calcium deposit) and masses. The current
CAD tools provide radiologists with the automatic
detection of possibly missed findings, such as clus-
ter of microcalcifications (CA++) or masses (Cheng
et al., 2003). However, radiologists deplore the lack
of human-computer interaction with CAD tools. For
instance, BC-oriented interactive tools should sup-
port both the association of numerical data from the
CAD to the standard annotation of BC findings and
the modification of these numerical data if required,
with the ultimate goal to include these data to the fi-
nal report. The standard lexicon of mammography
terms defined by the BI-RARDS for manual charac-
terisation of findings (ACR, 2007)] is also integrated.
To sum up, there is a need for a CDSS for
BC, which integrates domain-oriented functionalities
within a unique platform and supports both manual
and semi-automatic annotation of significant finding
in the breast. This paper presents how we combined
different methods and techniques from the human-
computer interaction (HCI) and medical imaging
fields with the goal to design and test a clinical
decision-support system for BC. The objectives and
the methodology are presented in the next sections.
Then, the system is fully described, and three usabil-
User-centred Development of a Clinical Decision-support System for Breast Cancer Diagnosis and Reporting based on Stroke Gestures
61

ity evaluations are reported, before the conclusion and
the discussion. The contribution of this work lies in
that, to the best of our knowledge, stroke gestures
have not yet been applied to the annotation of mam-
mograms. On the one hand, although there is a sub-
stantial amount of research done in stroke-based in-
teraction, none focuses especially on the domain of
breast cancer annotation. On the other hand, typical
gestures in breast cancer annotation tools are those
with a keyboard and a mouse.
2 OBJECTIVES
Both utility and usability are widely considered as re-
quirements to meet the goal of the overall acceptabil-
ity of a system (Nielsen and Molich, 1990). The over-
all objective of this work is to develop a CDSS for
BC which addresses radiologists’ needs and expecta-
tions. To satisfy both the need of utility and usabil-
ity, such system system should: (1) integrate both the
equipment and the software into a unique platform;
(2) support the standardized (manual) annotation of
any significant finding; (3) provide relevant feedback
functionalities for semi-automatic annotation.
CAD systems were introduced to attract radiolo-
gists’ attention to the features that might have been
overlooked or dismissed and to deliver helpful in-
formation for diagnosis. Typically, CAD systems
provide an automatic assistance to the spatial detec-
tion (localisation) of BC lesions, usually stressed on
the mammogram image thanks to markers such as
crosses, triangles, or squares. However, CAD data
are restricted to the spatial location of the lesions and
need to be enhanced by complementary features from
segmentation to deliver meaningful information:
• Regarding masses: segmented area (i.e., the area
surrounding the mass), location, size, circularity,
local contrast, perimeter, mean and luminance.
• Regarding clusters of calcifications: centre loca-
tion, number of calcifications, length of the con-
vex hull, size of the convex hull, circularity of the
convex hull, density, and local contrast.
• Regarding microcalcification: location, size, cir-
cularity, and local contrast.
Different factors affect the accuracy of the seg-
mentation: breast composition, missing lesion edge
due to the presence of a more marked edge, and
missed/false findings. Segmentation outputs might
not represent the lesions correctly and may not be
meaningful. Consequently, it is mandatory to pro-
pose a new interactive method which allows exploit-
ing the radiologist knowledge inside the segmentation
process: the relevance feedback (Ruthven and Lal-
mas, 2003). The main contribution of this work is
the improvement of the segmentation process thanks
to relevant feedback technique, as it combines both
human knowledge and image processing. To the best
of our knowledge, the system presented here is the
first CDSS for BC providing both manual and semi-
automatic means to characterise any finding in com-
pliance with the approved standard of the domain.
Such achievement was made possible by the adoption
of a user-centered approach as a formal development
model.
3 USER-CENTERED APPROACH
ICT provides nowadays a means to support and facil-
itate the daily activities of potentially all users. This
may be of particular importance for the experts in BC
screening and diagnosis, upon condition that the sys-
tem fit user needs, expectations and requirements. In-
terests in user-centered approaches stem from the goal
to design and implement interactive systems support-
ing the activities of domain-expert users, who are not
necessarily experts in computer science. Important
care must be devoted to the study of the needs and the
expectations of such domain-expert users (Costabile
et al., 2003). In particular, attention must be paid to
the user and the usability throughout the software life-
cycle in order to design and implement user-friendly
and easy-to-use interfaces (Nielsen and Molich, 1990;
Organisation, 2018). At different time frames in
the life-cycle, the development model relies on user-
centred methods such as knowledge elicitation inter-
views, scenario-focused questionnaires, paper mock-
ups, prototyping and user tests.
3.1 Knowledge Elicitation Interview
We carried out knowledge elicitation interviews to
gather domain- and task-relevant insights early in the
life-cycle. We questioned thoroughly five domain-
expert users about the BC domain, the task series in-
volved in their activity, their needs and their expec-
tations regarding a ideal CAD system for BC. The
equipment used was paper notes and video recording.
The information collected during these interviews in-
cluded the description and the explanations of the ter-
minology to be used, the setting of the equipment,
and the acquisition and the screening procedures. The
screening analysis procedure involves six steps:
1. Selection of a case from the list of patients.
2. Analysis of the patient information, such as previ-
ous examinations, if available.
HUCAPP 2021 - 5th International Conference on Human Computer Interaction Theory and Applications
62
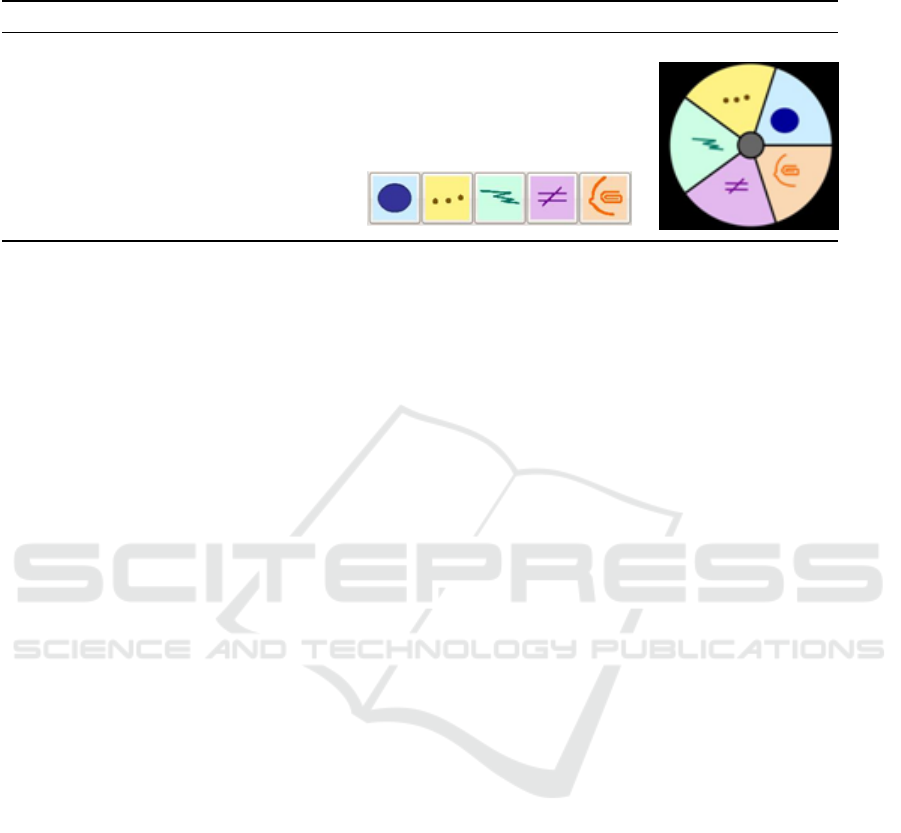
Table 1: Scenario-Focused questionnaire. The screening activity is the description of the lesion type (col. 1). Two interactive
scenarios support this activity: using an array of buttons (col. 2) or using a pie-menu (col. 3).
Screening activity Scenario #1 Scenario #2
Lesion type (e.g. mass) Array of buttons Pie menu
3. Visualisation of the projections on the read-
ing viewers, by usually following this sequence:
global view, 2 CC views, 2 MLO views, and
global view again.
4. Visualisation of the detailed parts of the projec-
tions in order to detect suspicious findings.
5. Interpretation.
6. Briefing and reporting of the screening results.
3.2 Questionnaire and Paper Mock-ups
We used a scenario-focused questionnaire (Table 1)
and paper mock-ups (Fig. 3) to define and select
the interaction scenarios which would best support
user activities (Danli Wang, 2008). Thanks to users’
involvement, such a design method proved to re-
duce both development time and costs, and to im-
prove usability (Danli Wang, 2008; Rosson and Car-
roll, 2002). Each low-fidelity prototype progres-
sively evolved to a high-fidelity prototype by map-
ping (Montero et al., 2006), thus resulting into multi-
fidelity prototyping (Coyette et al., 2007). Both the
questionnaire and the mock-ups were elaborated from
the information collected during knowledge elicita-
tion interviews and were presented to six domain-
expert users to evaluate the icon framework and the
overall spatial organization of the interface, and to se-
lect the potential interactive scenarios.
The questionnaire was used by the interviewer
as visual aid during face-to-face interviews. Paper
mock-ups were preferred to computer prototypes as
(1) the available tool did not support the scenarios
applying for implementation and (2) the evaluation
should lead to a lot of drawings, direct manipulation
of paper components and discussions between design-
ers and domain-expert users (Sefelin et al., 2003).
The analysis of the data collected from scenario-
focused questionnaire and paper mock-ups led to the
preliminary expert validation of the user interface
in terms of spatial organisation, terminology used,
specific components designed, such as icons, colour
code, and the interactive scenarios proposed to sup-
port the users’ activity.
4 DISCUSSION OF THE CDSS
4.1 Gesture-based Interface
Stroke gestures are effective to provide users with
an intuitive and convenient interaction (Danli Wang,
2008; Vanderdonckt et al., 2019). Owing to its high
naturalness and mainly to its convenience to satisfy
the lesion characterisation requirement, stroke ges-
tures with a graphics tablet and a pen were chosen
as interaction modality: navigating in a clinical case
(i.e., among the mammograms), navigating in a spe-
cific mammogram (i.e., zoom-in, zoom-out), sketch-
ing a region of interest (ROI) (Kieffer et al., 2010), an-
notating findings and reporting, and recognition (Van-
derdonckt et al., 2018).
4.2 Iconic Representations
The BI-RADS (ACR, 2007) provides a standardised
terminology for the description of BC findings. Any
finding is described according to a lesion type (i.e.,
mass, calcification, architectural distortion, special
case or associated finding), and type-related charac-
teristics. Beyond the specific characteristics related
to a lesion type, the breast imaging report contains the
finding location and the comparison to previous stud-
ies, whatever the type. We created an icon framework
(about 150 different icons) according to this standard
to enable any finding to be fully described:
• We assigned a unique icon with any specific term
of the BI-RADS lexicon to make the lesion char-
acterization as straightforward and unambiguous
as possible;
User-centred Development of a Clinical Decision-support System for Breast Cancer Diagnosis and Reporting based on Stroke Gestures
63
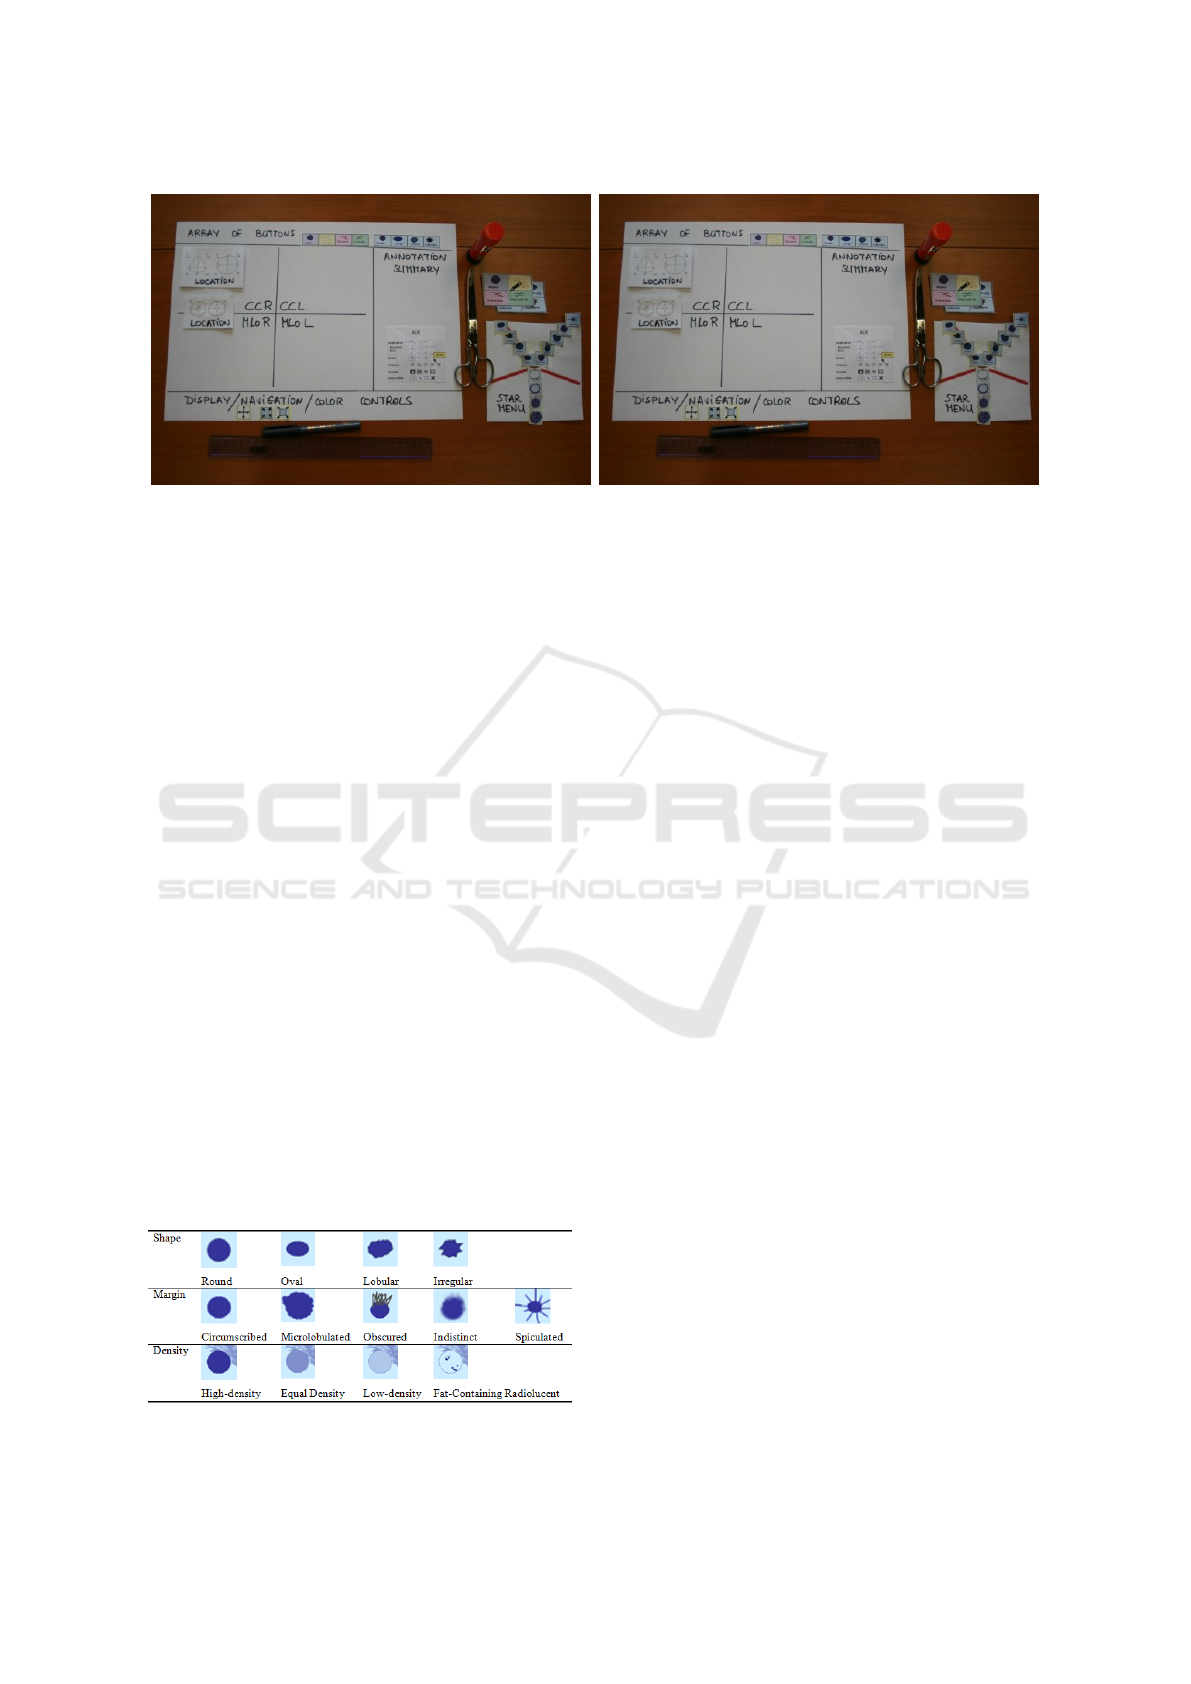
(a) The experimental material such as paper, glue, and pen. (b) The device in use.
Figure 3: Paper mock-ups.
• We created a colour code to facilitate the discrim-
ination between the findings: masses in blue, cal-
cifications in yellow, distortions in green, special
cases in violet, and associated findings in orange.
The schemes on the icons related to the finding
location and the comparison to previous studies are
common to all the lesion types; only colours are dif-
ferent. Fig. 4 presents the icons related to the specific
characteristics of masses. Masses are characterised by
basic shape (round, oval, lobular or irregular), margin
(circumscribed, microlobulated, obscured, indistinct
or spiculated) and density (high-density, equal den-
sity, low-density or fat-containing radiolucent).
4.3 Manual Annotation with the Pie and
the Star Menus
Providing experts in BC imaging with an interactive
tool supporting their activity is a tough problem of
HCI considering the utility and the usability. The util-
ity is ensured by the compliance of the system with
domain standards, and by the integration within a sin-
gle interactive tool of the following features: image
visualization, annotation of findings, semi-automatic
lesion detection and reporting. To guarantee the us-
ability of the system, especially during the manual an-
notation of BC findings, sustained attention has been
Figure 4: Icons related to the characteristics of masses:
shape, margin and density.
paid to the graphical representation of the mammo-
graphic BI-RADS terminology (design of an exhaus-
tive set of icons), to the spatial organization of mul-
tidimensional data (Bellik et al., 2009) (overall spa-
tial organisation of the user interface and location of
widgets), and to the design of new interactive solu-
tions suited to the finding annotation with a pen on a
graphics tablet.
Therefore, two alternate menus were implemented
to support the gesture-based annotation of BC find-
ings: a pie menu (Callahan et al., 1988) for the
gesture-based selection of the lesion type, and a star
menu for the gesture-based description of the type-
related characteristics of the lesion. The pie menu
(5a) was implemented in order to facilitate the pen-
based annotation of the lesion type. This format was
chosen because it reduces the target seek time and
improves the accuracy of target selection (Callahan
et al., 1988; Moyle and Cockburn, 2002).
The star menu (5b) was implemented in order to
facilitate the pen-based annotation of complementary
characteristics by grouping related icons. This format
was chosen because such a display layout was proved
to be very efficient and accurate for visual inspection
or visual detection by comparison with matrix, elliptic
and random spatial structures (Simonin et al., 2005).
The manual annotation of any significant finding can
be performed as follows. First, the suspicious find-
ing is surrounded with the pen. This action corre-
sponds to the ROI drawing. Then, the lesion is an-
notated thanks to the pie-menu (type of lesion) and
the star-menu (characteristics of the specific lesion).
Finally, the full description of the lesion is automati-
cally stored into the final report.
4.4 Semi-automatic Annotation
While the radiologist manually annotates a finding,
the segmentation computation and the numerical fea-
HUCAPP 2021 - 5th International Conference on Human Computer Interaction Theory and Applications
64
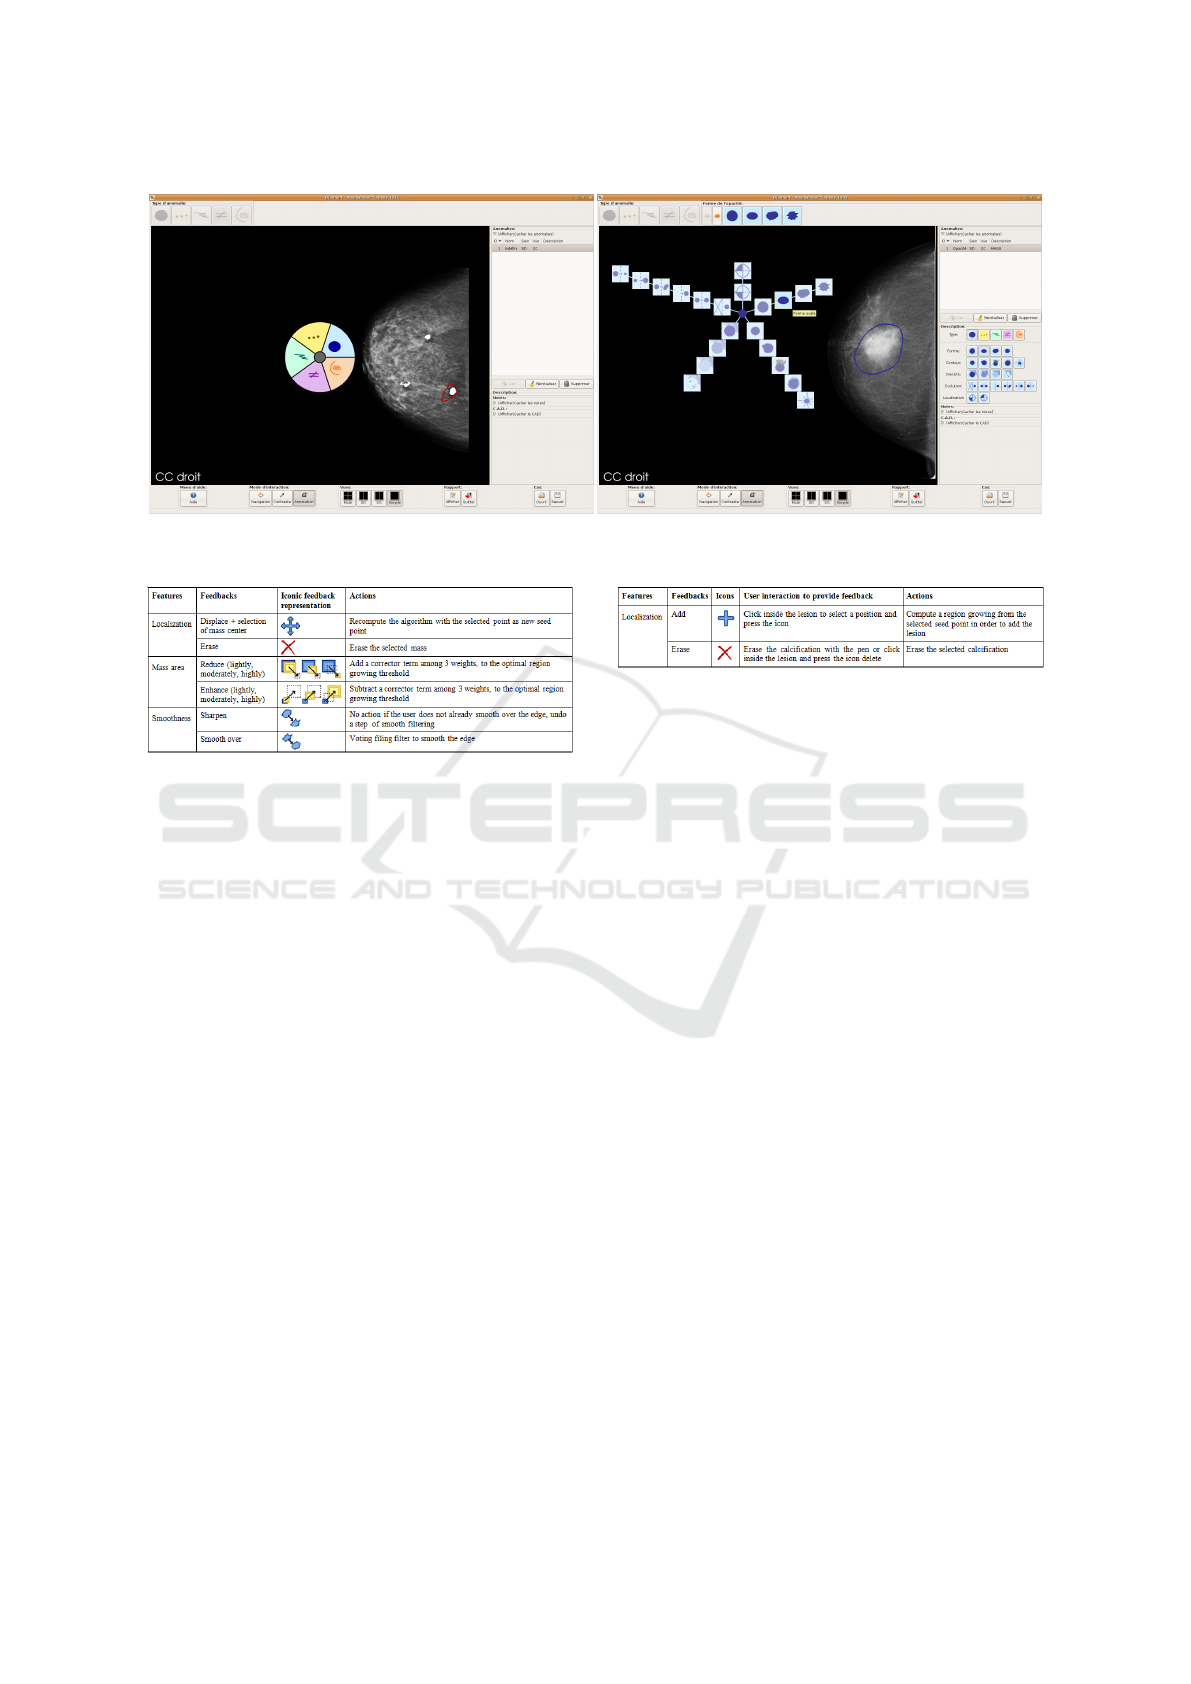
(a) Pie menu. (b) Star menu.
Figure 5: Alternate menus for the Decision Support System.
Figure 6: Predefined features of masses (col. 1) with their
associated feedbacks (col. 2), the representation (col. 3),
and the actions (col. 4).
tures extraction are automatically launched inside the
ROI. Then, the segmented findings are displayed in
red (highlighted edge) together with the relevant nu-
merical features of the segmented objects. The sys-
tem enables, if required, to “highlight” or to “hide”
the edge of the detected mass, the mask of detected
microcalcifications, or the convex hull of clusters, by
simply pressing a button. It also provides the user
with a simple query interface with two modes: (i) the
validation mode which enables either the validation
or the report of mistakes, and (ii) the (interactive) seg-
mentation mode which enables the radiologist to im-
prove the segmentation by providing new parameters
for the segmentation computation. This is the relevant
feedback process.
A set of feedback icons was designed to enable the
radiologist to easily interact with the system (Figs. 6
and 7). Once the segmentation results are validated,
the numerical features are included in the report to-
gether with the manual annotation. This combina-
tion of manual and semi-automatic annotations of BC
findings increases the quality assurance in screening
practice. The next sections present the algorithms for
the automatic segmentation of masses and microcal-
cifications, and how relevance improved this segmen-
tation.
Figure 7: Predefined features of the microcalcifications for
a cluster (col 1.) with their associated feedbacks (col. 2),
the iconic representation of feedback (col. 3), the feedback
(col 4.), and actions (col. 5).
4.4.1 Automatic Segmentation of BC Findings
Mass segmentation is performed by applying the al-
gorithm of Kupinski and Giger (Kupinski and Giger,
1998), which is based on a region growing process
and on probabilistic models. The region growing
process starts from a source point, located inside of
the ROI where the segmentation has to be computed.
Then, this region iteratively grows towards the edge
of the object to be segmented, while the pixels border-
ing the current region are integrated inside the region
upon condition that the luminance variation is lower
than a given threshold. Different thresholds are ap-
plied to obtain different partitions in two regions: the
object (lesion) and the background. Then, the prob-
ability distribution of luminance inside and outside
the object is computed. The probability of the im-
age partition is equal to the product of probabilities at
each point. The final mass segmentation corresponds
to the partition that maximizes the probability of the
partitions.
Microcalcifications are detected by applying the
Dengler’s algorithm (Dengler et al., 1991) and are
gathered into clusters, considering the distance be-
tween each other. The Dengler’s algorithm combines
WDoG (Weighted Difference of Gaussian) and the
Top Hat morphological transform.
User-centred Development of a Clinical Decision-support System for Breast Cancer Diagnosis and Reporting based on Stroke Gestures
65
4.4.2 Relevance Feedback
Relevance feedback techniques focus on adjusting
features, using the feedback provided by the radiol-
ogist about the previous results to improve or vali-
date the system performance (Ruthven and Lalmas,
2003). Relevance feedback requires, for each finding,
the selection of the features that best suit the radi-
ologist knowledge acquisition and the segmentation.
Then, for each chosen feature, the pre-defined feed-
backs and the actions associated with each feedback
are introduced. Figs. 6 and 7 introduce for masses
and microcalcifications: the relevant features, the def-
inition of the associated feedbacks available for inter-
active segmentation mode, and the actions to be per-
formed in reply to the user feedback.
The selected relevant features (Figs. 6 and 7)
should be represented by numerical values. How-
ever, radiologists are not able to evaluate themselves
these values. Radiologists can only provide assess-
ments on good or erroneous results and return their
subjective feedbacks. Therefore, positive feedbacks
imply a validation of the features and negative feed-
backs launches a new segmentation with new param-
eters. Negative feedbacks involve immediate action
from a cognitive point of view and the feedback is de-
signed to suggest an action rather than an assertion.
If the radiologist judges the mass area to be incor-
rect and consequently returns a feedback to ”lightly
enhance region”, the system allows the interactive
icon-based specification of a different area of bigger
size. The associated action is to subtract a corrector
from the optimal threshold of the region growing al-
gorithm (Kupinski and Giger, 1998) to obtain a bigger
area. The validation mode enables the radiologist ei-
ther to validate the whole of the segmentation results
by clicking on the corresponding button, or to vali-
date each feature separately. Validated features are
the same as those defined by the interactive segmen-
tation mode. The possible feedbacks are nominal and
numerical values. The nominal value is either a val-
idation or a comment to invalidate incorrect features.
Indeed, the validation mode feedback allows the re-
sults to be commented. For instance, the detected area
can be commented as to be ”too small” by the radiol-
ogist. The value range is 1-7.
4.5 Reporting
4.5.1 Standardised Reporting System
The ACR promoted the BI-RADS standard to solve
problems of non-uniform, vagueness and inconclu-
sive reporting (ACR, 2007). The BI-RADS is an as-
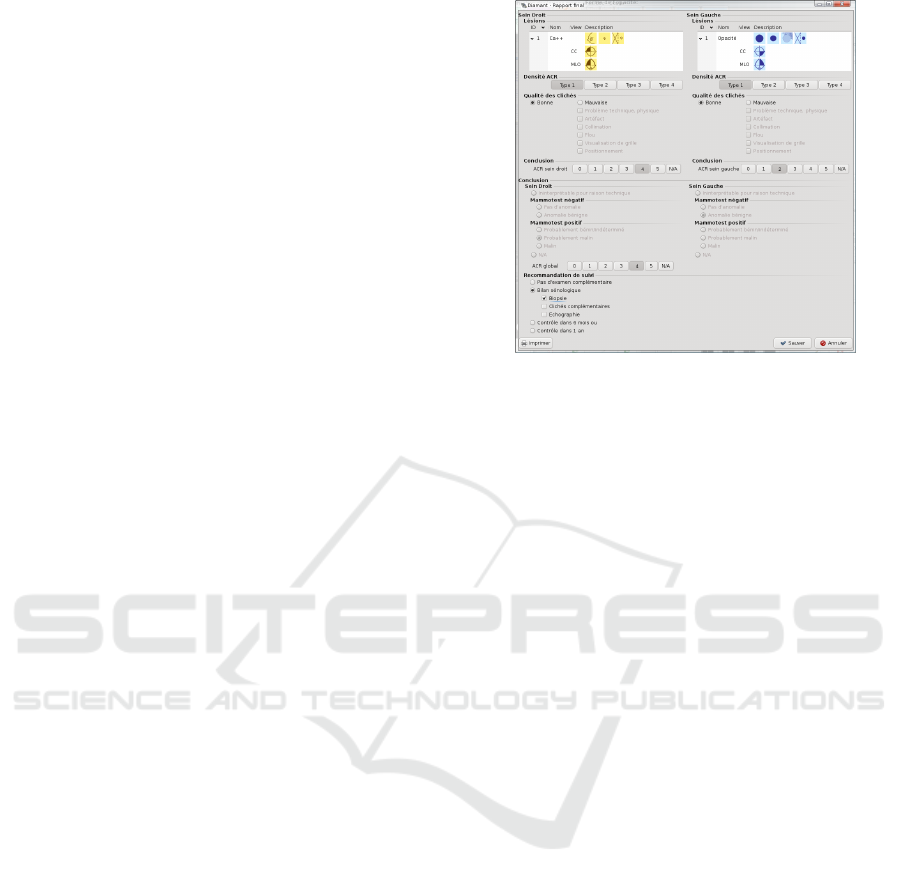
Figure 8: Form for the reporting task.
surance quality system designed to provide a uniform
verbal description for any significant finding and a
clear, concise and directive reporting in order to re-
duce complexity and variability of interpretation and
of decision-making. The BI-RADS classification and
reporting tool improves the biopsy recommendations
and the feature analysis agreement with experienced
breast imagers (Berg et al., 2002). The report incorpo-
rates a structured description of any significant find-
ing, the comparison to previous studies, the overall
impression, and follow-up recommendations.
4.5.2 Resulting Reporting Task and Form
The reporting task begins with the manual and the
semi-automatic annotation of findings and finishes
with a form filling using the reporting tools. The form
complies with the standard (Fig. 8). For each breast,
the tool displays the summary of the manual annota-
tion. The breast density has to be filled according to
four types: Type 1=the breast is almost entirely fat,
Type 2=there are scattered fibroglandular densities,
Type 3=the breast tissue is heterogeneously dense,
which could obscure detection of small masses; and
Type 4=the breast tissue is extremely dense, this may
lower the sensitivity of mammography.
The European guidelines for quality assurance
impose the radiologist to evaluate the quality of
each view. Then the radiologist final impression for
each breast has to be classified among six assess-
ment categories: need imaging evaluation (ACR0),
no finding (ACR1), benign finding(s) (ACR2), proba-
bly benign finding(s) (ACR3), suspicious abnormal-
ity (ACR4), and highly suggestive of malignancy
(ACR5). The final recommendation consists in the ra-
diologist decision-making, which is simplified thanks
to the ACR assessment categories (ACR, 2007).
HUCAPP 2021 - 5th International Conference on Human Computer Interaction Theory and Applications
66

5 EXP. #1: PIE VS. STAR MENUS
Objectives. The objective of this study was to eval-
uate the usability of the pie and star menus (pie-
star menus) during the annotation of BC findings.
We used task completion, time on task and num-
ber of clicks and user satisfaction as usability criteria
(Nielsen and Molich, 1990; Organisation, 2018).
Participants. Nine volunteers (3 females) aged
between 43 and 58 participated in this study. All were
experimented breast radiologists practicing in differ-
ent hospitals in Belgium. They were recruited regard-
ing their experience in BC screening. Computer skills
were assessed thanks to a background questionnaire.
All participants were familiar with computers, espe-
cially with medical computer-based applications and
all were experienced in visual search and navigation
activities on computer displays. They were average
mouse/keypad users with similar motor abilities.
Tasks. Participants annotated BC findings using
pie-star menus or an array of icons. Array and star
menu icons were exactly the same in terms of scheme,
colour and size. The array allows the sequential selec-
tion of finding characteristics in the following order:
lesion type, type-related characteristics (each charac-
teristic has to be described one at a time), comparison
to previous studies, and location. Fig. 9 presents the
array of icons displayed to describe the lesion type
(left) and the shape of any mass (right).
Experimental Setup and Apparatus. We em-
ployed a 2 × 5 factorial design with two experimental
conditions (pie-star menu versus array) and five med-
ical cases to characterize (i.e., five tasks). Each par-
ticipant carried out ten tasks: five per experimental
condition. We used counterbalancing of conditions
according to a 2 × 2 Latin Square design. We ran-
domized the order of the five medical cases per condi-
tion. Counterbalancing and randomization were used
to control task learning effects and inter-individual di-
versity. The tests were carried out in an isolated room
in each hospital. Participants were seated approxi-
mately 40 cm from the graphics tablet. Stroke ges-
ture annotation was used as input modality whereas
visual display was used as output modality. The com-
puter system used in this study was a computer with
an Intel Core2 Duo E8400 (3GHz) processor, 4 GB
of DDR SDRAM and a 9600GT Nvidia graphic card.
The gesture tablet was a WACOM CINTIQ 21UX.
DICOM images were loaded into the viewer.
Procedure. The sessions involved one volunteer
at a time. First, participants were given an oral pre-
Figure 9: Icons: Lesion type (left), Shape of a mass (right).
Table 2: ANOVA Procedure. DF stands for degree of free-
dom, AT for annotation time, and NC for number of clicks.
Bold used to highlight statistical differences.
Factors DF AT (sec.) NC
Condition 1 F=3.5605 p=.0605 F=.0216 p=.8832
View 1 F=5.6496 p=.0183 F=1.8155 p=.1792
Finding type 4 F=2.7884 p=.0274 F=9.0073 p<.0001
Table 3: Means and standard deviations of annotation times.
Factors N M (sec.) SD (sec.)
Condition Pie-Star 115 17.3478 12.8070
Array 105 20.5524 12.3304
View CC 138 20.5000 1.0629
MLO 81 16.3457 1.3874
Finding type Mass 69 16.2609 1.4949
Calcification 89 20.9438 1.3162
Arch. Dist. 39 17.6410 1.9883
Special case 5 31.6000 5.5531
Associated finding 17 18.8824 3.0116
sentation of the project, an explanation of their role
in the usability tests, and a demonstration of the func-
tionalities of the tool. Then, they started the training
session: one clinical case to annotate per experimen-
tal condition. Once they felt comfortable enough with
the tool and got used to the manipulation of the pen,
they were provided with the paper printed instruc-
tions, and the demographic and background question-
naires to fill prior to the actual test. After each con-
dition, they were asked to fill a satisfaction question-
naire. Then, after the two conditions, they were asked
to fill the IBM CSUQ (Lewis, 2006), a 19-item ques-
tionnaire which aims at evaluating the usability of a
system in terms of System Usefulness (SysUse), In-
formation Quality (InfoQual) and Interface Quality
(IntQual) on a 7-point Likert scale. The effective tests
lasted approximately 30 minutes.
Results. The sample includes 219 entries. Anal-
yses of variance (ANOVA) were used to examine
the presence of significant differences in task perfor-
mance, as measured by annotation time (sec.) and
number of clicks: per conditions (pie-star and array),
per view (CC and MLO), and per finding type (mass,
calcification, distortion, special case and associated
finding).
Annotation times show no statistically signifi-
cant difference between experimental conditions (Ta-
ble 2). However, they show a significant view ef-
fect (F=5.6496; p=.0183) and finding type effect
(F=2.7884; p=.0274). Regarding the number of
clicks, Table 2 shows a highly significant finding type
effect (F=9.0073; p<.0001). Table 3 shows manual
annotation of BC findings with pie-star menus (17.5
sec) is faster than with the array of icons (20.5 sec).
This difference may be a matter of visual perception:
the star menu displays simultaneously all the icons
User-centred Development of a Clinical Decision-support System for Breast Cancer Diagnosis and Reporting based on Stroke Gestures
67

Table 4: Means and standard deviations of number of clicks.
Factors N M (sec.) SD (sec.)
Finding type Mass 69 5.4637 0.2133
Calcification 89 4.5842 0.1878
Arch. Dist. 39 4.0256 0.2837
Special case 5 4.0000 0.7924
Associated finding 17 6.5882 0.4297
related to a finding type, whereas the array displays
the icons related to one characteristic at a time. By
contrast, the star menu enables the users to anticipate
their next clicks and, consequently, to be faster.
Furthermore, the results show that the annotation
of BC findings is faster in the MLO projection (16.34
sec) than in the CC projection (20.5 sec). This dif-
ference may be explained by the combination of the
following two reasons. First, in practice, breast radi-
ologists start the diagnostic by the analysis and inter-
pretation of the CC view. It may be natural to adopt
the same task order with the interactive tool. And it
may be normal that the examination lasts longer in
the first projection to be visualised (i.e., the CC pro-
jection) than in the second one (i.e., the MLO projec-
tion). Second (let us assume that the CC projection
was the first to be examined), findings such as masses
and calcifications need to be characterized in both
views. Thus, a ”Duplicate” button was implemented
to reduce the number of clicks necessary for the com-
plete annotation of findings. As a consequence, there
were fewer properties to be annotated in the second
projection (i.e., the MLO projection).
Finally, the speed and the number of clicks to per-
form the annotation task depend on the type of the
finding under annotation (Tables 2, 3 and 4). This
difference may be explained as follows. First, the
number of characteristics differs from a finding to an-
other (i.e., six characteristics for calcifications, five
for masses, and only three for distortions, special
cases and associated findings). Second, the large
amount of icons to remember (150) necessarily in-
volves a considerable learning time, and it sounds ac-
ceptable that the annotation of unusual findings such
as special cases and associated findings requires more
time and more clicks in comparison with masses, cal-
cifications and distortions which are more frequent.
User Satisfaction and Preferences. Participants
considered the interaction with the system as natu-
ral, intuitive and reliable. A majority of participants
(8) hesitated less than five times, and all were sat-
isfied with the compliance with the BI-RADS. Five
participants expressed very positive judgments on
the star menu in terms of information visualization,
speed and comfort. They preferred the star menu be-
cause ”it enables the parallel visualization of the items
thanks to its spatial organization”, ”it is more com-
fortable thanks to its position close to the centre of
the screen”, and ”it is faster [than the array]”. Four
participants preferred the array because ”it is usual”
and ”the characteristics follow a logical sequence”.
These results are consistent with the CSUQ results:
SYSUSE (M=5.46, SD=.96), INFOQUAL (M=5.56,
SD=1.11), INTERQUAL (M=5.81, S D=0.88), and
OVERALL (M=5.56, SD=1.89) are all above 5. The
interface quality, especially, is assessed very posi-
tively by the participants.
6 EXP.#2: MASS SEGMENTATION
Objectives. The purpose of this study was to evaluate
the interactive mass segmentation method, its usabil-
ity, and the relevance of the features chosen for the
user feedback. The field tests took place in radiology
department in the presence of both the radiologist and
the experimenter. The tests involved three steps: (1)
the experimenter presented the instructions, (2) the
user drawn a ROI around the masses into the image
database; and (3) when the interface highlighted the
resulted segmentation, the user gives a feedback for
interactive segmentation or for validation.
Method. We employed a think-aloud protocol:
participants were asked to comment all steps of their
actions and the results obtained. To assess the perfor-
mances of the algorithm, the extracted features from
segmentation together with the feedbacks were auto-
matically collected and recorded into a log file. Since
the initial algorithm was chosen from literature, the
evaluation of the interactive segmentation consisted in
comparing initial and final segmentations. The indi-
cators of performance were: (1) the distance between
the initial solution and the final solution (evaluation
of the chosen algorithm performance), (2) the number
of feedbacks returned by the user to acquire the final
solution (validation of the feedback performance and
the interactive segment usability), (3) the satisfaction
of the user on the final segmentation/detection.
Experimental Set-up and Procedure. Three ra-
diologists annotated 35 masses each: ten circum-
scribed masses, seven microlobulated masses, one ob-
scured mass, three indistinct masses, and eleven spec-
ulated masses. Participants were able to require new
segmentation solutions until they were satisfied with
the results. Then, they could return a validation feed-
back and their assessments of the final segmentation.
The performance was measured in number of clicks
(feedbacks) to get the solution, and the evaluation of
the segmentation (Fig. 10).
Results. Since radiologists ask for a good solu-
tion with a minimum of clicks, the usability of the
HUCAPP 2021 - 5th International Conference on Human Computer Interaction Theory and Applications
68
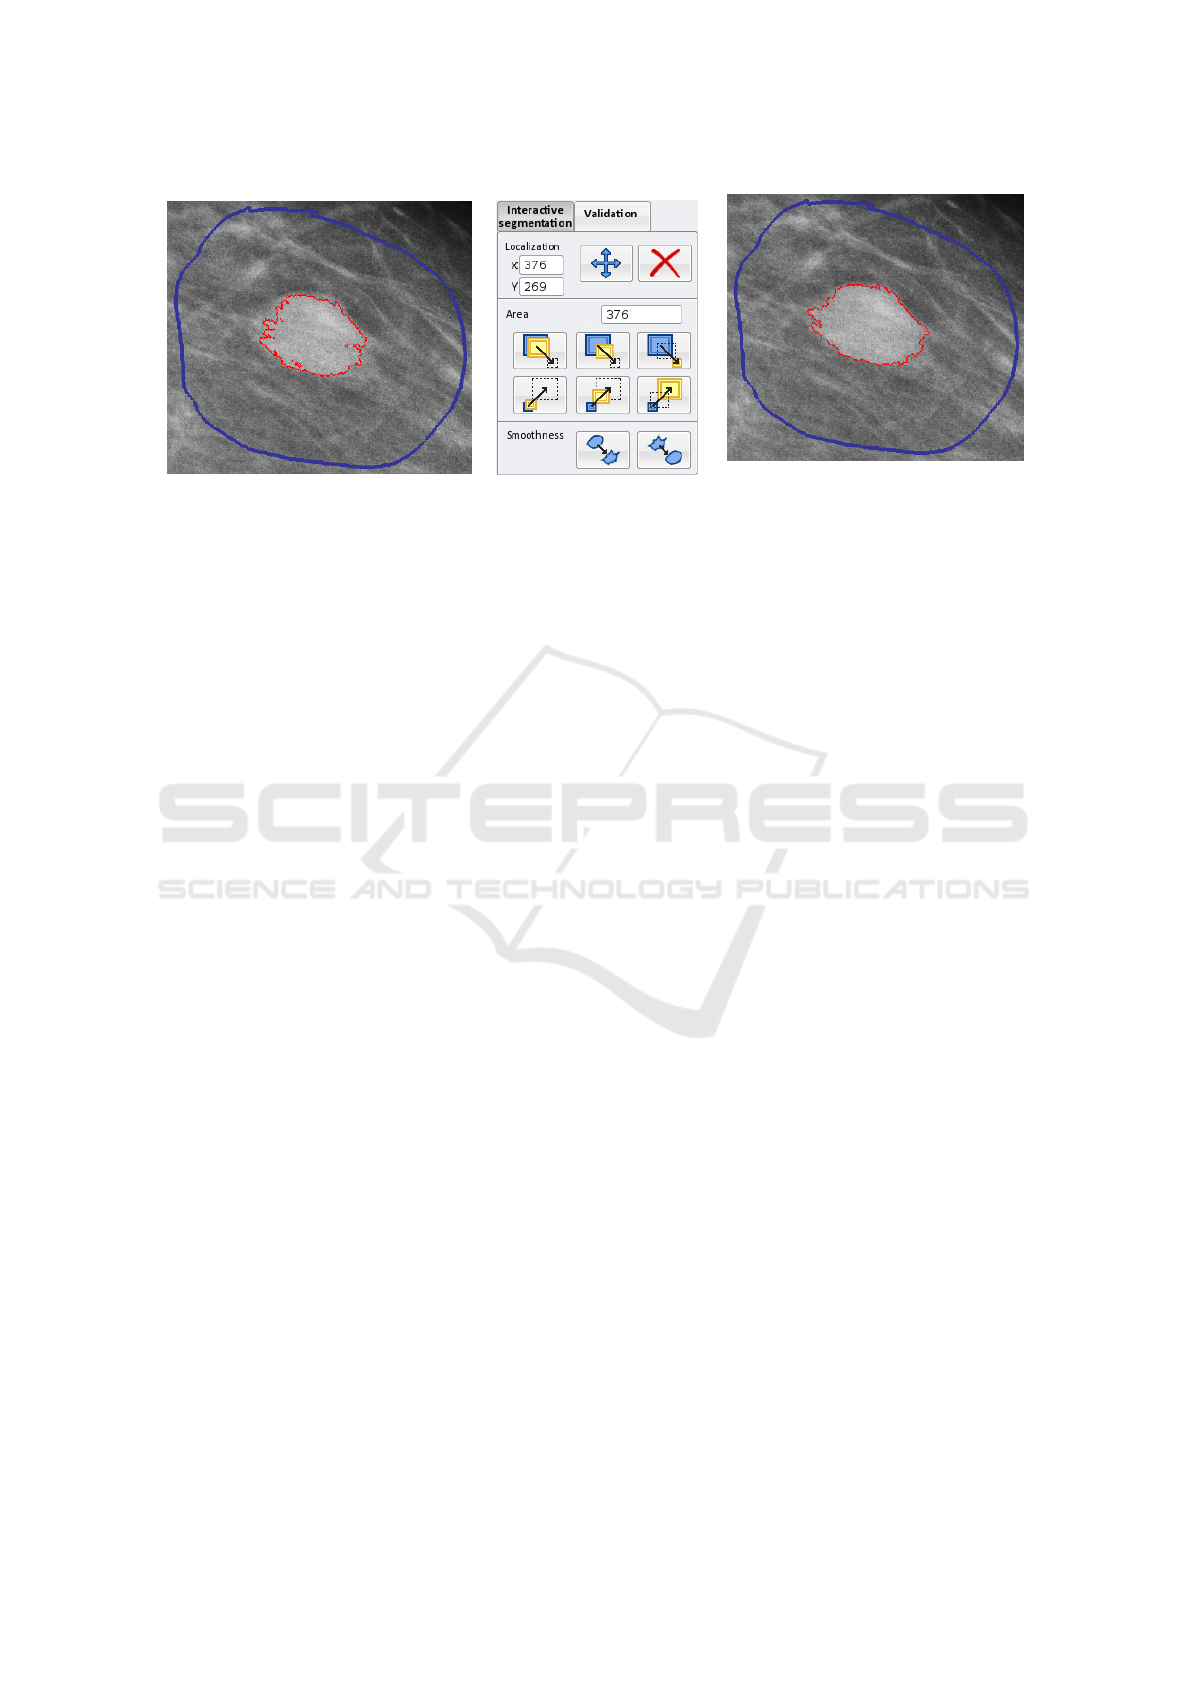
(a) Selection of a ROI (blue) and automatic
mass segmentation (red).
(b) User interface dedicated to user
feedback.
(c) Improved mass segmentation taking
into account the feedback: “enhance
moderately” and “smooth over”.
Figure 10: Selection of a region of interest.
system directly depends on the number of returned
feedbacks and the number of counter-feedbacks (er-
roneous user actions). The mean number of feed-
backs per image relatively to the mass size is as
follows: ”reduce” (S+M+L: M=1.94), ”Enhance”
(S+M+L: M=1.91), total amount of clicks (M=3.81),
and counter-feedbacks (M=.61). For the smooth-
ness of the contour, the results are: ”Sharpen”
(M=.52), ”Smooth” (M=1.32), total amount of clicks
(M=1.42), and counter-feedbacks (M=.1). Conse-
quently, contours need to be regularized at least once.
This change has to be included in the initial seg-
mentation to limit the number of clicks. Participants
returned more feedbacks to enhance than to reduce
the size of microlobulated and speculated masses and
slightly reduced most of the mass areas. Nevertheless,
the optimal segmentation threshold could not be au-
tomatically reduced to increase these performances,
as this would have increased the probability of an er-
roneous initial segmentation at the same time. The
feedbacks related to the seed point displacement show
that participants moved in average the seed point 0.16
times per ROI: the mass centre is generally well-
localized. These observations and the analysis of the
log files show that participants tested the feedback in-
terface on the first cases and gave a large number of
counter-feedbacks for these cases.
User Satisfaction. The think-aloud protocol, to-
gether with the user feedback in the validation mode,
provided an important set of users’ subjective opin-
ions. Radiologists underlined that their feedback im-
prove the accuracy of the segmentation. Moreover,
they reported that the interactive segmentation design
can provide a well-localized solution, even if the ini-
tial segmentation failed. In addition, the feedback in-
terface requires the radiologist to return a subjective
evaluation of the final segmentation with two scores
according to a 7-point Likert scale (1= “the final re-
sult is very bad”, 7= “the final result is very good”).
These two scores measured were: the accuracy of the
segmented area (M=5.88) and the accuracy of the
contour regularity (M=5.68). Satisfaction scores are
high for the final segmentation with a mean score of
5.88. The feedback interactive scenario was approved
in terms of graphical design, feedback components,
and reactions of the system to the user commands.
The system was judged to be easy-to-use and radi-
ologists felt that they had the ability to improve the
segmentation results with a simple request on a but-
ton.
According to a participant, the feedback design
could be improved by leaving open the possibility of
selecting and moving the points of the contour. In
that case, the algorithm should calculate an optimal
segmentation from the current segmentation together
with the points moved during the interaction. The
radiologists asked for sharp contours surrounding ir-
regular findings and for smooth contour surrounding
round or oval ones. The design action for smooth-
ness feedback will be improved with the active con-
tour models.
7 EXP. #3:
MICROCALCIFICATION
SEGMENTATION
Method. To evaluate the interactive microcalcifica-
tion detection and segmentation method, field tests
based on a think-aloud prototcol were conducted sim-
ilarly to the experiment #2 with both the radiologist
and the experimenter. Features extract from the seg-
mentation together with the user feedback were au-
tomatically collected and recorded in a log file ac-
cording to the same protocol defined in experiment
User-centred Development of a Clinical Decision-support System for Breast Cancer Diagnosis and Reporting based on Stroke Gestures
69

Table 5: Evaluation of microcalcification detection.
Measure Value
Number of initially detected microcalcifications 367
Number of microcalcifications after radiologist validation (TP: true positives) 323
Number of added microcalcifications (FN: false negatives) 12
Number of deleted microcalcifications (FP: false positives) 41
#2. Each participant was instructed to annotate 20
clusters, i.e., 323 microcalcifications, and three false
clusters to evaluate the performance of the detection.
Three radiologists tested the system.
Results. Table 5 reports the results of the micro-
calcification detection: the false-negative rate is low
(
FN
T P
=
13
323
=2.7%) for a reasonable false-positive rate
(
FP
T P
=
41
323
=12.7%). The missed findings are due to
the breast image density or the mass densities. The
false-positive markers correspond to visual artefacts
that the system detects as findings. Thus, the over-
all sensitivity is equal to
T P
T P+FN
=96.4%. Participants
were instructed to draw a ROI with no findings inside
and to annotate it as a cluster of microcalcifications
even no microcalcification exists. Regardless to the
erroneous annotation, the detection found the true re-
sult with zero microcalcification inside the ROI (true-
negative).
Participants returned an average number of 2.94
feedbacks per cluster (Table 5: average number
of “Add” feedbacks=0.66 plus average number of
“Delete” feedbacks=2.27). This average is fair and
reasonable depending on the detection rate and the
image quality. Some clusters that include many vi-
sual artefacts require more user feedbacks. Then, the
microcalcification suppression mode is not appropri-
ate for this kind of image. Consequently, radiologists
asked for the opportunity to delete at one time sev-
eral microcalcifications. During the thinking-aloud
session, participants underlined the importance of not
missing any cluster (one speaks about cluster while
three or more microcalcifications are detected). One
participant gave a pretty good appreciation, while re-
porting that missing a microcalcification is less sig-
nificant than missing a cluster. The importance of
computing the number of microcalcifications by clus-
ter was underlined as well. Radiologists’ comments
were clinically correct, but only a very accurate mi-
crocalcification detection can detect all cases.
8 CONCLUSION
This paper presents how a user-centered design pro-
cess was conducted for an integrated clinical deci-
sion support system for breast cancer annotation and
reporting. The iterative user-centred design used to
best fit radiologists’ needs and expectations led to the
implementation of multi-fidelity prototypes combined
with a scenario-focused questionnaire. Usability eval-
uations were conducted both in vitro (usability labora-
tory) and in vivo (field testing) with high-fidelity pro-
totypes resulting from the previous process. Stroke
gesture interaction was initially selected as the input
modality to interact with the system, which is natural
to annotate regions of interest of medical images. To
avoid that the huge amount of possible annotations
negatively affect gesture remembrance, two modes
for the standardised stroke gesture annotation of BC
findings were finally designed: a manual annotation
specifically designed and implemented to support ra-
diologists’ activities, a semi-automatic annotation re-
lies on image processing, especially on lesion detec-
tion and segmentation, combined with relevance feed-
back to improve the segmentation results.
The user-centered approach combined three us-
ability evaluations with three different methods (i.e.,
scenario-based design, multi-fidelity prototyping, and
lab/field testing): (1) an evaluation of the interac-
tion techniques supporting the manual annotation of
BC findings: a combination of pie and star menus;
(2) an evaluation of the semi-automatic annotation of
masses; and (3) an evaluation of the semi-automatic
annotation of (clusters of) microcalcifications.
Participants expressed very positive assessments
on the star menu in terms of information visualiza-
tion, speed and comfort and on the user interface.
The feedback interaction was reported as relevant and
easy-to-learn. The overall system was perceived easy-
to-use and adapted to the human activity. The signif-
icance of the work can be highlighted regarding two
considerations. First, the attention paid to the users
and the usability. Its major benefit is the improvement
of the user experience with CDSS, as the resulting
platform is not only useful, but also usable. In par-
ticular, the pie and the star menus lead to better user
performances, although users thus had no previous
experience with this unusual interaction style. Sec-
ond, the development method which combined pro-
totyping tools and techniques. What is relevant and
innovative in the method adopted here is, on the one
hand, how the design process, the prototypes, and
the usability evaluations were unified with the cen-
tral goal to put the user at the centre of the develop-
ment process; and, on the other hand, how they pro-
vided specific and complementary information. What
is promising is how this combination of selected HCI
techniques led to the acceptability of the system by
the target final users. A major burden was encoun-
tered in this process when it required a substantial
amount of collected data and individual interviews
with a high level of details, the availability of rep-
HUCAPP 2021 - 5th International Conference on Human Computer Interaction Theory and Applications
70

resentative end users (who are particularly solicited
by their work), and the introduction of non-traditional
interaction techniques.
REFERENCES
(2007). Breast imaging reporting and data system (BI-
RADS
R
) atlas. American College of Radiology, Re-
ston, VA, USA, 5 edition.
Bellik, Y., Pruvost, G., Kameas, A., Goumopoulos, C., Ha-
gras, H., Gardner, M., Heinroth, T., and Minker, W.
(2009). Multidimensional pervasive adaptation into
ambient intelligent environments. In Eighth IEEE Int.
Conf. on Dependable, Autonomic and Secure Comput-
ing, DASC ’09, pages 303–308. IEEE Comp. Society.
Berg, W. A., D’Orsi, C. J., Jackson, V. P., Bassett, L. W.,
Beam, C. A., Lewis, R. S., and Crewson, P. E. (2002).
Does training in the breast imaging reporting and data
system (bi-rads) improve biopsy recommendations or
feature analysis agreement with experienced breast
imagers at mammography? Radiology, 224(3):871.
Callahan, J., Hopkins, D., Weiser, M., and Shneiderman,
B. (1988). An empirical comparison of pie vs. linear
menus. ACM.
Cheng, H., Cai, X., Chen, X., Hu, L., and Lou, X. (2003).
Computer-aided detection and classification of micro-
calcifications in mammograms: a survey. Pattern
Recognition, 36(12):2967 – 2991.
Costabile, M., Fogli, D., Fresta, G., Mussio, P., and Pic-
cinno, A. (2003). Computer environments for improv-
ing end-user accessibility. In Universal Access Theo-
retical Perspectives, Practice, and Experience, pages
129–140, Berlin, Heidelberg. Springer.
Coyette, A., Kieffer, S., and Vanderdonckt, J. (2007). Multi-
fidelity prototyping of user interfaces. In Baranauskas,
C., Palanque, P., Abascal, J., and Barbosa, S. D. J.,
editors, Proc. of INTERACT ’07, pages 150–164.
Danli Wang, Guozhong Dai, H. W. S. C. C. (2008).
Scenario-focused development method for a pen-
based user interface: model and applications. The
Journal of Supercomputing, 46:139–149.
Dengler, J., Behrens, S., and Desaga, J. F. (1991). Seg-
mentation of microcalcifications in mammograms. In
Mustererkennung 1991, pages 380–385. Springer.
Kieffer, S., Coyette, A., and Vanderdonckt, J. (2010). User
interface design by sketching: A complexity analysis
of widget representations. In Proc. of EICS ’10, page
57–66, New York, NY, USA.
Kupinski, M. A. and Giger, M. L. (1998). Automated
seeded lesion segmentation on digital mammograms.
IEEE Trans. on Medical Imaging, 17(4):510–517.
Lewis, J. R. (2006). Sample sizes for usability tests: Mostly
math, not magic. interactions, 13(6):29–33.
Montero, F., L
´
opez-Jaquero, V., Vanderdonckt, J.,
Gonz
´
alez, P., Lozano, M., and Limbourg, Q. (2006).
Solving the mapping problem in user interface design
by seamless integration in IdealXML. In Proc. of
DSV-IS’2006, pages 161–172.
Moyle, M. and Cockburn, A. (2002). Analysing mouse and
pen flick gestures. In Proc. of the Symp. on Comp.-
Human Int., CHINZ ’02, page 19–24.
Nielsen, J. and Molich, R. (1990). Heuristic evaluation of
user interfaces. In Proceedings of the SIGCHI Confer-
ence on Human Factors in Computing Systems, CHI
’90, page 249–256, New York, NY, USA. Association
for Computing Machinery.
Organisation, I. S. (2018). ISO 9241-11:2018 – Ergonomics
of human-system interaction — Part 11: Usability:
Definitions and concepts. ISO/TC 159/SC 4 Er-
gonomics of human-system interaction.
Pawloski, P. A., Brooks, G. A., Nielsen, M. E., and Olson-
Bullis1, B. A. (2019). A systematic review of clinical
decision support systems for clinical oncology prac-
tice. Journal of the National Comprehensive Cancer
Network, 17(4):331–338.
Perry N., Broeders M., d. W. C. T. S. H. R. v. K. L. P. E.
(2006). European Guidelines for Quality Assurance
in Breast Cancer Screening and Diagnosis. Office for
Official Publications of the European Communities,
Luxembourg, 4 edition.
Rosson, M. B. and Carroll, J. M. (2002). Scenario-Based
Design, page 1032–1050. L. Erlbaum Associates.
Ruthven, I. and Lalmas, M. (2003). A survey on the use
of relevance feedback for information access systems.
Knowl. Eng. Rev., 18(2):95–145.
Sainfort, F., J. J. E. P. and Booske, B. (2017). Human-
Computer Interaction in Healthcare, volume Design-
ing for Diverse Users and Domains, pages 137–154.
Sefelin, R., Tscheligi, M., and Giller, V. (2003). Paper pro-
totyping - what is it good for? a comparison of paper-
and computer-based low-fidelity prototyping. In Ex-
tended Abstracts, CHI EA ’03, page 778–779. ACM.
Simonin, J., Kieffer, S., and Carbonell, N. (2005). Effects of
display layout on gaze activity during visual search. In
Proc. of INTERACT ’05, pages 1054–1057. Springer.
Skaane, P. and Skjennald, A. (2004). Screen-film mam-
mography versus full-field digital mammography with
soft-copy reading: Randomized trial in a population-
based screening program—the oslo ii study. Radiol-
ogy, 232(1):197–204. PMID: 15155893.
Vanderdonckt, J., Magrofuoco, N., Kieffer, S., P
´
erez, J.,
Rase, Y., Roselli, P., and Villarreal, S. (2019). Head
and shoulders gestures: Exploring user-defined ges-
tures with upper body. In Proc. of HCI Int.’2019,
pages 192–213, Cham.
Vanderdonckt, J., Roselli, P., and P
´
erez-Medina, J. L.
(2018). !FTL, an articulation-invariant stroke gesture
recognizer with controllable position, scale, and ro-
tation invariances. In Proceedings of the 20th ACM
Int. Conf. on Multimodal Interaction, ICMI ’18, page
125–134. ACM.
Vinnicombe, S., Pinto Pereira, S. M., McCormack, V. A.,
Shiel, S., Perry, N., and dos Santos Silva, I. M. (2009).
Full-field digital versus screen-film mammography:
Comparison within the uk breast screening program
and systematic review of published data. Radiology,
251(2):347–358. PMID: 19401569.
Wittenberg, T., Elter, M., and Schulz-Wendtland, R. (2007).
Complete digital iconic and textual annotation for
mammography. In Bildverarbeitung f
¨
ur die Medizin
2007, pages 91–95. Springer.
Zheng, Y., Wu, M., Cole, E., and Pisano, E. D. (2004). On-
line annotation tool for digital mammography. Aca-
demic Radiology, 11(5):566 – 572.
User-centred Development of a Clinical Decision-support System for Breast Cancer Diagnosis and Reporting based on Stroke Gestures
71
