
Understanding How People Weigh the Costs and Benefits of using
Facebook
Jack McClary
1
and Sid Stamm
2
1
Independent Researcher, Seattle, WA, U.S.A.
2
Rose-Hulman Institute of Technology, Terre Haute, IN, U.S.A.
Keywords:
Privacy, Cost-benefit Analysis, Social Network.
Abstract:
Much work in privacy focuses on educating a system’s users so they will be better armed to take action based
on the benefits and drawbacks of how their data is treated. Intuitively, this makes sense; one may expect people
who perceive more benefit than risk in a system will elect to use it, but our research shows that is commonly not
the case. We surveyed users of a social network to quantify what they perceive as the benefits and drawbacks
of the platform. Given their net “value” perceived, we would have expected those who see mostly drawbacks
(or a net cost) in its use to abandon the platform for a more privacy-preserving alternative. What we found was
that only 62% of individuals we surveyed acted so rationally—the remainder either chose to use a platform
they felt had a negative impact on their life, or chose to abandon one that served them favorably. This result
indicates there are strong factors beyond rational cost/benefit analysis that lead people to decide what social
platforms they use. This means that privacy professionals must focus not only on building transparency and
choice, but also constructing viable alternatives so people do not feel pressured into using a platform they see
as a net loss of personal privacy.
1 INTRODUCTION
When you interact with a service or entity, you re-
veal some information about yourself. In the physi-
cal world, most people are aware of what information
they are giving to those around them and how it can
be used (Mayer-Schonberger, 2009). Online, how-
ever, this is not always the case: many online services
will sell or use the information they gather about their
customers for non-obvious purposes. While these ser-
vices typically provide access to privacy policies that
outline this behavior, McDonald et al. showed that
even after participants read the privacy policy, gener-
ally they still do not fully understand how their infor-
mation can be used (McDonald et al., 2009). This fail-
ure to understand privacy policies implies that there
is a disparity between what information is correct and
what the reader believes is correct (Staszak, 2016).
This gap in understanding, which we refer to as the
“privacy perception gap”, may even manifest as ani-
mosity and distrust towards the service. While a sig-
nificant amount of research has been done on how to
close this gap (Kay and Terry, 2010; Kunze, 2008;
Lavesson et al., 2008), we seek to identify how read-
ers use their understanding to interact with online sys-
tems. For example, Kelley et al. created a graph-
ical representation of privacy policies to help read-
ers understand the information intended to help them.
They were successful in creating a chart that allows
users to quickly interpret privacy policies more ac-
curately, however, they did not measure the differ-
ence in a user’s willingness to continue using the soft-
ware (Kelley et al., 2009). What we want to under-
stand is, once people know what an online service
does with their data, will they act according to their
judgment about how respectfully the service treats
their data.
2 RELATED WORK
Privacy is increasingly important to users of Face-
book, according to Dey et. al (Dey et al., 2012). In
2018, Vishwnath et al. showed how people attempt to
balance “social fulfillment” with their privacy settings
on Facebook (Vishwanath et al., 2018), and Govani et.
al show that students who are aware of risks still over-
value social interactions (Govani and Pashley, 2007).
Balancing privacy and social fulfillment can only be
526
McClary, J. and Stamm, S.
Understanding How People Weigh the Costs and Benefits of using Facebook.
DOI: 10.5220/0010258405260533
In Proceedings of the 7th International Conference on Information Systems Security and Privacy (ICISSP 2021), pages 526-533
ISBN: 978-989-758-491-6
Copyright
c
2021 by SCITEPRESS – Science and Technology Publications, Lda. All rights reserved

rationally done if people are fully aware of how their
data is used and and can control it. Many have worked
on the problem of closing the privacy perception gap
by educating users, and the strategies for this vary.
One strategy is to make privacy policies easier to
understand. Kelley et al. propose standardized quick
summary charts (“nutrition labels”) for privacy poli-
cies to enable users quick access to the personal in-
formation being used (Kelley et al., 2009). There
were many iterations of these labels culminating in
a grid of colorful symbols representing what infor-
mation would always be taken, what information the
user could opt-out of being taken, what information
the user could opt-into being taken, and what infor-
mation would not be taken. The researchers found
subjects were receptive to this display and also that
subjects could more quickly and accurately answer
questions about privacy policies represented in this
fashion. While this is a successful way to educate
users, the authors did not measure how this affected
a participant’s desire to use the software behind the
privacy policy.
Another gap-closing strategy is to standardize the
format and language of End User License Agreements
(EULAs) themselves. Kunze et al. assert that a
standard format would balance power between users
and developers and provide a fair mechanism for dis-
putes (Kunze, 2008). This work argued that improv-
ing EULAs could improve “virtual world” software,
arguing standardization provides both legal and eco-
nomic improvements. By forcing EULAs to be in
plain language, the authors assert companies will ben-
efit from informed consent agreement stronger than
what is often standard practice (signing the EULA
without reading it). When these standard EULAs giv-
ing all the power to the developers are challenged
in court, the agreements often failed to hold (Kunze,
2008). By giving more power to the user, these agree-
ments become more reliable, and not just easier to un-
derstand. By examining both sides of EULAs, Kunze
et al. assert this standardization would help both com-
panies and users by balancing power and making the
agreements more binding (Kunze, 2008).
A similar practice of making a unified format
could be used with privacy policies; many have tried
similar approaches, such as icons (Holtz et al., 2011;
?) or short privacy notices (Utz et al., 2019) (cookie
notices often used to comply with GDPR). Hoping
to automatically standardize privacy policies, Hark-
ous et al. developed Polisis (a machine learning-
based privacy policy analyzer) to interpret and present
privacy policies at a higher level more accessible to
users (Harkous et al., 2018).
Other work turns privacy notices and policies into
something users can interact with to learn more about
the site’s privacy practices. The Pribots project (Hark-
ous et al., 2016) attempts to close the privacy per-
ception gap with a virtual entity with which users
may converse to learn about their privacy choices and
settings. Other work suggests boosting the usabil-
ity of privacy settings themselves will aid educated
users (Lipford et al., 2008; Liu et al., 2011).
In “Noticing notice,” Good et al. used a partic-
ipant’s acceptance of software as an indication that
education was successful (Good et al., 2007). Their
work is similar to this paper’s contributions, but does
not capture the case where the users identify a prod-
uct as beneficial yet still avoid using it. In “Noticing
notice,” participants were asked to read EULAs and
were shown a summary of the EULA before or af-
ter the consent page (depending on which group they
were assigned). When compared with the group that
was not given any summary, Good et al. noted that
those who were pre-briefed with a summary spent
more time installing the software and often declined
agreements. The authors asserted that effective edu-
cation leads to a change in behavior, but it is not ob-
vious that “knowing” leads to “doing”.
In this paper, we further examine the “Noticing
notice” underlying assumption (Good et al., 2007)
that education about a site’s data practices will change
users’ behaviour.
3 DO PEOPLE ACT ON THEIR
EDUCATION?
We hypothesize that educating people on risks associ-
ated with a social networking site has a smaller effect
than expected from rational actors. To limit the scope
of this paper we focused on one social network: Face-
book. To break down our hypothesis into questions
we can test, we split it into three parts.
Question 1. Do people realize that there is an in-
herent risk to using social media?
We expect they do since many security breaches
and controversial policies have been in the news re-
cently, and thus educated people more about risks of
using the Internet. This combined with a broad defini-
tion of risk (a possible negative impact on one’s life)
suggests that most people will be aware of the risks.
Identifying whether people see this inherent risk will
motivate the other two questions because people must
make non-trivial decisions based on their education.
Understanding How People Weigh the Costs and Benefits of using Facebook
527

Question 2. Do people practice reasonable cost
benefit analysis?
We expect they do not because many people con-
sider social media to be a waste of time. This com-
mon perception reduces perceived value in social me-
dia, so even if the risk and impact of loss is low, the
cost of participation will still outweigh any potential
value. Question 2 is core to this paper: if people do
not behave in alignment with their values, changing
their values (via education) will not likely change be-
haviour.
Question 3. Does perceived value from Facebook
directly correlate to frequency of use?
If people employ cost benefit analysis, we expect
those who see less (or negative) value from Facebook
to have less motivation to use it, or they may perceive
more value in aspects of Facebook that do not re-
quire consistent use. Furthermore, we anticipate peo-
ple who fail to practice cost-benefit analysis will see a
very small negative value in Facebook, which may in-
dicate the effort of deactivating their account doesn’t
seem worth the time required.
3.1 Contributions
Much work is being done to see if users can be effec-
tively educated, and some even interpret their reaction
as purely a result of their education, but it is not clear
if people are truly using their education to make deci-
sions. Our work suggests they don’t.
In this paper, we use the results of a survey to
show that (1) people realize there is potential risk or
costs in using Facebook, (2) even knowing there is a
cost, peoples’ usage patterns do not commonly align
with their perception of cost or benefit in use of the
social network, and (3) there is a correlation between
a person’s perceived value of Facebook and their in-
tensity of use. We also dig deeper into our results to
draw some additional insights about what externali-
ties may influence peoples’ perception of costs and
benefits of using Facebook.
4 METHODOLOGY
While we seek general knowledge about all social net-
working platforms, our survey focused on the most
widely used network on our campus: Facebook. To
answer the three questions listed in Section 3, we ad-
ministered a survey to volunteers from the student
population of our university to measure their percep-
tion of risks and values, and their usage patterns of
Facebook.
Our work was conducted with an exemption
granted by our university’s ethics board (Institutional
Review Board) as protocol #RHS0329. To protect
the subjects, all identifying information was sepa-
rated from survey responses and after data collection
was completed, the identifying information was de-
stroyed.
Our survey was split into two parts: (1) we first
gathered information on how intensely individuals
used the social network if at all, and then (2) iden-
tified what attributes people deem to be benefits (val-
ues) and costs (risks) of using the social network.
4.1 Identifying Value and Risk
Perceptions
Perceived value ratings are relevant to all three ques-
tions we seek to answer. We asked survey respon-
dents what they perceive as both positive and nega-
tive aspects of using Facebook. From their answers,
we can identify where the population generally per-
ceives risk, where they see benefit, and the intensity
of these feelings.
We hypothesized that the net perceived value (sum
of benefits minus sum of costs) directly correlates
with intensity of use on the social network. Specif-
ically, respondents who see more value than risk to
their activities on the site will choose to use it and
those who see more risk than value will choose not
to use it. This leads us to classify “rational” actors as
those whose usage follows their perceived value.
On one hand, those who see Facebook as a net
positive are rational actors if their perceived bene-
fit (value) outweighs the perceived cost (risk), and
it would follows that such a respondent would use
the platform. On the other hand, those who perceive
Facebook to be a net negative (more risk than value)
are rational actors if they choose to avoid or lessen
their use of the platform.
4.2 Identifying Usage Patterns
Usage pattern questions are needed to gather data on
how often or with what intensity a respondent uses
Facebook. These patterns are identified by the user’s
frequency of use, account history with Facebook, and
whether they have decided to deactivate their account
(and how long ago). This part of the survey is not
only necessary to find a correlation between usage in-
tensity and value seen, but also informed us about re-
spondents’ decisions on whether to use Facebook or
not.
Combining this usage information with that of the
value and risk parts of the survey, we can estimate
ICISSP 2021 - 7th International Conference on Information Systems Security and Privacy
528

whether or not the respondents are rationally applying
cost-benefit analysis on their use of Facebook.
4.3 Survey Design
At first we sought mainly to answer Question 2, so the
surveys were designed with information needed to de-
termine if people weigh the costs and benefits of using
Facebook. Question 3 is an extension of Question 2,
seeking whether people use Facebook with intensity
matching their perception of its net value. Related,
we anticipated existence of a specific value percep-
tion below which users deactivate their accounts. To
find this “minimum-bar”, we first needed to quantify
what peoples perceive as benefits and costs of using
Facebook.
We initially planned to present a series of posi-
tive and negative “aspects”, where respondents were
asked to rate how valuable they perceived the posi-
tive aspects, and how costly they perceived the neg-
ative ones. We noticed that classification into posi-
tive and negative categories would introduce bias so
we revised our survey to allow respondents to rate all
aspects on a scale including both costs and benefits.
The survey questions used a scale of -5 to 5, where
-5 was the highest cost and 5 was the highest bene-
fit. This way the authors’ judgment about “good” and
“bad” aspects should not influence the responses. To
create each aspect, we looked at different features of
Facebook and attempted to generalize their function,
for example the feature of showing a specific day in
a past year was isolated into “A way to connect with
your past”.
Iterative Bias Removal. Before administering the
survey, we attempted to remove bias (attempting to
make each aspect appear as it could be a cost or a
benefit) by making the language we used as neutral as
possible. Then we repeatedly asked a small set of peo-
ple how biased our set of “aspect” phrases sounded
and then revised the phrases. Our goal was to obtain
phrases as neutral or factual as possible, changing bi-
ased phrases like “a way for trackers to spy on me” to
more outcome-driven phrases like “a way for content
providers to target my interests”.
4.4 Collection
We offered the resulting email survey to the student
population of our university, offering five $10 gift
cards to randomly selected respondents to encour-
age responses. To handle the random reward, we
needed to collect personally identifying information
about our respondents in addition to their survey re-
sponses. In the interest of smooth IRB approval, we
split survey responses into two isolated data sets: one
that contained the research questions and one that
contained the respondent’s contact information. To
avoid “ballot box stuffing”, our survey verified a re-
spondent’s contact information was not yet in our data
set before splitting and recording the entire response.
This entire process was vetted and approved by our
university’s IRB, the survey data was collected by a
third party, and then only provided to us after be-
ing scrubbed of potentially personal information. We
protected privacy of our respondents by separating
their PII from their research question responses, and
only having access to contact information of the five
randomly-selected gift card winners. Once the gift
cards were distributed, the contact information data
set was destroyed.
We initially attempted to gather responses in per-
son, at our university’s dining hall. Given the large
majority of students walk through there every day, we
expected a good response rate. It turned out that very
few were willing to stop and take a short survey on
their way through the dining hall, so we elected to
request responses to the survey by sending a single
message to all 2200 university students. Within two
weeks we had collected 555 responses to the survey
with 450 unique and complete responses.
5 RESULTS
Before analyzing the results we removed any re-
sponses that did not fully complete the entire survey.
To our surprise, each question received a full range of
responses (-5 to 5) and so we were not able to remove
“outliers” based on any sort of response pattern.
The majority of respondents’ behavior regarding
Facebook does in fact reflect their net values. This im-
plies that further education of Facebook users about
how the platform uses their data would result in over-
all behavior change. However, the number of students
failing to practice risk analysis suggests that educa-
tion is not as effective as many believe.
Question 1 (Results). People realize there is risk in
the use of the social network platform. 98.6% of re-
spondents acknowledge risk existed in the platform.
This was identified by finding all respondents who
identified at least one negative response in the values
section of the survey; as prompted, this was a respon-
dent’s indication of a “cost” to using Facebook.
Understanding How People Weigh the Costs and Benefits of using Facebook
529
Question 2 (Results). People do not always prac-
tice reasonable cost benefit analysis. 62%, less than
two-thirds of respondents were identified as practic-
ing and acting on valid cost benefit analysis. This
was measured by comparing the sum of the values
assigned to aspects for each individual’s response to
whether or not the individual has an active account.
If the respondent perceived an overall negative value
(cost) and yet still uses the platform, we marked this
as not practicing cost benefit analysis. Value sums of
zero indicate neutrality, and we considered all such re-
spondents to be practicing cost-benefit analysis. (The
net-zero values are included in the 62% figure and
were less than two percent of responses.) The break-
down of the four possible groups is seen in Figure 1.
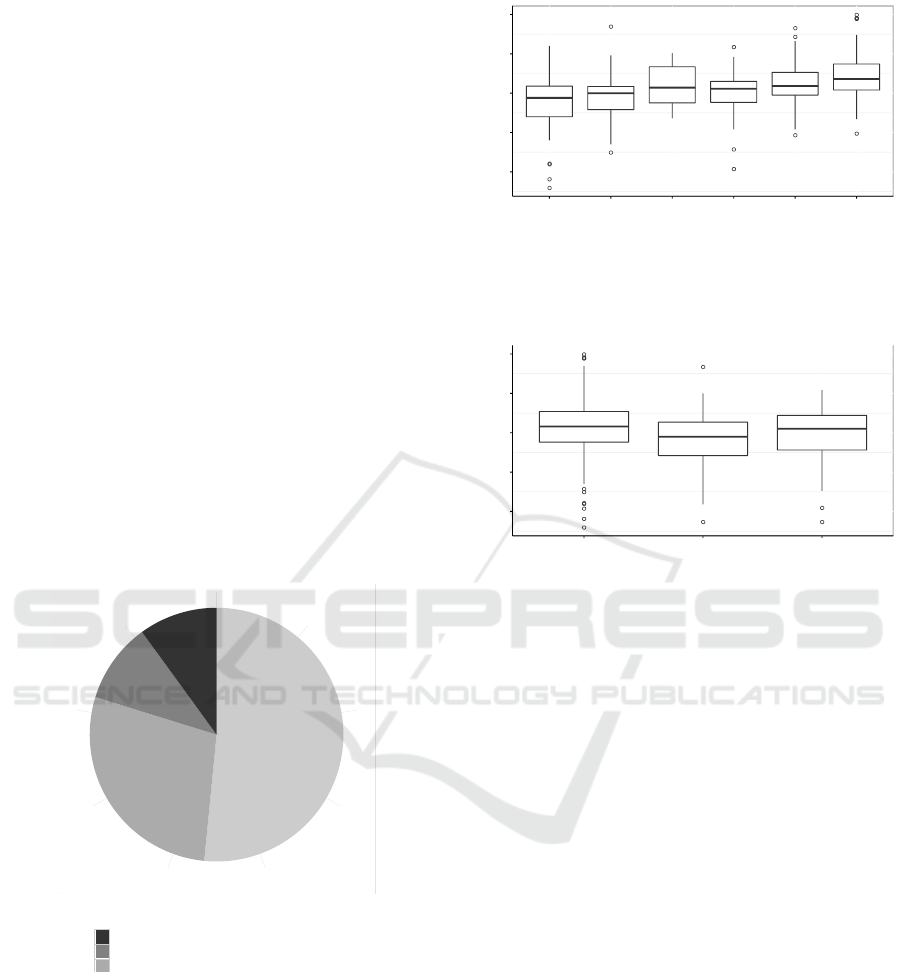
Question 3 (Results). There does seem to be a
slight correlation between perceived net value and in-
tensity of use. The positive correlation can be seen in
the trend displayed by the mean value results in Fig-
ure 2: the more positive value respondents perceive
in the platform, the more frequently they use it. It is
important to note that the range of perceived values is
not very wide; this suggests that as a whole, users of
the platform are fairly neutral.
Categories of Users
Don't Have Facebook See Negative ( 10% )
Don't Have Facebook See Positive ( 10.22% )
Have Facebook See Negative ( 28.22% )
Have Facebook See Positive ( 51.56% )
Figure 1: The breakdown of the net value respondents as-
sign to Facebook and whether they use it. 62% of respon-
dents either see a net negative value and have no account or
see net positive value and have an account. The remaining
38% seem to behave contrary to their value judgment of the
social network.
6 FURTHER INTERPRETATION
By administering a survey through an all-student
email, we were able to collect survey responses from
●
●
●
●
●
●
●
●
●
●
●
●
●
●●
●
●
−100
−50
0
50
100
Less than
once a
month
Once a
month
A few
times a
month
About once
a week
A few
times a
week
Every Day
Frequency
Value
Figure 2: A comparison of use frequency and value seen.
Respondents who see more value also seem to use Facebook
more often.
●
●
●
●
●
●
●
●●
●
●
●
●
●
●
−100
−50
0
50
100
Have a Facebook
account
Deactivated Facebook
account
Never had a Facebook
account
Account Status
Value Seen
Figure 3: Comparison between net value perceived and ac-
count status. Those with no account tend to perceive less
net value in the use of Facebook, but not by a substantial
amount.
a large, strongly representative sample of the stu-
dent body. We compared the demographics of the
responses to those of the entire population of stu-
dents to identify how representative our sample was.
The largest difference we saw was that of male stu-
dents; the male student population of our university
was 75.3%, but was 64.9% of the sample responses.
All race demographic sizes we measured fell within
10% of those of the student population, with many
within 5% of expected. This all indicates the sample
is a strong representation of our University’s student
population.
6.1 Demographic Cross-sections
Across all race and sex sub-groups, percentages of
those who saw and didn’t see benefit in Facebook, and
those with or without an account, varied widely. For
every subgroup, the portion of respondents who prac-
ticed valid cost benefit analysis fell within ±4% of
the result of the whole sample. This did not hold for
subgroups based on academic major.
ICISSP 2021 - 7th International Conference on Information Systems Security and Privacy
530

A way to spread your ideas
A way to stay connected as you meet people
A way to summarize your character
An archival method
A way to learn about current events
A way to learn about local events
A way to message people
A way to seek help
A way to expose people
A way to find new people
A way to have fun
A way to keep track of events
A use of my time
A way for advertisers to learn about me
A way to build community
A way to connect with your past
A source of knowledge about family
A source of knowledge about friends
A source of objective knowledge
A source of self image
A place for personal data
A place to discuss differing opinions
A place to play games
A source for news
Figure 4: Survey respondents were asked to rate each of these aspects of Facebook on a scale of -5 (most costly, left side of
each histogram) to 5 (most beneficial, right side of each histogram). Here histograms can be seen for each aspect including a
mean response as a vertical dotted line. Participants were presented these “value” questions in random order.
Insight 1. There was no clear correlation between
perceived net value of Facebook and the student’s aca-
demic major. It’s important to note that our sample
was all math, science and engineering majors, so this
may not be very significant.
Insight 2. On average, female respondents reported
a higher perceived net value (11.4) than male respon-
dents (1.3) in a possible range of -120 to +120.
6.2 Insights About Perception
Because most of our survey gathered value judgments
on the different aspects of Facebook, we can combine
those results with intensity–of–use data to identify the
population’s general opinion of the platform. These
types of insights may potentially be used by Facebook
or other social media platforms to identify how favor-
ably their users perceive them.
Insight 3. Facebook is generally seen as beneficial.
The average net value measured was 4.35 and the me-
dian was 6, showing that Facebook is generally seen
as positive but with low confidence due to a standard
deviation of 33.32.
Insight 4. The least frequent users are in general
what we call “reluctant users”. These are those who
see a net negative value to using Facebook and yet
still use it. Most who use the platform less than once a
week are in this category (see Figure 2, leftmost box).
Understanding How People Weigh the Costs and Benefits of using Facebook
531

Insight 5. Respondents who had deactivated their
Facebook account reported the lowest average net
value seen in Facebook. This can be seen in Figure 3.
Insight 6. People see the most valuable part of
Facebook to be messaging (average 2.59 and median
3 with range -5 to 5). The next most valuable aspect
was “A way to stay connected as you meet people”
with average 2.34 and median 3. Results for each as-
pect can be found in Figure 4.
Insight 7. The aspect of Facebook with the most
negative perceived value was “A way for advertisers
to learn about me” with average -2.32 and median -3.
This suggests people generally do not like that their
data is being used for targeted ads.
6.3 Limitations and Future Work
The survey we developed was not rigorously tested
for reliability and these results could be improved by
measuring the reliability of the responses. One way
this could be accomplished is by executing another
experiment with a slightly adjusted survey: we would
add a second question for all existing value questions
that is similar to the original, but differently worded.
A result showing the originally-asked questions an-
swered in the same way as the rephrased ones would
indicate reliability in the original data set. We could
also administer the same survey twice to a subset of
the respondents with a substantial delay between re-
quests to measure changes over time. Less change
indicates stable responses.
Our survey, while a large sample (n=450), is only
representative of our school’s student body. This does
not map to the demographic composition of Internet
users as a whole, and to measure how an average per-
son acts, we would need to expand the survey to a
representative sample of the general population.
We would also like to know if the survey respon-
dents knew they often acted contrary to their value
judgment: using Facebook even when they claim it
is a negative impact on their lives. By sharing these
results with the survey respondents and following up
after some time, we may be able to see if educating
individuals about their proficiency using their educa-
tion is beneficial.
If the respondents do indeed understand they seem
to behave irrationally, it would be beneficial to learn
what is motivating the reluctant users to exist; perhaps
there are externalities (such as using Facebook as an
identity provider for other websites) that coerce these
users into keeping their Facebook account alive.
Finally, Facebook is not the only social media
platform. It is possible that individuals rely differ-
ently on their value judgments when using other plat-
forms. A similar study could be done with other social
media platforms such as Instagram or Twitter to reveal
how the aspects of each platform are perceived by its
users. This would also allow a deeper understanding
of social media use in general instead of simply one
platform.
7 CONCLUSIONS
Through a survey administered to our university’s stu-
dent body, we were able to answer a few questions
about whether people practice cost–benefit analysis
when choosing how to use a social networking plat-
form. While our results do not show strongly “Yes” or
“No”, we did identify that people who perceive more
benefit in the use of a social networking platform tend
to use it more frequently.
It’s important to note, however, that some people
are “reluctant users”: while they perceive a negative
value to using a social network, they still engage. This
suggests that educating users about the risks and ben-
efits to use of a system may not be sufficient to em-
power them to act on their preferences.
ACKNOWLEDGEMENTS
The authors would like to thank Jordan Trachtenberg,
Diane Evans, and Paul Christensen for their help with
survey design, development, deployment, and relia-
bility measures. Thanks also go to Dan Morris, who
was instrumental in helping navigate the institutional
review board process.
REFERENCES
N. S. Good, J. Grossklags, D. K. Mulligan, and J. A. Kon-
stan, “Noticing notice,” Proceedings of the SIGCHI
conference on Human factors in computing systems -
CHI ’07. 2007. DOI 10.1145/1240624.1240720
H. Harkous, K. Fawaz, K. G. Shin, and K. Aberer. 2016.
“PriBots: Conversational Privacy with Chatbots.”
In Proceedings of the 12th Symposium on Usable
Privacy and Security (SOUPS 2016), Denver, CO.
USENIX Association, USA.
H. Harkous, K. Fawaz, R. Lebret, F. Schaub, K. G. Shin, and
K. Aberer. 2018. “Polisis: automated analysis and pre-
sentation of privacy policies using deep learning.” In
ICISSP 2021 - 7th International Conference on Information Systems Security and Privacy
532

Proceedings of the 27th USENIX Conference on Se-
curity Symposium (SEC’18). USENIX Association,
USA, 531–548.
L. Holtz, K. Nocun, and M. Hansen. “Towards Displaying
Privacy Information with Icons.” In Privacy and Iden-
tity Management for Life (Berlin, Heidelberg, Ger-
many, 2011). Vol 352 of IFIP Advances in Information
and Communication Technology, Springer, pp 338-
348. DOI 10.1007/978-3-642-20769-3 27.
M. Kay and M. Terry, “Textured agreements,” Pro-
ceedings of the Sixth Symposium on Usable Pri-
vacy and Security - SOUPS ’10. 2010. DOI
10.1145/1837110.1837127
P. G. Kelley, J. Bresee, L. F. Cranor, and R. W. Reeder, “A
’nutrition label’ for privacy,” of the 5th Symposium on
Usable Privacy and Security - SOUPS ’09. 2009. DOI
10.1145/1572532.1572538
J. T. Kunze, “Regulating Virtual Realms Optimally: The
Model End User License Agreement,” Northwestern
Journal of Technology and Intellectual Property, vol.
7, no. 1, Fall 2008.
N. Lavesson, P. Davidsson, M. Boldt, and A. Ja-
cobsson, “Spyware Prevention by Classifying End
User License Agreements,” New Challenges in Ap-
plied Intelligence Technologies. pp. 373–382. DOI
10.1007/978-3-540-79355-7 36
V. Mayer-Schonberger, Delete: The Virtue of Forgetting in
the Digital Age. Princeton University Press, 2009.
A. M. McDonald, R. W. Reeder, P. G. Kelley, and L. F.
Cranor, “Comparative Study of Online Privacy Poli-
cies and Formats,” Privacy Enhancing Technologies.
pp. 37-55, 2009. DOI 10.1007/978-3-642-03168-7 3.
Mozilla. “Privacy Icons”, published online
June 28, 2011. Accessed March 1, 2020.
https://wiki.mozilla.org/Privacy Icons
S. Staszak, “Privacy Protection Online: Measuring the Gap
of User Understanding.” Senior Thesis. May 2016.
Rose-Hulman Institute of Technology.
C. Utz, M. Degeling, S. Fahl, F. Schaub, and T. Holz. 2019.
“(Un)informed Consent: Studying GDPR Consent
Notices in the Field.” In Proceedings of the 2019 ACM
SIGSAC Conference on Computer and Communica-
tions Security (CCS ’19). Association for Comput-
ing Machinery, New York, NY, USA, 973–990. DOI
10.1145/3319535.3354212
T. Govani and H. Pashley. “Student awareness of the privacy
implications when using Facebook.” Proceedings of
The IEEE - PIEEE. 2007.
R. Dey, Z. Jelveh and K. Ross, “Facebook users have be-
come much more private: A large-scale study,” 2012
IEEE International Conference on Pervasive Comput-
ing and Communications Workshops, Lugano, 2012,
pp. 346-352, DOI 10.1109/PerComW.2012.6197508.
B. Debatin, J. P. Lovejoy, A. Horn, M.A., Brittany N.
Hughes, “Facebook and Online Privacy: Attitudes,
Behaviors, and Unintended Consequences,” Jour-
nal of Computer-Mediated Communication, Volume
15, Issue 1, 1 October 2009, Pages 83–108, DOI
10.1111/j.1083-6101.2009.01494.x
A. Vishwanath, W. Xu, and Z. Ngoh, “How people pro-
tect their privacy on Facebook: A cost-benefit view,”
Journal ofthe Association for Information Science and
Technology. 2018. 58. DOI 10.1002/asi.23894
H. R. Lipford, A.Besmer, and J. Watson. “Understanding
Privacy Settings in Facebook with an Audience View.”
UPSEC, 2008, 8, 1-8.
Y. Liu, K. P. Gummadi, B. Krishnamurthy, and A. Mis-
love. “Analyzing facebook privacy settings: user ex-
pectations vs. reality,” In Proceedings of the 2011
ACM SIGCOMM conference on Internet measure-
ment conference (IMC ’11). 2011. 61–70. DOI
10.1145/2068816.2068823
Understanding How People Weigh the Costs and Benefits of using Facebook
533
