
Noise-resilient Automatic Interpretation of Holter ECG Recordings
Egorov Konstantin
1
, Sokolova Elena
1
, Avetisian Manvel
1
and Tuzhilin Alexander
2
1
Sberbank AI Lab, Moscow, Russia
2
New York University, New York City, U.S.A.
Keywords:
ECG, Holter, Neural Networks, Segmentation, Classification.
Abstract:
Holter monitoring, a long-term ECG recording (24-hours and more), contains a large amount of valuable
diagnostic information about the patient. Its interpretation becomes a difficult and time-consuming task for
the doctor who analyzes them because every heartbeat needs to be classified, thus requiring highly accurate
methods for automatic interpretation. In this paper, we present a three-stage process for analysing Holter
recordings with robustness to noisy signal. First stage is a segmentation neural network (NN) with encoder-
decoder architecture which detects positions of heartbeats. Second stage is a classification NN which will
classify heartbeats as wide or narrow. Third stage in gradient boosting decision trees (GBDT) on top of NN
features that incorporates patient-wise features and further increases performance of our approach. As a part
of this work we acquired 5095 Holter recordings of patients annotated by an experienced cardiologist. A
committee of three cardiologists served as a ground truth annotators for the 291 examples in the test set. We
show that the proposed method outperforms the selected baselines, including two commercial-grade software
packages and some methods previously published in the literature.
1 INTRODUCTION
Cardiovascular diseases remain the leading cause of
death throughout the world, according to the World
Health Organization (WHO) (WHO, 2018). Timely
screening and diagnosis of these diseases can signif-
icantly reduce mortality caused by them. An electro-
cardiogram (ECG) is one of the most affordable and
common tools for recording heart rhythm that facil-
itates the diagnosis of wide range of heart patholo-
gies. Given the fact that heart rhythm abnormalities
and other malfunctions may occur irregularly, mon-
itoring for an extended period of time is necessary
to detect these events. Long-term ECG recordings
(24-hours and more) contain a large amount of valu-
able diagnostic information about the patient, how-
ever their interpretation becomes a difficult and time-
consuming task for the cardiologist who analyzes
them. Holter ECG recordings contain hundreds of
thousands of heartbeats and, ideally, position of each
of them should be determined accurately and each
heartbeat should be classified individually.
The task of interpretation of long-term Holter
recordings is challenging (Schl
¨
apfer and Wellens,
2017). In one study, computerized interpretation of
ECG signals identified non-sinus rhythms with accu-
racy of only 53.5% (Shah and Rubin, 2007). Another
study (Lindow et al., 2019) found that among ECGs
with a computer-based diagnosis of atrial fibrillation
or atrial flutter, the diagnosis was incorrect in almost
10%. In almost half of the cases, the misdiagnosis
was not corrected by the over-reading physician. The
clinical impact of the computer-based ECG misinter-
pretation was also evaluated in (Bond et al., 2018)
where it was demonstrated that incorrect automated
diagnosis (AD) significantly affects the reader’s inter-
pretation accuracy. In particular, diagnosis accuracies
achieved by cardiology fellows dropped by 43.20%
when an incorrect AD was presented to them.
Duration, amplitude and morphology of QRS
complex (RR interval, width of QRS complex and
slopes of various segments) are important criteria for
detection of abnormal heartbeats (Osowski and Linh,
2001). Therefore, the purpose of our work is to create
an automatic artificial intelligence algorithm for mak-
ing the key ECG-measurements more precise on the
long-term noisy recordings, such as detection of the
heart beat positions (R-peak) and morphology of QRS
complex (wide or narrow). In this paper, we make the
following contributions. First, we introduce a signal-
wise Convolutional Neural Network (CNN) architec-
ture that operates on the channel level. Second, we
propose a novel method of how to add patient-specific
208
Konstantin, E., Elena, S., Manvel, A. and Alexander, T.
Noise-resilient Automatic Interpretation of Holter ECG Recordings.
DOI: 10.5220/0010258302080214
In Proceedings of the 14th International Joint Conference on Biomedical Engineering Systems and Technologies (BIOSTEC 2021) - Volume 4: BIOSIGNALS, pages 208-214
ISBN: 978-989-758-490-9
Copyright
c
2021 by SCITEPRESS – Science and Technology Publications, Lda. All rights reserved

information to our model by stacking the ECG seg-
mentation and the patient-wise classification models
(NN+GBDT).
Third, we show that the proposed method
outperforms the selected baselines, including two
commercial-grade software packages and some meth-
ods previously published in the literature. Finally,
we show that our method approaches the performance
level of experienced cardiologists, which we demon-
strate in an experiment involving 291 annotated ECG
recordings and 3 highly skilled cardiologists.
2 RELATED WORK
Historically, the automated ECG signal interpretation
is implemented by expertly-created feature extraction
algorithms (onset and offset of the different waves,
measurements of various intervals, amplitude param-
eters etc.), while the classification is performed by
decision rules, which are also created and tuned by
experts. In order to improve the accuracy of such
methods, a number of machine learning algorithms
were applied to the problem. These methods allowed
use of more informative features, e.g. time to fre-
quency conversion methods (e.g. wavelet-transform)
in order to extract features from variable-length wave-
forms (Essam et al., 2017). However, the problem of
automated interpretation of ECG signals still remains
under-explored, despite all these efforts (Kaplan et al.,
2018)(Estes, 2013). Furthermore, with the advent of
deep-learning based methods, new expectations have
been developed recently that cardiologist-level inter-
pretation of ECGs can be achieved by using modern
deep neural networks (Hong et al., 2019).
One such paper (Shashikumar et al., 2018) de-
scribes how a multi-stage model has been applied to
the atrial fibrillation detection problem. In particular,
the signal was split into 10-minute segments, and the
noise reduction and frequency analysis using wavelet
transform was performed on these signals. Further-
more, features were extracted from the spectrograms
using a CNN, while a BRNN and attention layers
managed to capture temporal patterns in the extracted
features, resulting in the final classification layer cal-
culating probabilities of predicting atrial fibrillation.
Another work in applying deep learning to the
ECG interpretation task is presented in (Rajpurkar
et al., 2017), where a 34-layer CNN was able to ex-
ceed performance of a cardiologist in detecting a wide
range of heart arrhythmias by leveraging a large an-
notated dataset and a very deep CNN. Our work dif-
fers from (Rajpurkar et al., 2017) as follows. First,
the training and the test sets in the paper were con-
structed in a way to make it more balanced, i.e. taking
only approximately 2 30-seconds windows for each
patient, thus possibly making false positive metric in-
accurate. Second, the paper works only for single-
lead ECG records, while our work focuses on extract-
ing features from multi-channel ECG recordings. The
problem of noise in the ECG recordings is studied in
(Everss-Villalba et al., 2017). First, the authors de-
fined 5 classes of noise, ordered by the clinical im-
pact of the noise on the parameters to be measured
in the ECG. Second, various measures of noise level
have been proposed, such as baseline wander, power-
line interference, and standard deviation noise (which
was proposed in the paper). Third, a noise map is
built, which characterizes temporal distribution of the
noise. The paper demonstrates that noise level can be
prohibitively high for automated or human interpreta-
tion of ECG signals.
Based on this literature review, we conclude that
significant progress has been made in addressing the
problem of automated ECG analysis over the last sev-
eral years. However, the problem is far from being
solved due to the complexities associated with having
highly unbalanced datasets and prevalence of signifi-
cant levels of noise in the ECG data.
3 DATA
3.1 Dataset
Data used in the present study was collected from dif-
ferent clinics of one of East European countries. We
worked with a large dataset of ECG recordings con-
sisting of 5,095 ambulatory 2–lead ECG recordings
of 24–hour duration (Table 1 presents the statistics
pertaining to this dataset). The ECG data is sampled
at a frequency of 250 Hz. All the personally iden-
tifiable information has been deleted by the clinics.
Each recording was annotated by experienced cardiol-
ogists using commercial ECG analysis software. The
annotation contained positions of individual QRS-
compleses, as well as class labels, such as wide or
narrow QRS-complexes, arrythmia events (extrasis-
toles and pauses) and different types of pauses. Fur-
thermore, these ECG recordings were contaminated
by noisy and unreadable segments or one of the elec-
trodes was disconnected for some time and then re-
connected again. Thus, our task is building a model
which is resilient to such levels of noise.
We split the dataset into the training, validation
and test subsets in the proportion of 74%, 20% and
6% respectively (having 3804, 1000 and 291 records
in each subset). The test set was additionally anno-
Noise-resilient Automatic Interpretation of Holter ECG Recordings
209
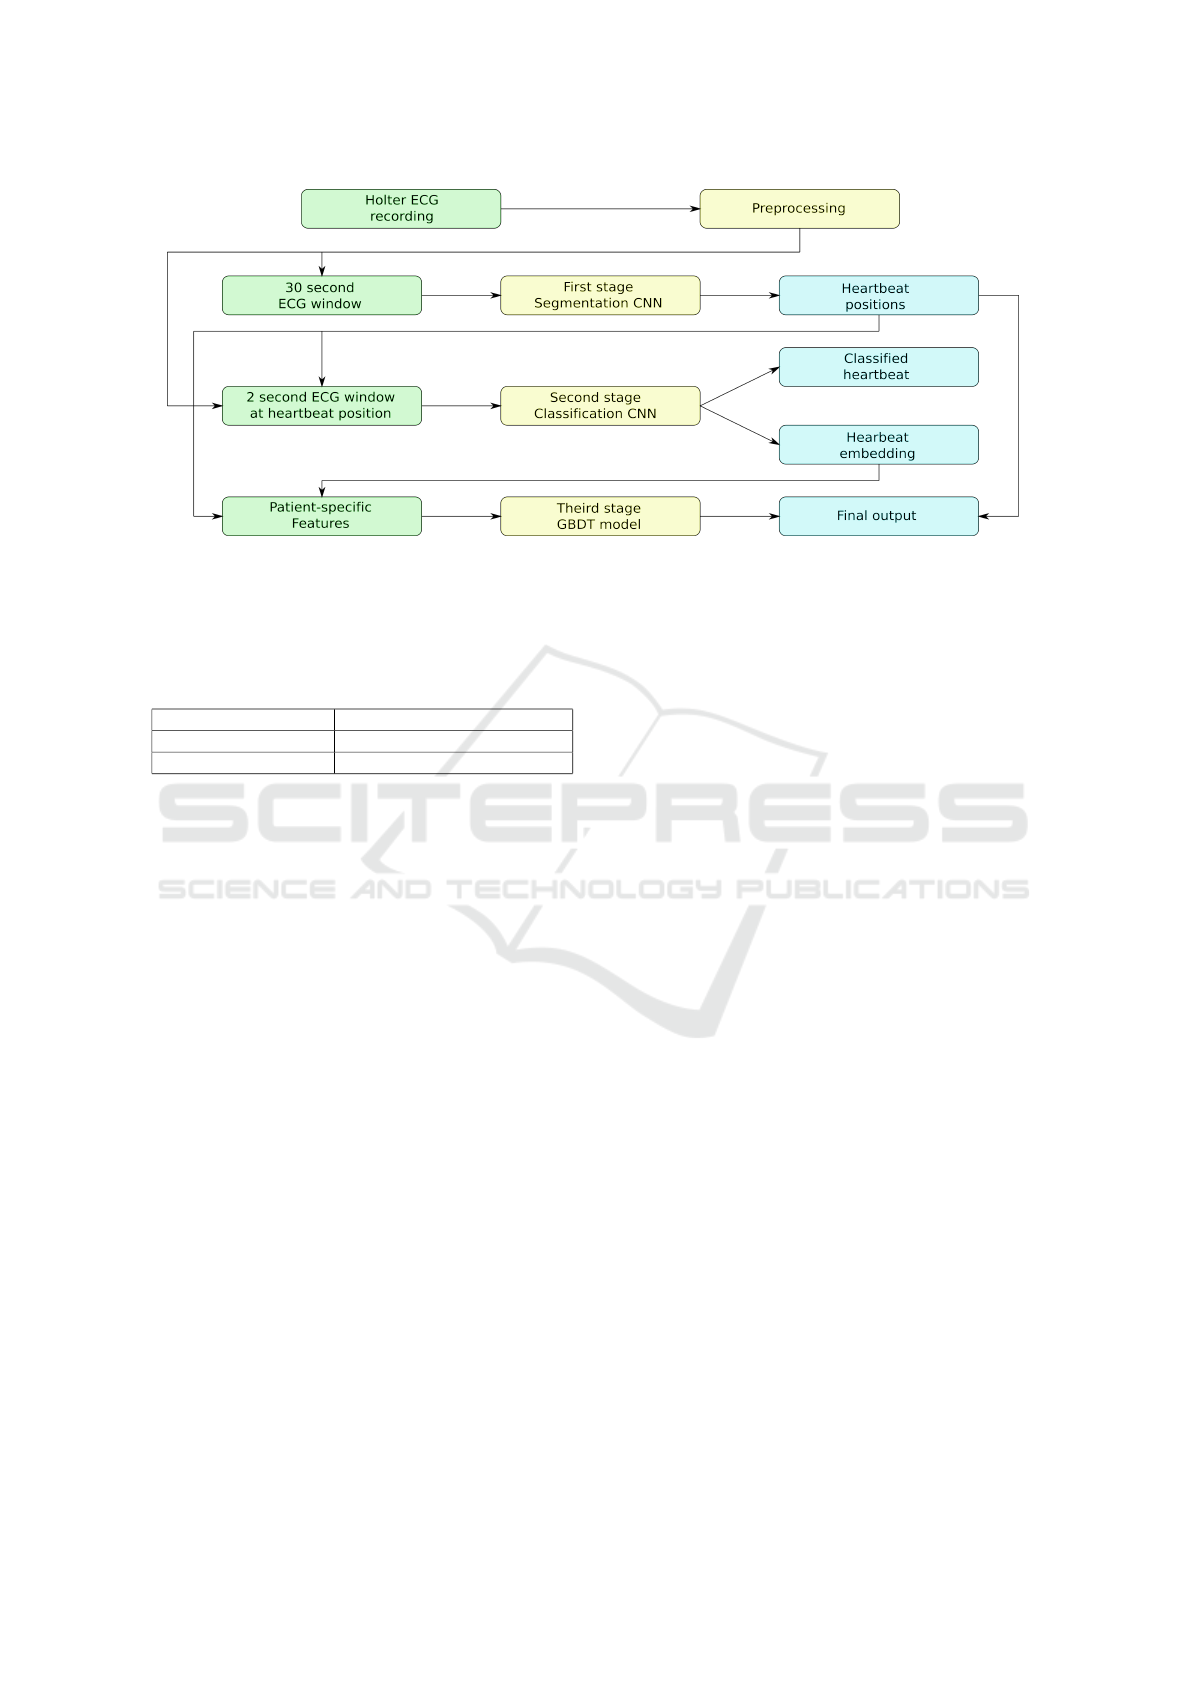
Figure 1: The whole algorithm of our approach.
tated by a committee of three independent certified
and practicing cardiologists, and the ”ground truth”
was determined by the voting of those experts.
Table 1: Dataset Statistics.
Number of records 5 095
Total length 5232 days 21 hours 6 minutes
Total wide QRS count 6 515 633 (1.2 %)
3.2 Preprocessing
In order to reduce noise in the signal, we applied the
following preprocessing steps to our data. First, we
fill signal from disconnected electrodes with linear in-
terpolation between the last non-zero sample and the
first non-zero sample after disconnection. The goal of
this step is to remove extreme high-frequency spikes
in the points where the electrodes are disconnected
and reconnected.
Second, we removed the wandering trend and
made isoline close to zero by subtracting two passes
of the mean filter with a 100-samples window. Third,
we applied a low-pass filter with the cutoff fre-
quency of 40Hz. The last prepossessing step is down-
sampling with the factor of 2. During the training
step, we also normalized the amplitude and subtracted
the channel-wise median from each training window
to ensure that isoline is as close to zero as possible.
4 Method
4.1 Overview
Our approach consists of three main stages of analysis
(see Fig. 1). First stage is a CNN segmentation model
with the encoder-decoder architecture with a bottle-
neck layer. There are two separate CNN encoders
for each channel with identical structure, but differ-
ent weights. Before bottleneck resulting feature maps
of the encoders are averaged to ensure that both en-
coders generate similar features from different chan-
nels and are supplementary to each other (see Fig. 2).
This decision was based on the fact, that major parts
of some recordings have periods (sometimes up to
100% of time) when one of the electrodes is either
detached or has a very low signal quality index (SQI)
(Li et al., 2008). While in (Shashikumar et al., 2018)
authors facing similar challenge are feeding the neural
network only through the channels with highest SQI,
we found that a more beneficial approach is to use all
channels at all the times, but to let the neural network
learn to distinguish the noisy or absent signals on its
own. Our goal was to create a model that is work-
ing on any number of electrodes, and each attached
electrode enhances the overall performance, while de-
tachment of the electrode does not result in perfor-
mance deterioration. The second stage comprises a
CNN with the structure similar to the first stage, but
with the classification head instead of segmentation.
Its input consist of the 2-second windows of the sig-
nal centered by position detected in the first stage.
Third stage comprises a gradient boosting deci-
sion tree classifier. We use it to enhance the perfor-
mance of the heartbeat classification step by incorpo-
rating global patient features into the model. While
the first-stage CNN processes only 30 seconds of the
signal and the second-stage CNN processing 2 sec-
onds of signal, we found that it is important to cap-
ture the individual characteristics of a given record-
ing and a patient and use them in final classification.
It turns out that this step significantly improves the
overall classification process.
BIOSIGNALS 2021 - 14th International Conference on Bio-inspired Systems and Signal Processing
210
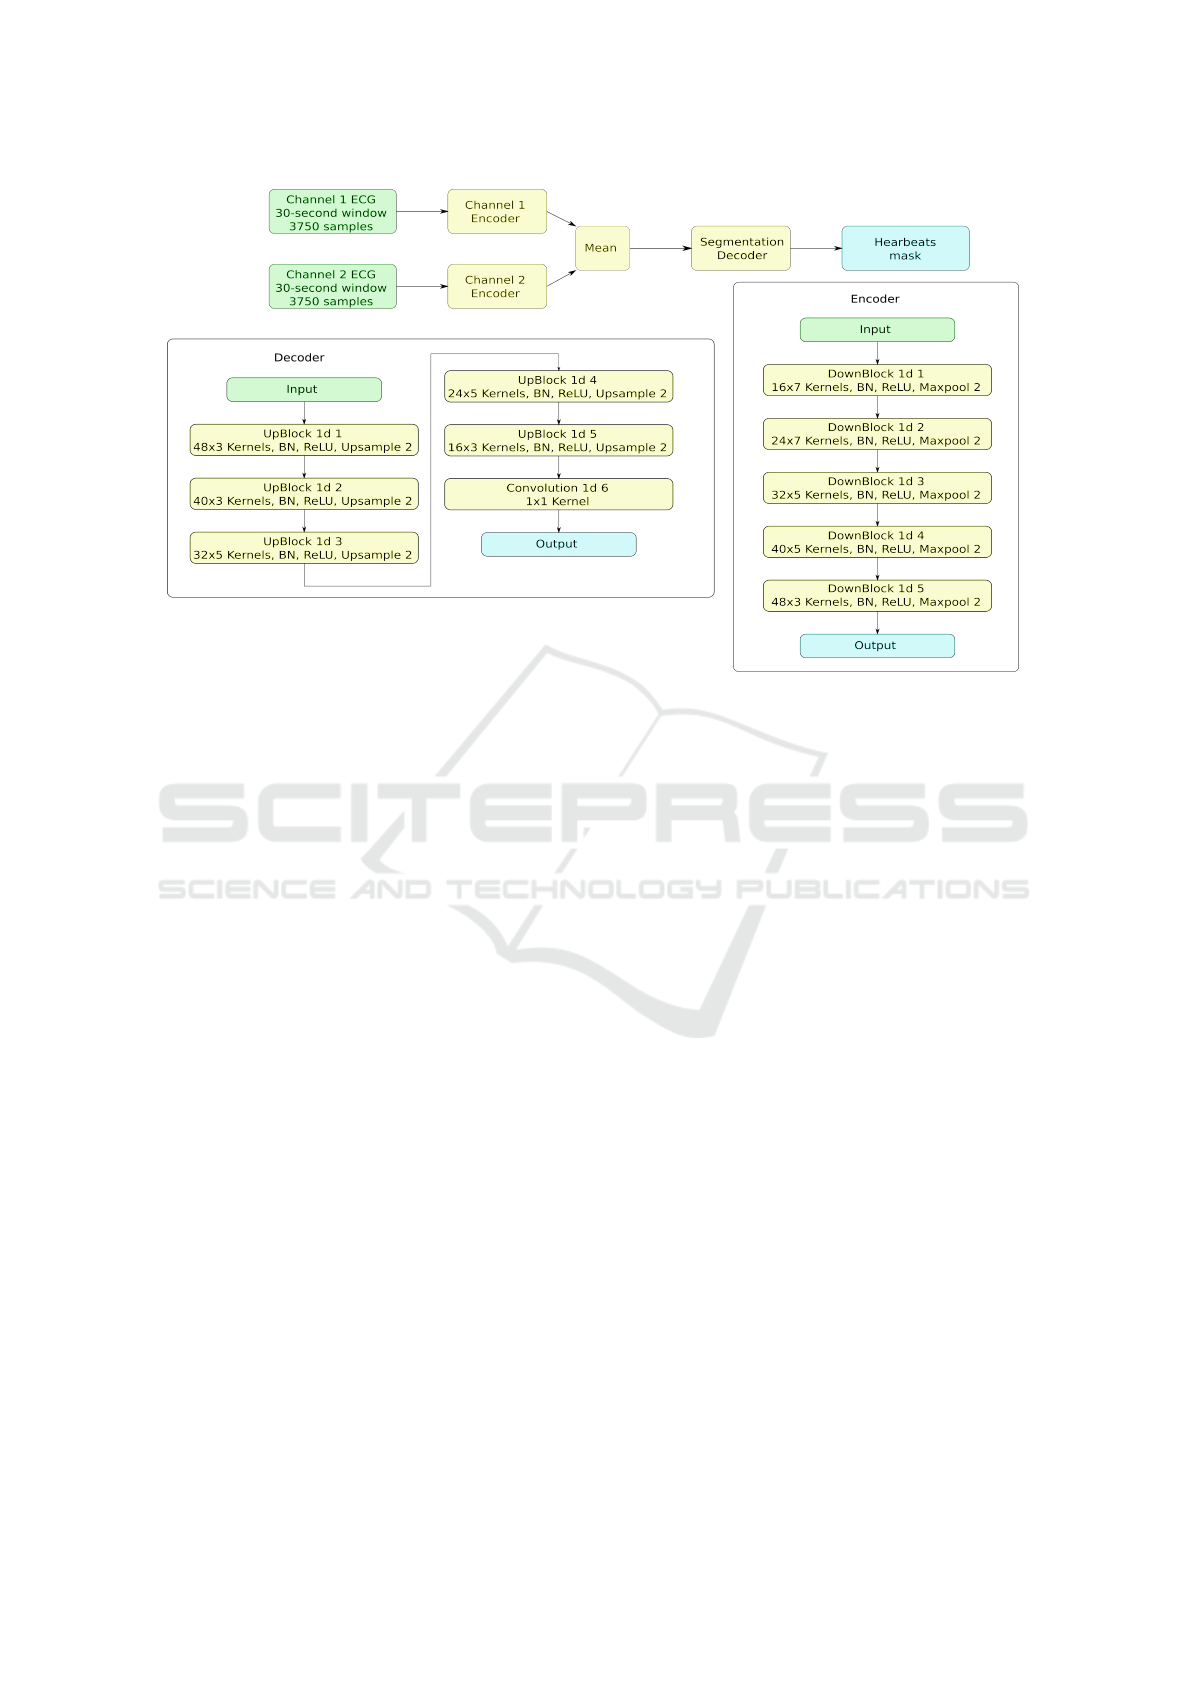
Figure 2: Neural network of the first stage.
4.2 Training
4.2.1 Augmentation
Augmentation is proven to be an efficient technique to
improve the training process and increase the overall
model performance. Our main augmentation is em-
pirically chosen ”channel-wise dropout”: zeroing out
one of the channels entirely with probability of 0.9
and adding strong Gaussian noise instead, thus forc-
ing the model to learn using only the ”worthy” chan-
nels.
The rest of the augmentations we used are com-
mon in the ECG and other signal processing domains
(Salamon and Bello, 2017): adding Gaussian noise to
both channels, resampling by the factor of (0.7 - 1.3)
and channel-wise multiplication by the factor of (0.5
- 1.5).
4.2.2 Sampling and Losses
Due to the extreme imbalance of the wide/narrow
heartbeats in the dataset (almost 1:100), we applied
the positive example upsampling technique during the
training process. It also worth noting that various
losses perform differently with different class bal-
ances. Therefore, we tested three types of losses:
Binary Cross Entropy (BCE) Loss, Focal Loss, and
Dice loss in both the segmentation and the classifica-
tion stages. In our experiments, the best results on the
validation set were achieved with the positive class ra-
tio 3:20 in both stages, while the Dice Loss performed
the best in the segmentation stage and the BCE Loss
in the classification stage.
4.2.3 Neural Networks Training
We trained both neural networks for the 100,000 steps
with the batch size of 64. We used Adam optimizer
with B1 = 0.9 and B2 = 0.999, learning rate = 0.001
with exponential decay by the factor 0.97 every 1000
steps. Each batch we formed by sampling wide heart-
beats with probability 0.15 and narrow with probabil-
ity 0.85.
4.2.4 GBTD Training
The third stage classification was made by GBDT us-
ing the LightGBM library (Ke et al., 2017). It was
trained on the validation dataset, that was further split
into 700 patients for training and 300 patients for val-
idation in the current stage. Training was stopped
after 461 iterations based on the validation set met-
rics. The feature set for the current stage was gener-
ated using the features obtained in the previous steps.
The most important were the vectors describing each
heartbeat taken from the classification network right
after the channel merging step and raw outputs (log-
its) from the network. From these features we gen-
erated patient-wise aggregated features, such as the
mean, the median and the standard deviation of each
Noise-resilient Automatic Interpretation of Holter ECG Recordings
211
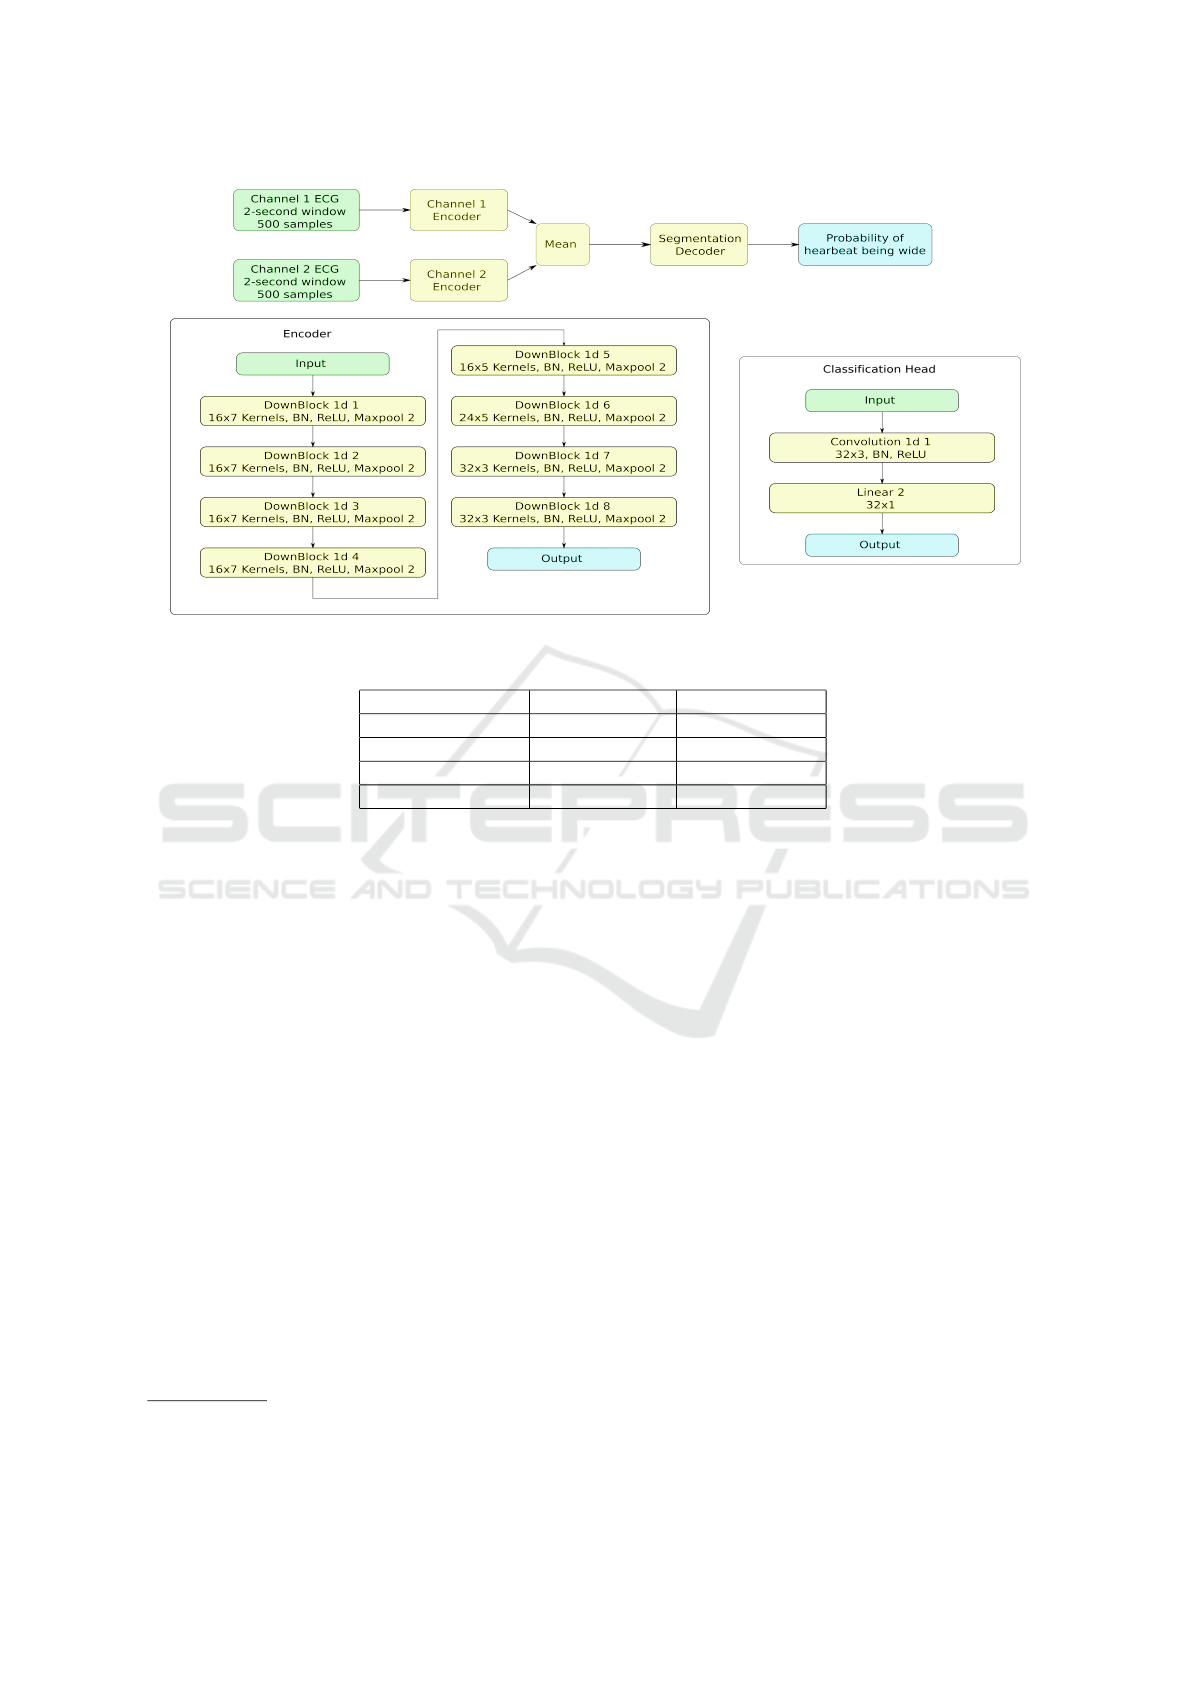
Figure 3: Neural network of the second stage.
Table 2: Comparison between Different Methods for the Detection R-peaks task.
Method Sensitivity (Se) Specificity (+P)
Baseline Vendor 1 0.989 0.975
Baseline Vendor 2 0.968 0.972
Neural Network 0.993 0.990
Cardiologist 0.991 0.992
value. Further, we added features based on the heart-
beat detection from the first stage. These are mean,
median rate, local heartbeat rate based on nearest 100
and 10 beats and their relationship with the current
heartbeat.
5 RESULTS
The results of the conducted experiments are shown
in the Table 2. As baselines for comparing our model,
we chose two widely used commercial-grade soft-
ware packages built by two different vendors
1
. Fur-
thermore, we compare our model with the annota-
tions made by experienced cardiologists over-reading
annotations acquired with the software package pro-
duced by Vendor 2. We measure performance of our
models using Sensitivity (Se) and Specificity (+P)
metrics. True positive for the detection task was
counted if model detects a heartbeat within 150 ms
of the true one. The comparison is made on the
test dataset consisting of 291 recordings annotated
by a committee of three cardiologists. This dataset
1
Due to the confidentiality agreements, we cannot reveal
the names of these vendors
was annotated independently from the original train-
ing dataset, which also enables us to evaluate perfor-
mance of a single cardiologist.
As Table 2 demonstrates, our model outperforms
the two selected baselines in the task of detecting po-
sitions of heartbeats, as well as classifying the heart-
beats into narrow and wide. Moreover, the proposed
model achieved the accuracy level comparable to the
experienced cardiologists on these tasks, as shown in
Table 2.
Furthermore, we tested our method on the MIT
BIH Arrhythmia Database and compared the results
of the different approaches described in the literature
with the similar metrics of our model (see Table 3)
(Rodriguez et al., 2014). The MIT-BIH Database is
a test set for evaluation of arrhythmia detection per-
formance as well as for basic research into cardiac
dynamics that has been used about 500 times world-
wide since 1980 (Moody and Mark, 2001). Due to
the fact that this dataset is not suitable for the classi-
fication task, we evaluated our model only in the con-
text of the detection task. As demonstrated in Table
3, our approach to the challenge of heartbeat detection
showed stronger performance results than the selected
baselines.
BIOSIGNALS 2021 - 14th International Conference on Bio-inspired Systems and Signal Processing
212

Table 3: Comparison Between Different Methods for the Classification QRS task.
Method Sensitivity (Se) Specificity (+P)
Baseline Vendor 1 0.687 0.961
Baseline Vendor 2 0.318 0.955
Neural Network 0.873 0.997
NN + GBDT 0.917 0.999
Cardiologist 0.872 0.999
Table 4: QRS detection performance comparison on the MIT-BIH arrhythmia database.
Work Recall (%) Precision (%)
Pan and Tompkins (1985) 90.95 99.56
Elgendi et al. (2009) 87.90 97.60
Chouakri et al. (2011) 98.68 97.24
Rodriguez-Jorge et al. (2014) 96.28 99.71
NN + GBDT (our work) 98.11 99.91
6 CONCLUSIONS
In this paper we present a novel heartbeat detection
and heartbeat classification (narrow or wide) method
for the two-channel long-term ECGs. We propose a
channel-wise CNN architecture and combine it with
the GBDT model that can employ patient-wise fea-
tures. Furthermore, we demonstrate on the set of 291
ambulatory 2-lead ECG 24-hour recordings that our
method significantly outperforms two commercially
available software packages widely used by the car-
diologists for these tasks in the country, approaching
the quality level of experienced radiologists.
As a future work, we intend to conduct prospec-
tive clinical trials for confirmation of clinical signifi-
cance of this model, as well as enhancing our model
for the detection and interpretation of more complex
components of the heartbeat.
REFERENCES
Bond, R., Novotny, T., Andrsova, T., Koc, L., Sisakova, M.,
Finlay, D., and Malik, M. (2018). Automation bias
in medicine: The influence of automated diagnoses
on interpreter accuracy and uncertainty when reading
electrocardiograms. Journal of Electrocardiology.
Essam, H., Kilany, M., and A.Hassanien (2017). ECG sig-
nals classification: a review. International Journal of
Medical Engineering and Informatics.
Estes, N. (2013). Computerized interpretation of ECGs:
supplement not a substitute. Circulation. Arrhythmia
and Electrophysiology.
Everss-Villalba, E., Melgarejo-Meseguer, F., Blanco-
Velasco, M., Gimeno-Blanes, F., Sala-Pla, S., Rojo-
´
Alvarez, J., and Garc
´
ıa-Alberola, A. (2017). Noise
Maps for Quantitative and Clinical Severity To-
wards Long-Term ECG Monitoring. Sensors (Basel,
Switzerland).
Hong, S., Zhou, Y., Shang, J., Xiao, C., and Sun, J.
(2019). Opportunities and Challenges in Deep Learn-
ing Methods on Electrocardiogram Data: A System-
atic Review. arXiv:2001.01550.
Kaplan, B., Uysal, A., Gunal, E. S., Ergin, S., Gunal, S., and
Gulmezoglu, M. (2018). A survey on ECG analysis.
Biomedical Signal Processing and Control.
Ke, G., Meng, Q., Finley, T., Wng, T., Chen, W., Ma, W.,
Ye, Q., and Liu, T. (2017). LightGBM: A Highly Ef-
ficient Gradient Boosting Decision Tree. Advances in
Neural Information Processing Systems.
Li, Q., Mark, R., and Clifford, G. (2008). Robust heart rate
estimation from multiple asynchronous noisy sources
using signal quality indices and a Kalman filter.
SPhysiol.
Lindow, T., Kron, J., Thulesius, H., Ljungstr
¨
om, E., and
Pahlm, O. (2019). Erroneous computer-based inter-
pretations of atrial fibrillation and atrial flutter in a
Swedish primary health care setting. Biomedical Sig-
nal Processing and Control.
Moody, G. and Mark, G. (2001). The impact of the MIT-BIH
Arrhythmia Database. IEEE Engineering in Medicine
and Biology Magazine.
Osowski, S. and Linh, T. (2001). ECG beat recognition
using fuzzy hybrid neural network. IEEE Transactions
on Biomedical Engineering.
Rajpurkar, P., Hannun, A., Haghpanahi, M., Bourn, C.,
and Ng, A. (2017). Cardiologist-Level Arrhyth-
mia Detection with Convolutional Neural Networks.
arXiv:1707.01836.
Rodriguez, H., Mexicano, R., Bila, A., Ponce, J., Cervantes,
R., and Salvador (2014). Feature Extraction of Elec-
trocardiogram Signals by Applying Adaptive Thresh-
old and Principal Component Analysis. Journal of
Applied Research and Technology.
Salamon, J. and Bello, J. (2017). Deep Convolutional Neu-
Noise-resilient Automatic Interpretation of Holter ECG Recordings
213

ral Networks and Data Augmentation for Environmen-
tal Sound Classification. IEEE Signal Processing Let-
ters.
Schl
¨
apfer, J. and Wellens, H. (2017). Computer-Interpreted
Electrocardiograms: Benefits and Limitations. Jour-
nal of the American College of Cardiology.
Shah, A. and Rubin, S. (2007). Errors in the computerized
electrocardiogram interpretation of cardiac rhythm.
Journal of Electrocardiology.
Shashikumar, S., Shah, A., Clifford, G., and Nemati,
S. (2018). Detection of Paroxysmal Atrial Fibril-
lation using Attention-based Bidirectional Recurrent
Neural Networks. KDD: Proceedings of the 24th
ACM SIGKDD International Conference on Knowl-
edge Discovery & Data Mining.
WHO (2018). Who statistics of cardiovascu-
lar disease(cvd). In [Online]. Available:
https://www.who.int/health-topics/cardiovascular-
diseases.
BIOSIGNALS 2021 - 14th International Conference on Bio-inspired Systems and Signal Processing
214
