
Evaluating the Meeting Solutions Used for Virtual Classes in Higher
Education during the COVID-19 Pandemic
Otto Parra
a
and Maria Fernanda Granda
b
Department of Computer Science, University of Cuenca, Av. 12 de Abril s/n, Cuenca, Ecuador
Keywords: Evaluation, Meeting Solutions, User Experience, Usability, Virtual Classroom, Covid-19 Pandemic.
Abstract: When the Ecuadorian government put the country into quarantine as a preventive measure against the Covid-
19 pandemic the country’s schools and colleges had been working normally up to March 2020. On March
13
th
, the University of Cuenca decided to suspend face-to-face classes and changed the system to virtual online
teaching. Although the teachers and students changed the teaching-learning method from face-to-face to
virtual, they were not prepared to continue their education in this new educational system, in which each
student’s family had different mandatory elements (e.g., an Internet connection, computer, meeting solution).
However, they continued the classes through meeting solutions to continue the school year through virtual
classes but without any criteria to select the most suitable meeting tool. This paper evaluates two of the most
commonly used meeting solutions for virtual university classes: Webex and Zoom. We used User Experience
Questionnaire and Microsoft Reaction Cards to evaluate these solutions. The results showed that Zoom was
significantly more attractive than Webex, although there was no significant difference between them in the
classic aspects of usability or user experience.
1 INTRODUCTION
The coronavirus COVID-19 pandemic has had a very
strong influence on the development of many areas of
society (UNESCO & IESALC, 2020), including
education (at all levels) (Crawford et al., 2020) and
business (McKibbin & Roshen, 2020). More than 1.5
billion students and young people all over the world
are affected by school and university closures due to
the COVID-19 emergency (Universities, 2020).
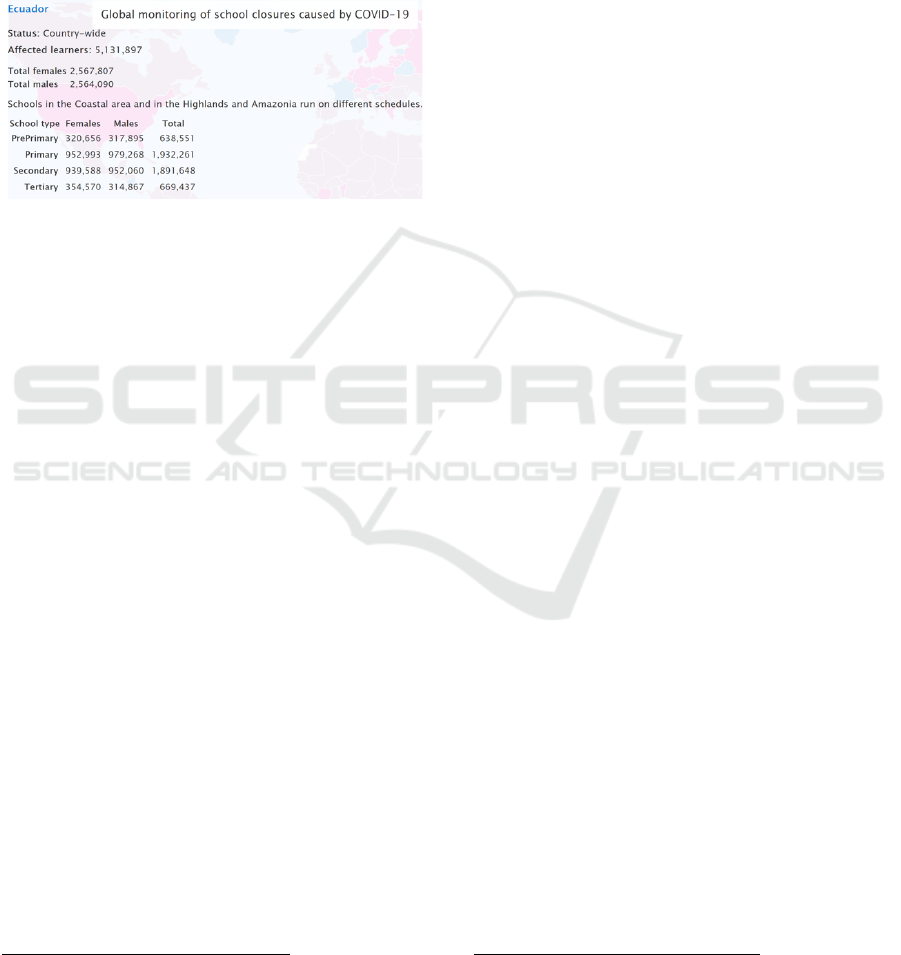
According to UNESCO (UNESCO & IESALC,
2020), Ecuador has 5.131.897 learners affected by
COVID-19 (see Figure 1). However, the schools in
the Ecuadorian coastal area, Highlands and Amazonia
run on different schedules.
Just before this pandemic and from September
2019 to July 2020, educational institutions in the
Highlands region had been working in the traditional
way, i.e., activities were carried out normally at
different levels, students and teachers met in
classrooms to learn and teach, respectively. However,
in March 2020 when the first COVID-19 cases were
detected in the country, the situation at all levels of
education in Ecuador changed. The country’s
a
https://orcid.org/0000-0003-3004-1025
b
https://orcid.org/0000-0002-5125-8234
educational authorities made the decision to
quarantine, which meant, among other things, closing
schools, colleges and universities to prevent the virus
from spreading further among the student population.
This decision changed the working environment for
both teachers and students, as they had to stay at
home.
This paper focuses on higher education with the
traditional method (face-to-face), including the
University of Cuenca. In this university, in the
Faculty of Engineering, before the quarantine, 52% of
the teachers used the institution's Moodle-based
virtual platform. This group of teachers had each of
their courses and all the material required to teach the
classes on the virtual platform, which the students
were used to using to participate in forums, chats,
quizzes, review class presentations, read book
extracts, and receive and deliver assignments,
although the classes were given face-to-face. It was
not necessary to use any tool to maintain
communications between teachers and students,
except the traditional tools such as email and
messaging systems (for example, WhatsApp).
190
Parra, O. and Granda, M.
Evaluating the Meeting Solutions Used for Virtual Classes in Higher Education during the COVID-19 Pandemic.
DOI: 10.5220/0010258201900197
In Proceedings of the 16th International Joint Conference on Computer Vision, Imaging and Computer Graphics Theory and Applications (VISIGRAPP 2021) - Volume 2: HUCAPP, pages
190-197
ISBN: 978-989-758-488-6
Copyright
c
2021 by SCITEPRESS – Science and Technology Publications, Lda. All rights reserved
In a situation where students are not allowed to go
to educational institutions, the alternative is to move
from traditional to online education. From a
technological point of view, the university authorities
had to consider some very important aspects when
deciding to change the scheme from face-to-face to
virtual: (1) the availability of an internet connection
in all the students and teachers’ homes, (2) the
availability of a computer for education, or (3) a
mobile device with an Internet connection.
Figure 1: Global monitoring of school closures ((UNESCO
& IESALC, 2020)).
In order to teach the students, teachers began to
use the meeting solutions (also called collaboration
platforms that support live-video communications)
available at the University of Cuenca, including
Zoom and Webex. Other tools that have also been
used are Google Meet, and BigBlueButton by
Moodle. Before the pandemic, both teachers and
students were unfamiliar with systems such as Zoom
and Webex to dictate/attend a class, as Skype,
Hangout or WhatsApp were typically used to
communicate with others.
In this context, we were interested in analysing
how well the meeting solutions supported users in
teaching-learning activities. We evaluated usability
and user experience (UX) when the students used
Zoom and/or Webex for their education. According
to ISO 9241-210 (ISO, 2010), UX is defined as
“user’s perceptions and responses that result from the
use and/or anticipated use of a system, product or
service”. ISO 9241-11 (Bevan & Carter, 2016)
defines usability as “the extent to which a system,
product or service can be used by specified users to
achieve specified goals with effectiveness, efficiency
and satisfaction in a specified context of use”.
The major contribution of this work is as follows:
We conducted usability and UX evaluations of two
meeting solutions used in some courses in the
Engineering Faculty in University of Cuenca
(Ecuador) in order to get to know the students’
experience when they use them for classes.
3
https://www.worldbank.org/en/topic/edutech/brief/how-
countries-are-using-edtech-to-support-remote-learning-
during-the-covid-19-pandemic
2 BACKGROUND
We use Zoom and Webex because these tools are
available in University of Cuenca for virtual classes.
Webex facilitates teaching, learning, and
collaborative administration anywhere and at any
time. Video conferencing is delivered with a
software-as-a-service (SaaS) model through the
Cisco Webex Cloud. This tool was announced by
Cisco as a free access tool for the Covid-19 pandemic,
Webex supports up to 100 users and includes a
security scheme.
Zoom is a multiplatform meeting solution with a
cloud platform for video and audio conferencing,
collaboration, chats and webinars and can be used
across computers (e.g., desktops, laptops), mobile
devices, and telephones. Its features like chatting,
screen sharing, annotating, whiteboard, polling,
breakout rooms, raising the hand, and managing
participants, lend themselves to creating engaging
virtual hybrid classrooms and collaborating on
projects. Users have the option to record sessions
(Reimers et al., 2020). The free edition permits
meetings of 40 min of duration. The University of
Cuenca has licenses for both Zoom and Webex which
made it easier for us to carry out this research work.
3 RELATED WORK
In this section, we review related works about the
evaluation of UX and usability of meeting solutions
used in the context of virtual education.
In a search of the related literature we found some
papers (Basilaia & Kvavadze, 2020), (Reimers et al.,
2020) and web sites
3
,
4
reporting on the situation of the
education during to COVID-19 and the need to decide
on a meeting solution, although only a few
videoconferencing problems were reported (e.g.,
(Levinsen et al., 2013), (Martin, 2005), (Ørngreen &
Mouritzen, 2013) and (Weitze et al., 2013)). (Khalid
& Hossan, 2017) described a case of summative and
empirical usability evaluation methods of a dedicated
Video Conference System in university classrooms.
However, this study did not analyze the Zoom and
Webex tools and excluded user experience.
(Correia et al., 2020) describe the evaluation of
Zoom, Skype, Microsoft Teams and WhatsApp in the
context of the COVID-19 pandemic. They conducted
an analytic evaluation focused on usability inspection
4
https://elearningindustry.com/virtual-classrooms-role-
during-covid-19-pandemic
Evaluating the Meeting Solutions Used for Virtual Classes in Higher Education during the COVID-19 Pandemic
191

using the Quality in Use Integrated Measurement
(QUIM) model proposed by (Seffah et al., 2006).
These authors do not include Webex in their work.
Additionally, (Singh & Soumya, 2020) describe an
updated comparison between Zoom, Microsoft
Teams, Google Meet, Webex Teams and
GoToMeetings, however, this work do not include
any evaluation about usability or UX. Finally, (Pal &
Vanijja, 2020) describe their work about evaluation
of usability of Microsoft Teams by means of TAM
(Davis, 1989). They do not include an evaluation of
Zoom and Webex.
As the existing literature lacks sufficient
methodological guidance for a usability evaluator to
conduct a study in the classroom of an educational
institution, our objective was to carry out a user-
centered exploratory study to evaluate usability and
UX. To the authors’ best knowledge, no papers have
been published on Zoom and Webex usability studies
or UX for teaching-learning activities in higher-
education.
4 TOOLS TO EVALUATE USER
EXPERIENCE
We used Microsoft Reaction Cards (MRC) (Tullis &
Stetson, 2004) and UEQ (Hinderks et al., 2020) to
evaluate the UX of 79 students of the Faculty of
Engineering of the University of Cuenca who used
Zoom and Webex for their virtual classes during
COVID-19 pandemic.
Product reaction cards were developed by
Microsoft as part of a “desirability toolkit” created to
understand the illusive, intangible aspect of
desirability of UX with a product. 60% of the set of
118 cards contains positive and 40% negative or
neutral words. This ratio is based on Microsoft’s
analysis of higher-than-average positive responses
from participants in completing post-test
questionnaires. Table 1 shows an extract of the cards.
Table 1: An extract of the MRC card set.
Accessible Creative Fast Meanin
g
ful
Advance
d
Confusin
g
Flexible Motivatin
g
Anno
y
in
g
Difficult Fra
g
ile Not Secure
Appealing Date
d
Fresh Novel
Boring Desirable Fun Stable
UX is seen as a holistic concept that includes all
types of emotional, cognitive or physical reactions
concerning the concrete or even only the assumed
usage of a product (Laugwitz et al., 2008). The UEQ
considers aspects of pragmatic and hedonic quality
(Schrepp et al., 2017). Perspicuity, Efficiency and
Dependability represent ergonomic quality aspects,
while Stimulation and Novelty represent hedonic
quality (Laugwitz et al., 2008). The scales of the
questionnaire cover a comprehensive impression of
UX. Both the classical (efficiency, perspicuity,
dependability) and UX aspects (originality,
stimulation) are measured.
The UEQ consists of 26 items grouped into 6
scales (see Table 2).
Table 2: An extract of UEQ.
12345 6 7
annoying ooooo o o enjoyable
creative ooooo o o dull
valuable ooooo o o inferio
r
b
orin
g
ooooo o o excitin
g
fast ooooo o o slow
Each item consists of a pair of terms with opposite
meanings. The items are scaled from -3 to +3, e.g., -3
is the most negative answer, 0 is neutral, and +3 the
most positive (Schrepp et al., 2017). The 26 items in
the questionnaire are arranged into six scales
(Hinderks et al., 2018).
• Attractiveness: Overall impression of the
product. Do users like or dislike it? Is it
attractive, enjoyable or pleasing?
• Perspicuity: Is it easy to get familiar with the
product? Is it easy to learn? Is the product easy to
understand and unambiguous?
• Efficiency: Can users solve their tasks without
unnecessary effort? Is the interaction efficient
and fast? Does the product react to user input
quickly?
• Dependability: Does the user feel in control of
the interaction? Can he or she predict the
system’s behaviour? Does the user feel confident
when working with the product?
• Stimulation: Is it exciting and motivating to use
the product? Is it enjoyable to use?
• Novelty: Is the product innovative and creative?
Does it capture the user’s attention?
5 EVALUATING USER
EXPERIENCE AND USABILITY
5.1 Goal
Analyse the meeting solutions for the purpose of
carrying out a comparative evaluation with respect to
its usability and UX from the point view of the
researchers in the context of the School of Computer
HUCAPP 2021 - 5th International Conference on Human Computer Interaction Theory and Applications
192

Science in the Faculty of Engineering of the
Universidad of Cuenca (Ecuador).
5.2 Research Questions
In order to study this general goal, we define two
research questions:
• RQ1: When participants have meetings through
the selected tools, is their usability perception
impacted?
• RQ2: Which of the two tools has a higher degree
of user experience?
To answer these research questions, we carried
out one user-centred exploratory study to evaluate
usability and UX.
5.3 Hypotheses
We defined two hypotheses. The null hypotheses
(represented by a 0 in the subscript), which
corresponds to the absence of an impact of the
independent variables on the dependent variables.
The alternative hypotheses involved the existence of
such an impact and are the expected result.
• H
10
Meeting solution does not influence the
usability perception (RQ1).
• H
20
Meeting solution does not influence the UX
(RQ2).
5.4 Variables and Metrics
We consider only one independent variable (a.k.a.
factor (Juristo & Moreno, 2010)) the meeting solution
(Webex and Zoom). As dependent variables (a.k.a.
response variables (Juristo & Moreno, 2010)), we
considered usability and UX, which were expected to
be influenced to some extent by the independent
variable.
5.5 Experimental Context
The study was conducted from 20
th
June to 20
th
July
2020. The teaching-learning activities of the study
programs were given through meeting solutions. The
integration, installation, and positioning of various
components of the meeting solutions depend
significantly on the different factors associated with
the students. The main components required in this
study included a camera, a monitor, speaker,
microphone and Internet connection.
5.5.1 Subjects
The set of experimental subjects was selected by
convenience sampling, i.e., the nearest convenient
persons were selected as subjects. Seventy-nine
Computer Science students (84% males and 16%
females) were invited to participate in the experiment.
Participations was anonymous (aliases were used
instead of names). The subjects did not receive
explicit training on the meeting solutions. A
demographic questionnaire was applied for the
purpose of characterizing subjects according to age,
gender, study level, internet connection quality and
experience with the different meeting solutions used
in the study (see summary in
Table 3).
Table 3: Summary of the results of the demographic
questionnaire.
Gender % Age %
Male 84% 18-20 31.6%
Female 16% 21-23 57.9%
>=24 10.5%
Studies
Level
% Quality of Internet
Connection
%
1
st
yea
r
15.8% Ba
d
10.5%
2
nd
y
ea
r
22.8% Not
g
oo
d
45.6%
3
rd
y
ea
r
52.6% Goo
d
35.3%
4
th
y
ea
r
7.0% Ver
y
g
oo
d
8.6%
The results of the demographic questionnaire
show that the subjects were between 18-20 (31.6%),
21-23 (57.9%) and more than 24 years old (10.5%)
comprising 1
st
year (15.8%), 2
nd
year (22.8%), 3
rd
year (52.6%) and 4
th
year (7%) Computer Science
students. Before quarantine, 87% of the students had
not used meeting tools such as Zoom or Webex for
classes or to participate in a course, while the
remaining 13% had some experience in this field.
However, after March 13
th
, all the students began to
familiarize themselves with both tools of the Moodle-
based virtual platform. Another important detail was
related to the quality of the students’ home Internet
connection. According to the questionnaire, only
8.6% had a very good Internet connection. 35.3% had
a good connection, 45.6% had a not good connection
and 10.5% a bad. This factor could have had an
impact on UX when using Zoom or Webex.
5.5.2 Experimental Design
A within-subject design was selected for the
experiment. This design equates the conditions by
using the same participants in each condition, which
removes individual differences. The order in which
the subjects tested the different meeting solutions was
randomized. The participants were divided into four
groups from the four years of the Computer Science
Evaluating the Meeting Solutions Used for Virtual Classes in Higher Education during the COVID-19 Pandemic
193
course and all used Zoom and Webex to perform the
tasks specified in the teaching-learning process.
5.5.3 Experimental Procedure
The empirical study began with a short presentation
in which general information and instructions were
given, after which the demographic questionnaire was
applied. The tasks involved in the evaluation were:
attending classes, working in groups and sharing
screens. The tasks took approximately twenty
minutes, using Webex and Zoom on different days.
After completing the tasks, they used MRC and UEQ
to evaluate UX and usability. In MRC, they selected
five positive and five negative adjectives for both
meeting solutions and in UEQ they evaluated UX.
6 RESULTS
6.1 UEQ Results
In the next step, we gave to the subjects the UEQ to
evaluate their UX of the meeting solutions to stay in
class. From the answers of the questionnaire and UEQ
tool (available in the UEQ)
5
we obtained the results
of classical usability aspects (efficiency, perspicuity,
dependability) and UX (originality, stimulation).
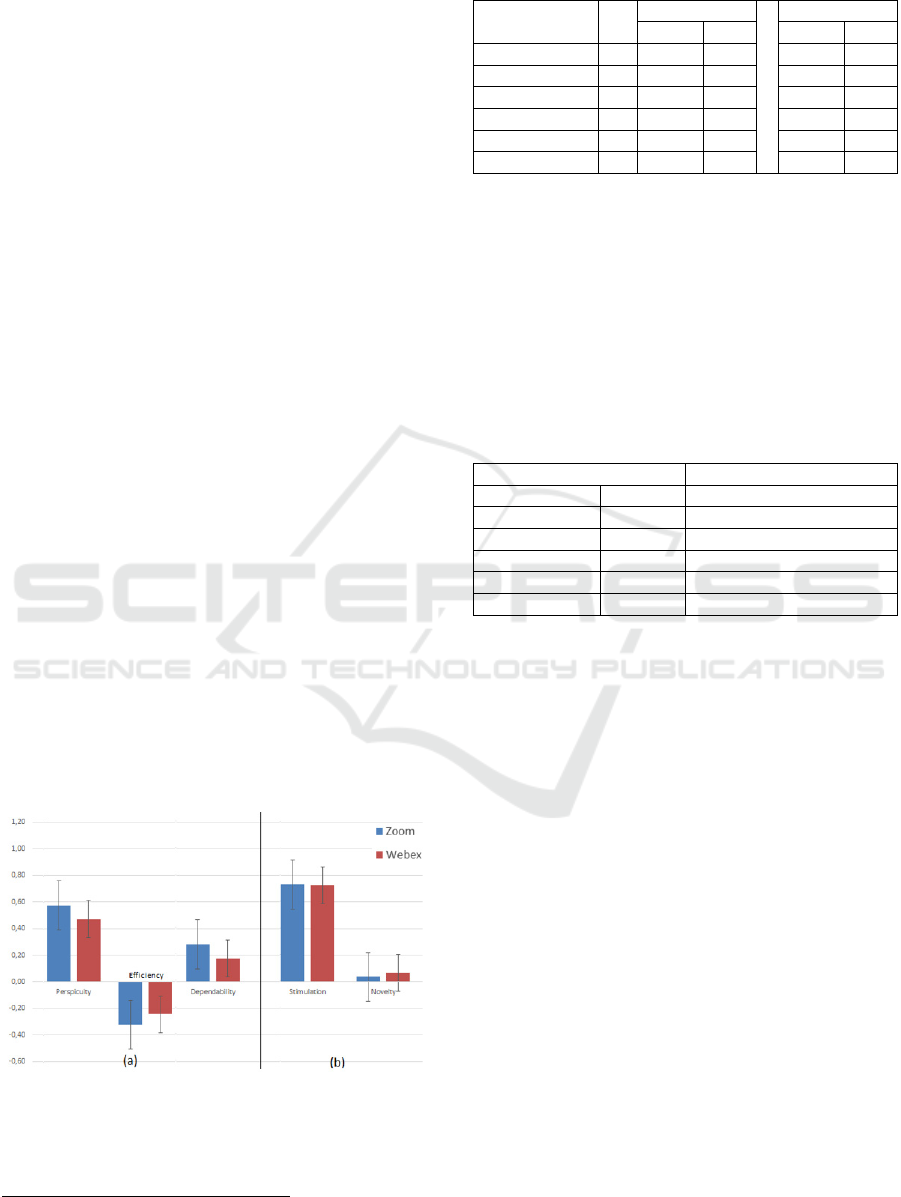
The results obtained from the UEQ related with
classical usability aspects (perspicuity, efficiency,
dependability) are shown in the bar diagram (Figure
2 (a)), where the bars on the left are those of Zoom
and those on the right from Webex. Efficiency was
given a negative value for both tools (Zoom: -0.32
and Webex: -0.24). We also used a bar diagram to
describe the UEQ UX results (stimulation and
novelty). (Figure 2 (b)).
Figure 2: Results of (a) classical usability aspects, (b) user
experience.
5
https://www.ueq-online.org/
Table 4: Comparison of scale means.
Scale N
Zoom Webex
Mean Std. Mean Std.
Attractiveness 79 0.86 0.59 0.41 0.79
Perspicuit
y
79 0.57 0.77 0.47 0.70
Efficienc
y
79 -0.32 0.58 -0.24 0.60
Dependabilit
y
79 0.28 0.56 0.17 0.54
Stimulation 79 0.73 1.08 0.72 1.08
Novelt
y
79 0.04 0.63 0.07 0.66
Table 4 includes the Zoom and Webex results
after applying the statistics to the UEQ values. Table
5 shows a simple T-Test to determine whether the
scale means of the two meeting solutions differed
significantly (alpha level 0.05). It can be seen note
that there is not significant difference in the aspects
for classical usability or in UX aspects between both
meeting solutions. Regarding the attractiveness, it can
be seen there is a significant difference between
Zoom and Webex.
Table 5: T-test results obtained with UEQ tool.
Al
p
ha level: 0.05
Attractiveness 0.0001 Si
g
nificant difference
Perspicuit
y
0.3900 No significant difference
Efficienc
y
0.3978 No significant difference
De
p
endabilit
y
0.2190 No si
g
nificant difference
Stimulation 0.9707 No si
g
nificant difference
Novelt
y
0.7821 No si
g
nificant difference
6.2 MRC Results
Table 6 shows the results obtained from MRC on UX
with two groups of values classified as positive and
negative adjectives for each meeting solution. The
results obtained in the Zoom user experience
evaluation by MRC are classified in two groups: (i)
the five highest scored positive adjectives (Figure 3):
efficient (11.4%), comprehensive (8.1%), fast
(6.1%), useful (5.3%) and responsive (4.8%). (ii) The
five highest scored negative adjectives (Figure 4):
slow (8.6%), not secure (8.4%), boring (7.3%), rigid
(4.8%), and stressful (4.3%).
Figure 3 gives the results obtained from the
Webex evaluation of UX by means of MRC. The five
highest scored positive adjectives are: efficient
(7.34%), comprehensive (6.58), useful (6.58), secure
(6.08) and responsive (4.81%), while Figure 4 gives
the five highest scored negative adjectives: slow
(12.2%), boring (10.4%), stressful (5.6%), not secure
(4.3%), rigid (4.1%), unattractive (4.1%) and
inconsistent (4.1%).
HUCAPP 2021 - 5th International Conference on Human Computer Interaction Theory and Applications
194
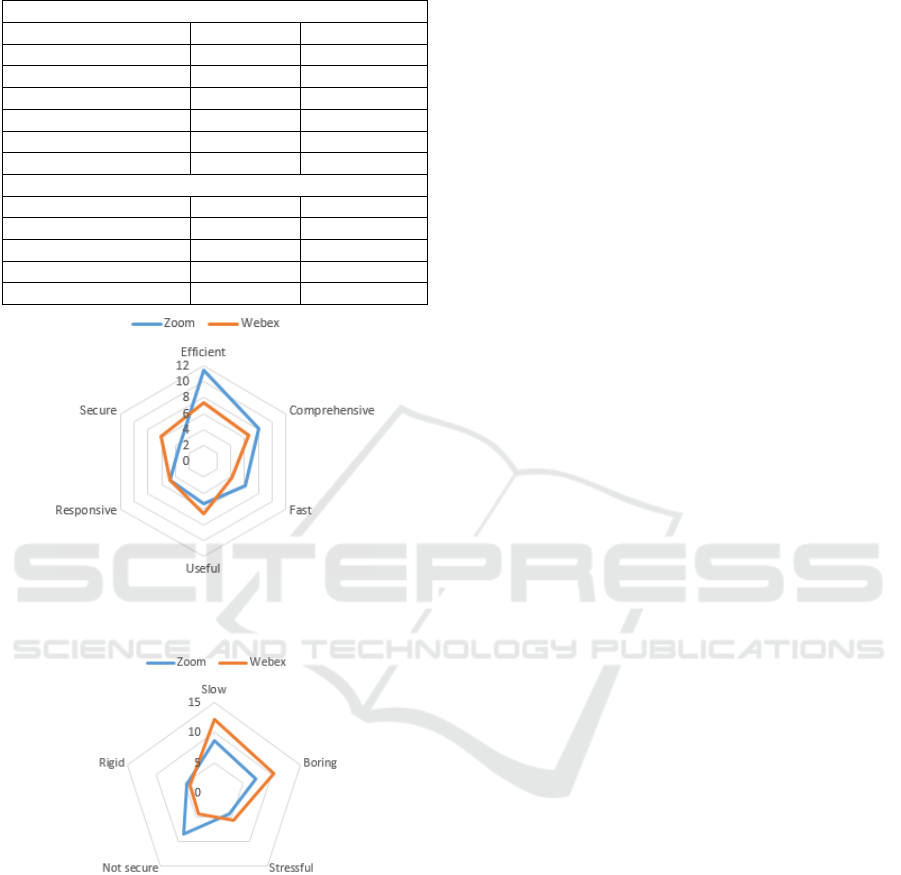
Table 6: The five highest scored positive and negative
adjectives for MRC.
The five highest scored positive adjectives
Adjective Zoom (%) Webex (%)
Efficient 11.4 7.3
Com
p
rehensive 8.1 6.6
Fast 6.1 4.2
Useful 5.3 6.6
Responsive 4.8 4.8
Secure 3.5 6.1
The five highest scored negative adjectives
Slow 8.6 12.2
Borin
g
7.3 10.4
Stressful 4.3 5.6
Not secure 8.4 4.3
Rigi
d
4.8 4.1
Figure 3: The five highest scored positive adjectives for
Zoom and Webex obtained by applying MRC.
Figure 4: The five highest scored negative adjectives for
Zoom and Webex obtained by applying MRC.
7 ANALYSIS OF RESULTS
7.1 UEQ
We considered the results obtained with UEQ to
answer the research questions:
Usability is related with three factors: efficiency,
dependability, and perspicuity. From the results
obtained in the evaluation, described in the Table 5
and shown in Figure 2, we can see that there is no
significant difference between using Zoom and
Webex for classes. However, the efficiency values
obtained in the evaluation are negative: -0.24 for
Webex and -0.36 for Zoom. This implies that the
participants had to make an effort to follow their
classes using both meeting solutions, although less
effort was required with Webex than Zoom. The other
two factors (dependability - Does the user feel
confident when working with the product? and
perspicuity - Is it easy to get familiar with the
product?) obtained very similar mean and SD values,
which means that students found it easy to become
familiar with both meeting solutions and felt
confident in using them.
UX is related with two factors: originality and
stimulation. According to the results obtained in the
evaluation, there is no significant difference in the
UX between Zoom and Webex for classes. The
results obtained for the originality (Is it exciting and
motivating to use the product?) and stimulation or
novelty (Is the product innovative and creative?) have
similar values, showing that the students regarded
these tools as a novelty. They also saw these solutions
as innovative and considered that they help them
resolve their current situation of not being able to
attend classes. In both cases, the null hypotheses
proposed in our work were accepted.
7.2 MRC
From the analysis of MRC results to determine the
users’ opinion, the following can be said: (i) using
positive adjectives to compare both meeting
solutions, we can conclude than Zoom is considered
more efficient than Webex (Figure 3). The
participants considered Zoom more useful,
responsive and faster than Webex.
Considering the negative adjectives (Figure 4), we
can conclude that the participants considered Zoom to
be less secure than Webex, although Zoom was
considered less stressful than Webex. Regarding the
negative adjective “Slow”, Webex was slower than
Zoom. This result could have been influenced by the
quality of the participants’ Internet connection. In the
answers to the demographic questionnaire 56.1% said
that their Internet connection was “bad” or “not
good”.
The “attractiveness” factor measures the overall
impression of the product and answers the question
“Do users like or dislike it?” The participants had a
better impression of Zoom that Webex and they like
preferred it for virtual classes (Figure 5, blue bar:
Zoom, red bar: Webex).
Evaluating the Meeting Solutions Used for Virtual Classes in Higher Education during the COVID-19 Pandemic
195
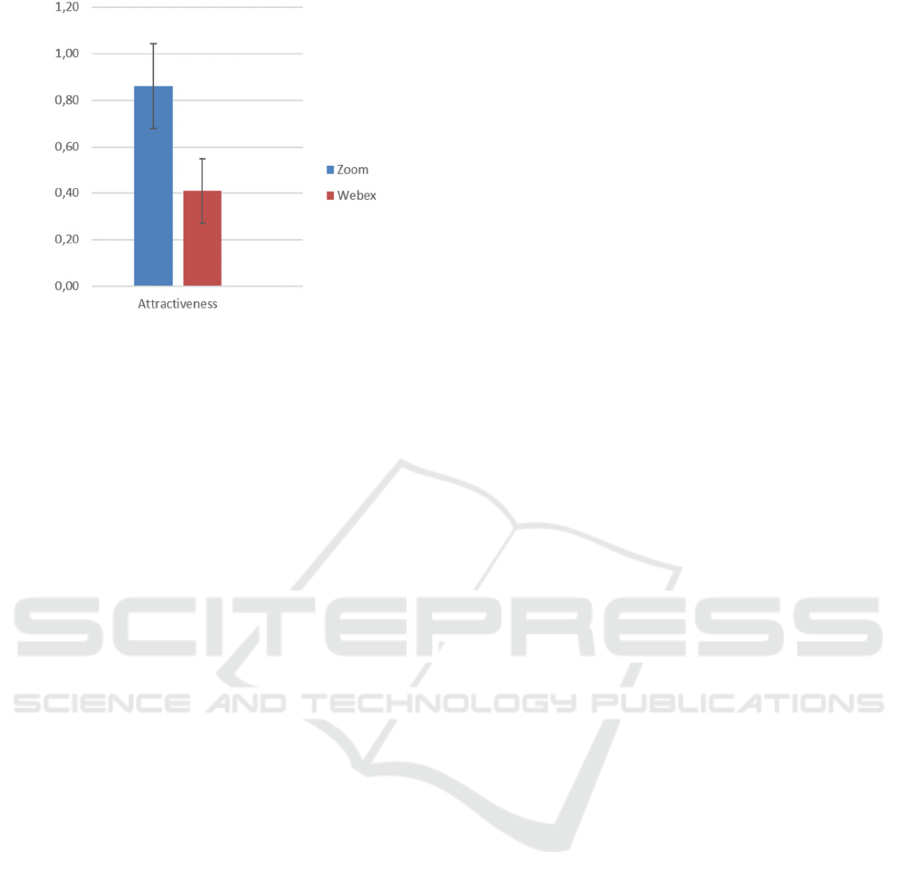
Figure 5: Results of attractiveness obtained from UEQ tool.
8 VALIDITY THREATS
In this work, we considered some validity threats
which could have influenced the UX and usability
results.
The threats to the validity of the conclusions are
concerned with issues that affect the ability to draw
the correct conclusion about the relations between the
treatment and the outcome of an experiment.
a) Reliability of Measures: The validity of an
experiment is highly dependent on the reliability
of the measures. In general, objective measures
are more reliable than subjective measures. In
order to reduce this threat, we used the tested UEQ
and MRC for measuring UX and usability.
However, in this experiment, the precision of
efficiency may have been affected by the
participants’ different qualities of their Internet
connection and devices.
b) Reliability of the Application of Treatments to
Subjects: The application of treatments to
subjects should be as standard as possible for
different subjects and occasions. This factor could
have been affected since the evaluations were
carried out on different occasions. To ensure
maximum similarity, a standard procedure was
designed to be similarly applied by the
experimenter on each occasion. In addition, as the
subjects’ perception could have been affected by
the order and time of the evaluation, the tasks
were assigned randomly with the purpose of
diminishing this threat.
Threats to internal validity concern issues that
may indicate a causal relationship even though there
is none.
a) Instrumentation refers to the effect caused by the
instruments used in the experiment. If these are
badly designed, the experiment is affected
negatively. To minimize this threat, all the
instrumentation and tasks were pre-validated by
two persons. Furthermore, UEQ and MRC forms
were provided in web form, the data collection
and the statistical analysis was double checked.
We also used the UEQ tool available on the UEQ
website to get the results of the classical aspects
of usability and UX.
Threats to external validity concern the ability to
generalize experiment results outside the experiment
setting.
a) Interaction of Selection and Treatment: This is
the effect of not having a representative
population from which to generalize the results of
the experiment. This factor could have affected
the experiment results since the subjects had
similar levels of experience in using the different
meeting solutions. Further experiments with a
more heterogeneous sample of subjects will be
necessary to confirm the results obtained.
b) Interaction of Setting and Treatment: This is
the effect of not having representative material. In
the experiment we carefully selected a
representative task. However, more empirical
studies with other tasks could also be necessary.
Regarding the selection of the meeting solutions,
we consider that Zoom and Webex are
representative solutions we plan to replicate this
experiment with other meeting solutions for
teaching-learning activities.
9 CONCLUSIONS AND FUTURE
WORK
The aim of our research work was to get an overall
picture of the usability and UX of two meeting
solutions used in a virtual teaching-learning
environment during COVID-19 pandemic.
Applying the UEQ and Microsoft Reaction Cards
we obtained results that indicated that Zoom was
considered significantly more attractive than Webex.
However, there was no significant difference in the
classic aspects of usability and UX. As our study only
covered the Faculty of Engineering, we will extend
our research to all the faculties at the University of
Cuenca to measure the impact of COVID-19 on the
educational process when the teaching method is
changed from face-to-face to virtual. Different
stakeholders have different usability goals because
they are involved in different activities (teaching
sessions, laboratory practices, technical support,
interview with students, etc.) and this can affect the
evaluation of usability.
HUCAPP 2021 - 5th International Conference on Human Computer Interaction Theory and Applications
196

ACKNOWLEDGMENTS
This work has been supported by Dirección de
Investigación de la Universidad de Cuenca (DIUC) –
Ecuador.
REFERENCES
Basilaia, G., & Kvavadze, D. (2020). Transition to Online
Education in Schools during a SARS-CoV-2
Coronavirus (COVID-19) Pandemic in Georgia.
Pedagogical Research, 5(4).
Bevan, N., & Carter, J. (2016). Human-Computer
Interaction. Theory, Design, Development and Practice.
In International Conference on Human-Computer
Interaction (Pp. 268-278). Springer, Cham.,
9731(July), 268–278.
Correia, A. P., Liu, C., & Xu, F. (2020). Evaluating
videoconferencing systems for the quality of the
educational experience. Distance Education, 41(4),
429–452.
Crawford, J., Butler-Henderson, K., Rudolph, K., &
Malkawi, B. (2020). COVID-19: 20 Countries’ Higher
Education Intra-Period Digital Pedagogy Responses
Crawford,. Journal of Applied Learning & Teaching,
3(1), 1–20.
Davis, F. D. (1989). Perceived Ease of Use, and User
Acceptance of Information Technology. MIS
Quarterly, 13(3), 319–340.
Hinderks, A., Domínguez-Mayo, F., Meiners, A., &
Thomaschewski, J. (2020). Applying Importance-
Performance Analysis (IPA) to Interpret the Results of
the User Experience Questionnaire (UEQ). Journal of
Web Engineering, 19(2), 243–266.
Hinderks, A., Schrepp, M., & Thomaschewski, J. (2018).
User Experience Questionnaire (UEQ). ueq-online.org
ISO. (2010). Ergonomics of human-system interaction —
Part 210: Human-centred design for interactive
systems. ISO 9241-210:2019(En).
https://www.iso.org/obp/ui/#iso:std:iso:9241:-210:ed-
2:v1:en
Juristo, N., & Moreno, A. (2010). Basics of Software
Engineering Experimentation (1st. Ed.). Springer
Publisher Company.
Khalid, M. S., & Hossan, M. I. (2017). Usability evaluation
of a video conferencing system in a university’s
classroom. 19th International Conference on Computer
and Information Technology, ICCIT 2016, 184–190.
Laugwitz, B., Held, T., & Schrepp, M. (2008). Construction
and Evaluation of a User Experience Questionnaire. In
A. Holzinger (Ed.), HCI and Usability for Education
and Work. USAB 2008. Lecture Notes in Computer
Science. Symposium of the Austrian HCI and Usability
Engineering Group (Vol. 5298, pp. 63–76). Springer,
Berlin, Heidelberg. https://doi.org/10.1007/978-3-540-
89350-9_6
Levinsen, K. T., Orngreen, R., & Buhl, M. (2013).
Telepresence as educational practice in the third
teaching-room-a study in advanced music education.
Proceedings of the European Conference on E-
Learning, ECEL, September 2017, 250–257.
Martin, M. (2005). Seeing is believing: The role of
videoconferencing in distance learning. British Journal
of Educational Technology, 36(3), 397–405.
https://doi.org/10.1111/j.1467-8535.2005.00471.x
McKibbin, W. J., & Roshen, F. (2020). The Global
Macroeconomic Impacts of COVID-19: Seven
Scenarios. SSRN Electronic Journal,
March.
https://doi.org/10.2139/ssrn.3547729
Ørngreen, R., & Mouritzen, P. (2013). Video Conferencing
in a Collaborative and Problem Based Setting. In M. A.
Mélanie Ciussi (Ed.), Proceedings of the 12th
European Conference on e-Learning (pp. 360–368).
Academic Conferences and Publishing International.
Pal, D., & Vanijja, V. (2020). Perceived usability evaluation
of Microsoft Teams as an online learning platform during
COVID-19 using system usability scale and technology
acceptance model in India. Children and Youth Services
Review, 119(October), 105535.
Reimers, F., Schleicher, A., Saavedra, J., & Tuominen, S.
(2020). Supporting the continuation of teaching and
learning during the COVID-19 Pandemic. Annotated
resources for online learning. OECD 2020, 1–38.
Schrepp, M., Hinderks, A., & Thomaschewski, J. (2017).
Construction of a Benchmark for the User Experience
Questionnaire (UEQ). International Journal of
Interactive Multimedia and Artificial Intelligence, 4(4),
40. https://doi.org/10.9781/ijimai.2017.445
Seffah, A., Donyaee, M., Kline, R. B., & Padda, H. K.
(2006). Usability measurement and metrics: A
consolidated model. Software Quality Journal, 14(2),
159–178. https://doi.org/10.1007/s11219-006-7600-8
Singh, R., & Soumya, A. (2020). Updated comparative
analysis on video conferencing platforms- Zoom,
Google Meet, Microsoft Teams, WebEx Teams and
GoToMeetings. EasyChair: The World for Scientists,
1–9. https://easychair.org/publications/preprint/Fq7T
Tullis, T. S., & Stetson, J. N. (2004). A Comparison of
Questionnaires for Assessing Website Usability
ABSTRACT : Introduction. Usability Professional
Association Conference, 1–12.
http://home.comcast.net/~tomtullis/publications/UPA2
004TullisStetson.pdf
UNESCO & IESALC. (2020). COVID-19 and higher
education: Today and tomorrow. Impact analysis,
policy responses and recommendations. 1–46.
https://bit.ly/34TOSvu
Universities, I. A. of. (2020). Covid-19: Higher Education
challenges and responses. https://www.iau-
aiu.net/Covid-19-Higher-Education-challenges-and-
responses
Weitze, C. L., Ørngreen, R., & Levinsen, K. (2013). The
global classroom video conferencing model and first
evaluations. Proceedings of the European Conference
on E-Learning, ECEL, September, 503–510.
Evaluating the Meeting Solutions Used for Virtual Classes in Higher Education during the COVID-19 Pandemic
197
