
ImmVis: Bridging Data Analytics and Immersive Visualisation
Felipe Augusto Pedroso
a
and Paula Dornhofer Paro Costa
b
Dept. of Computer Engineering and Automation (DCA), School of Electrical and Computer Engineering, University of
Campinas (UNICAMP), Brazil
Keywords:
Immersive Analytics, Data Analysis, Virtual Reality, Visual Analytics.
Abstract:
One of the significant issues from the visualisation field is choosing the appropriate tool to conduct a research
project or experiment. The Immersive Analytics (IA) field is no different but found support on game en-
gines and web technologies to create their solutions, frameworks and toolkits. While these technologies solve
problems like rendering and interaction, they do not offer functionalities to enable data analysis inside immer-
sive environments. This paper presents ImmVis, a novel open-source framework that enables IA applications
to benefit from the data analysis capabilities from Python programming language well-established libraries.
The framework is enabled to work with different platforms and programming languages and can be used to
complement the capabilities of existing IA tools, empowering them to offer more sophisticated data analysis
functionalities.
1 INTRODUCTION
Visual Analytics (VA) is the research field that com-
bines automated analysis techniques with interac-
tive visualisations, enabling a practical understand-
ing, reasoning and decision making on enormous and
complex datasets (Keim et al., 2010).
Typical VA systems are based on a standard desk-
top computer, limiting their user experience by the
affordances of its specific interface devices: “2D dis-
plays”, keyboard and mouse (Chen et al., 2017; Lin
et al., 2018; Kwon et al., 2019; Wang et al., 2019;
Zhao et al., 2019). While the usage of these types
of interfaces presented good results historically, the
advent of innovative interfaces and devices favoured
the appearance of a “derivative field”, the Immersive
Analytics (IA) (Chandler et al., 2015; Dwyer et al.,
2018).
The IA field proposes the exploration of data anal-
ysis and decision making systems that benefit from
the new types of interactions allowed by technolo-
gies like Virtual Reality (VR) headsets, large touch
surfaces and Cave Automatic Virtual Environment
(CAVE). Despite the term “immersive” suggesting
only the usage of these technologies, the field is not
limited to them, employing different types of tech-
nologies to remove barriers between people and data
a
https://orcid.org/0000-0002-2463-0459
b
https://orcid.org/0000-0002-1534-5744
analysis tools (Chandler et al., 2015; Dwyer et al.,
2018).
A significant challenge found by IA practitioners
is the fact that while there exist platforms and tools
available for the development of immersive visualisa-
tions, none of them supports the typical tasks of data
analysis or visualisation. More recently, it is possi-
ble to observe the emergence of several tools that,
through the leverage of game engines and web tech-
nologies, present viable alternatives to simplify the
process of authoring and implementation of immer-
sive visualisations (Cordeil et al., 2017; Cordeil et al.,
2019; Sicat et al., 2018; Butcher et al., 2020). While
the results presented by these tools are quite impres-
sive, none of them enables their users to perform more
sophisticated data analysis operations. Also, each one
of them has a different approach to handle and repre-
sent data, making the interoperability between them
more difficult.
This work presents ImmVis, a novel open-source
framework that aids the integration of well established
Python data analysis tools with IA systems developed
on different platforms and programming languages.
During the development of this work, we evaluated
several approaches to enable multiple platforms to in-
teract with Python data analysis tools and created the
initial implementation of the framework, which con-
tains a Python server application and a client library
that integrates the framework with the game engine
Pedroso, F. and Costa, P.
ImmVis: Bridging Data Analytics and Immersive Visualisation.
DOI: 10.5220/0010256001810187
In Proceedings of the 16th International Joint Conference on Computer Vision, Imaging and Computer Graphics Theory and Applications (VISIGRAPP 2021) - Volume 3: IVAPP, pages
181-187
ISBN: 978-989-758-488-6
Copyright
c
2021 by SCITEPRESS – Science and Technology Publications, Lda. All rights reserved
181

Unity
1
. We also evaluated the network performance
while transmitting different volumes of data, having
a satisfactory result as the framework can take ad-
vantage of data analysis capabilities to “simplify” the
data.
The paper is organised as follows: Section 2 dis-
cusses the challenges to choose immersive visuali-
sation tools, which tools are currently available and
where our solution stands among them. Section 3 de-
tails the technical aspects of the ImmVis Framework
and Section 4 shows a performance evaluation. Sec-
tion 5 brings some insights about the development
process and what are going to be the next steps of
our project. Finally, Section 6 presents some final re-
marks of the current work.
2 RELATED WORKS
Choosing the necessary software infrastructure dur-
ing the research and development phases is an essen-
tial issue of the visualisation field. Using existing
tools and frameworks can speed up the implementa-
tion process but also can be limiting, as the constant
evolution of data science field might introduce sce-
narios that were not covered by these tools. Alterna-
tively, researchers often create software infrastructure
for their research groups or projects, tailoring them
for their needs or new scenarios. Choosing one ap-
proach over another is a decision driven by the project
goals, as both present benefits and drawbacks. Ideally,
visualisation researchers should collaborate to lever-
age the advantages of their systems to others and, if
possible, make them interoperable to ease the transi-
tion from one to another (Reina et al., 2020).
In this context, researchers interested in develop-
ing immersive visualisations found support on well-
established game engines and web technologies. De-
spite not having a focus on implementing visual-
isations, the advances of those technologies eased
the process of implementing immersive applications
(Reina et al., 2020).
A pioneering example is the tool iViz, proposed
one year before the term “Immersive Analytics” was
coined. This multi-platform tool was developed us-
ing Unity game engine and provides the possibility of
rendering significant amounts of data in a collabora-
tive environment, with multiple users visualising and
interacting with the data at the same time (Donalek
et al., 2014; Chandler et al., 2015). Also, iViz was the
precursor of Virtualitics Immersive Platform
R
(VIP),
a commercial data analysis solution that enables its
1
https://unity.com/
users to interact and explore data on desktop and VR
environments. VIP also proposes the usage of ma-
chine learning to extract insights and recommend vi-
sualisations according to the data available (Virtuali-
tics, 2015).
Filonik and colleagues proposed Glance, a con-
ceptual framework and architecture to enable data
exploring using VR and Augmented Reality (AR),
through the implementation of GPU-accelerated visu-
alisations (Filonik et al., 2016). The reported results
were promising, and while the project source code
is available
2
there is no documentation or indications
that the project became a concrete implementation.
LookVR is an experimental tool that creates im-
mersive visualisations using the commercial data
analysis platform provided by the company Looker
3
.
This tool allows the user to interact with different
types of visualisations inside a VR environment, in-
cluding an exciting metaphor of “climbing the big
data” (Gieseler, 2017). LookVR is available for free
on Steam
4
, allowing its users to explore embedded
samples or to connect into datasets created utilising
Looker’s platform. It was not possible to find any
documentation or APIs to extend or create new ap-
plications using the tool.
The open-source toolkits “Immersive Analytics
Toolkit” (IATK), and “Data visualisation applica-
tions for eXtended Reality” (DXR) presented interest-
ing approaches to enable a smoother authoring pro-
cess on the Unity game engine environment. Both
tools enable the creation of immersive visualisations
through a Graphical User Interface (GUI) or an Ap-
plication Programming Interface (API), helping users
with different levels of programming knowledge to
author their visualisations. The IATK framework has
the differential of being optimised to render massive
amounts of data, something the DXR authors pointed
as an improvement opportunity of their work (Cordeil
et al., 2019; Sicat et al., 2018). While both toolkits al-
low the creation of custom solutions using their APIs,
their focus is on the authoring aspect and not offering
data analytics functionalities out of the box.
The Visualisation Toolkit (VTK) also offers built-
in support for the development of VR applications
through the leverage of the OpenVR standard, sup-
porting devices like HTC Vive, Oculus Rift and Win-
dows Mixed Reality headsets (Kitware, 2016). Al-
though the usage of VTK in this context presented
varying results, several advances made by its com-
munity may turn this well-established visualisation
tool into a viable option for immersive visualisations
2
https://github.com/filonik/glance
3
https://looker.com/
4
https://store.steampowered.com/app/595490/LookVR/
IVAPP 2021 - 12th International Conference on Information Visualization Theory and Applications
182

Figure 1: An early prototype of ImmVis framework show-
casing the usage of K-Means clustering inside the 3D envi-
ronment.
(O’Leary et al., 2017).
VRIA uses open standards from web technolo-
gies to provide a declarative grammar for creating
multi-platforms visualisations that can be shared or
integrated into other applications. VRIA also offers
the visualisation creation tool “VRIA Builder” and an
API to enable developers to interact with the frame-
work (Butcher et al., 2020).
It is important to note that these frameworks and
tools represent a significant advance on the author-
ing, interaction with the immersive environment and
performing basic exploration tasks of the data. How-
ever, most of them does not offer tools or APIs out
of the box to perform more sophisticated data anal-
ysis tasks like data wrangling, clustering algorithms,
principal component analysis or calculating correla-
tion between the dimensions. The exceptions are the
commercial tools Virtualitics and LookVR.
The present work aims to fill this gap by proposing
“ImmVis”, an open-source framework that connects
Python data analysis tools with a variety of technolo-
gies used to develop immersive applications. This ap-
proach enables the creation of applications that, to-
gether with their visualisation and interactive capa-
bilities, also offer data analysis features to aid the
knowledge discovery from datasets. The framework
runs on multiple platforms and offers integration with
a variety of programming languages, allowing differ-
ent types of applications benefiting from it, including
the frameworks cited in this section.
3 IMMVIS FRAMEWORK
The “ImmVis” framework was initially developed to
support experiments regarding exploratory data anal-
ysis in virtual reality. After evaluating the available
options described in the previous section, we im-
plemented our solution to integrate the data analysis
available in Python with virtual reality visualisations
designed in Unity. Our choice was mainly motivated
by the fact that both platforms are well-established in
their respective domains and have great development
communities behind them.
The main challenge of this approach was pro-
viding interoperability between the two program-
ming environments, as Unity programming language,
which is C#, does not offer a straightforward inte-
gration with Python. The first attempt to implement
it was using existing tools like “‘IronPython”
5
and
“pythonnet”
6
to embed the Python interpreter inside
the Unity application, enabling C# to interact with
Python seamlessly. However, both technologies made
the Unity environment crash frequently, making their
usage impracticable. Also, we perceived that while
embedding the interpreter was not a big problem on
the traditional computers required to use VR, the ap-
proach could be prohibitive on standalone headsets
and smartphones with VR capabilities, as they can
present processing and memory limitations.
A second attempt was made to implement a net-
work communication system to allow Unity to com-
municate with Python through a local network, which
seemed to remove the computing requirements barrier
and could be implemented using libraries available on
both environments. Initially, we decided to try tech-
nologies like WebSockets and REST, that showed ex-
cellent results on transmitting large amounts of data.
However, we noticed during the implementation of
new features that using them would require signifi-
cant efforts to make both programming languages un-
derstand a shared message format. An initial proto-
type for the WebSockets approach is available at our
Github page
7
.
This problem of exchanging messages between
the platforms was solved adopting GRPC, a “Remote
Procedure Call” framework that combined with the
message format definition also allows client applica-
tions to call methods on the server as if they were a
local resource (Chalin, 2020). The usage of GRPC
for a similar purpose was also observed on Unity Ma-
chine Learning Agents Toolkit, a tool that enables the
usage of Unity games and simulation environments to
train intelligent agents (Juliani et al., 2018). Another
advantage of GRPC was the capability of generating
code for multiple programming languages and differ-
ent platforms, potentially extending the reach of our
framework to other contexts like mobile applications
and the other frameworks and tools discussed in Sec-
tion 2.
With the technology defined, we started to iter-
ate over the solution and noticed that it was possi-
ble to generalise some of the components developed
and make the code open-source, enabling other mem-
bers of the community to benefit from the framework
5
https://ironpython.net/
6
http://pythonnet.github.io/
7
https://github.com/imdavi/immvis-server-websocket
ImmVis: Bridging Data Analytics and Immersive Visualisation
183

or contribute with their expertise. Figure 1 depicts
an early prototype of ImmVis, in which we imple-
mented a VR application that allowed users to use the
k-means clustering method on 3D scatter plots. All
the source code of ImmVis, including the develop-
ment history, is available on our Github page
8
under
the MIT license.
3.1 Architecture Overview
The ImmVis framework is composed of a Python
server application and client libraries written in differ-
ent programming languages to integrate the available
services into applications (Figure 2). The server was
developed using a modular approach with the follow-
ing goals in mind: enable components re-usability;
improve code readability; and ease the process of
adding new features.
Our first version of the framework contains essen-
tial services to access remote and local datasets, infer
descriptive statistics and normalise the data to facili-
tate the plotting process.
3.2 Server
The server is the core of the ImmVis framework,
where all the data analysis functionalities are imple-
mented and made available to client libraries through
data services. The server was written using Python,
enabling the server to run on Windows, OS X and
Linux.
The communication between the server and the
clients is implemented using GRPC, which through
the usage Protocol Buffers (Protobuf), can deserialise
the incoming clients’ messages, handle network re-
quests and serialise the response into a format recog-
nised by the clients (Chalin, 2020).
As it is shown in Figure 2, the server is composed
of 3 components: the Data Manager; the Data Ser-
vices; and the Discovery Service.
3.2.1 Data Manager
The “Data Manager” is responsible by the dataset
management, allowing the users to load and manip-
ulate data through the usage of Python libraries like
pandas, scikit-learn and numpy. The component
can load one dataset at a time from local or remote
sources, supporting the following file formats: CSV,
JSON and XLS.
One of the main aspects of the data manager is
agnostic regarding the approach used to communicate
toclients, allowing its reuse with the different commu-
8
https://github.com/imdavi/immvis-server-grpc
nication techniques used during the experimentation
process. This component isolation is achieved by lim-
iting its responsibility only to handling and returning
structures used by the Python data analysis libraries.
The current functionalities implemented on the
data manager are: scan available datasets on a pre-
set directory; load datasets; infer descriptive statistics;
and normalise dataset values. During the initial iter-
ations of the framework, we also experimented with
more advanced analysis tasks like K-Means cluster-
ing method (Figure 1) and outliers detection.
3.2.2 Data Services
The “Data Services” layer is responsible for receiv-
ing the requests from clients to perform a given action
and answer accordingly. The current implementation
of ImmVis contains a single service that exposes the
functions available from “Data Manager”, calling its
methods and mapping its responses to the data struc-
tures used by GRPC.
Since the GRPC framework allows the server to
contain multiple services, this is the proposed way of
adding new functionalities like data filtering, outliers
detection, clusterisation or any specific analysis that
could be performed on the Python environment. An-
other possibility is the creation of services specialised
on domains like image analysis, machine learning,
and signal processing.
3.2.3 Discovery Service
The “Discovery Service” helps clients to discover the
server without a previous environment configuration
or manual input from the application users, which can
be tricky in some types of immersive environments.
Every time the server starts, the connection parame-
ters are broadcast in the local network to help listeners
to connect without having previous knowledge of the
server.
3.3 Client Libraries
While GRPC already generates all the necessary code
to connect and interact with the server, each platform
and programming language can present some partic-
ularities when it comes to establishing and manag-
ing the network connection. The goal of implement-
ing clients libraries is to abstract these characteris-
tics, facilitating the process of integrating the frame-
work with their applications. It is possible to create
client libraries for any platform and programming lan-
guage supported by GRPC. While its implementation
is not mandatory to integrate with the framework, it
IVAPP 2021 - 12th International Conference on Information Visualization Theory and Applications
184
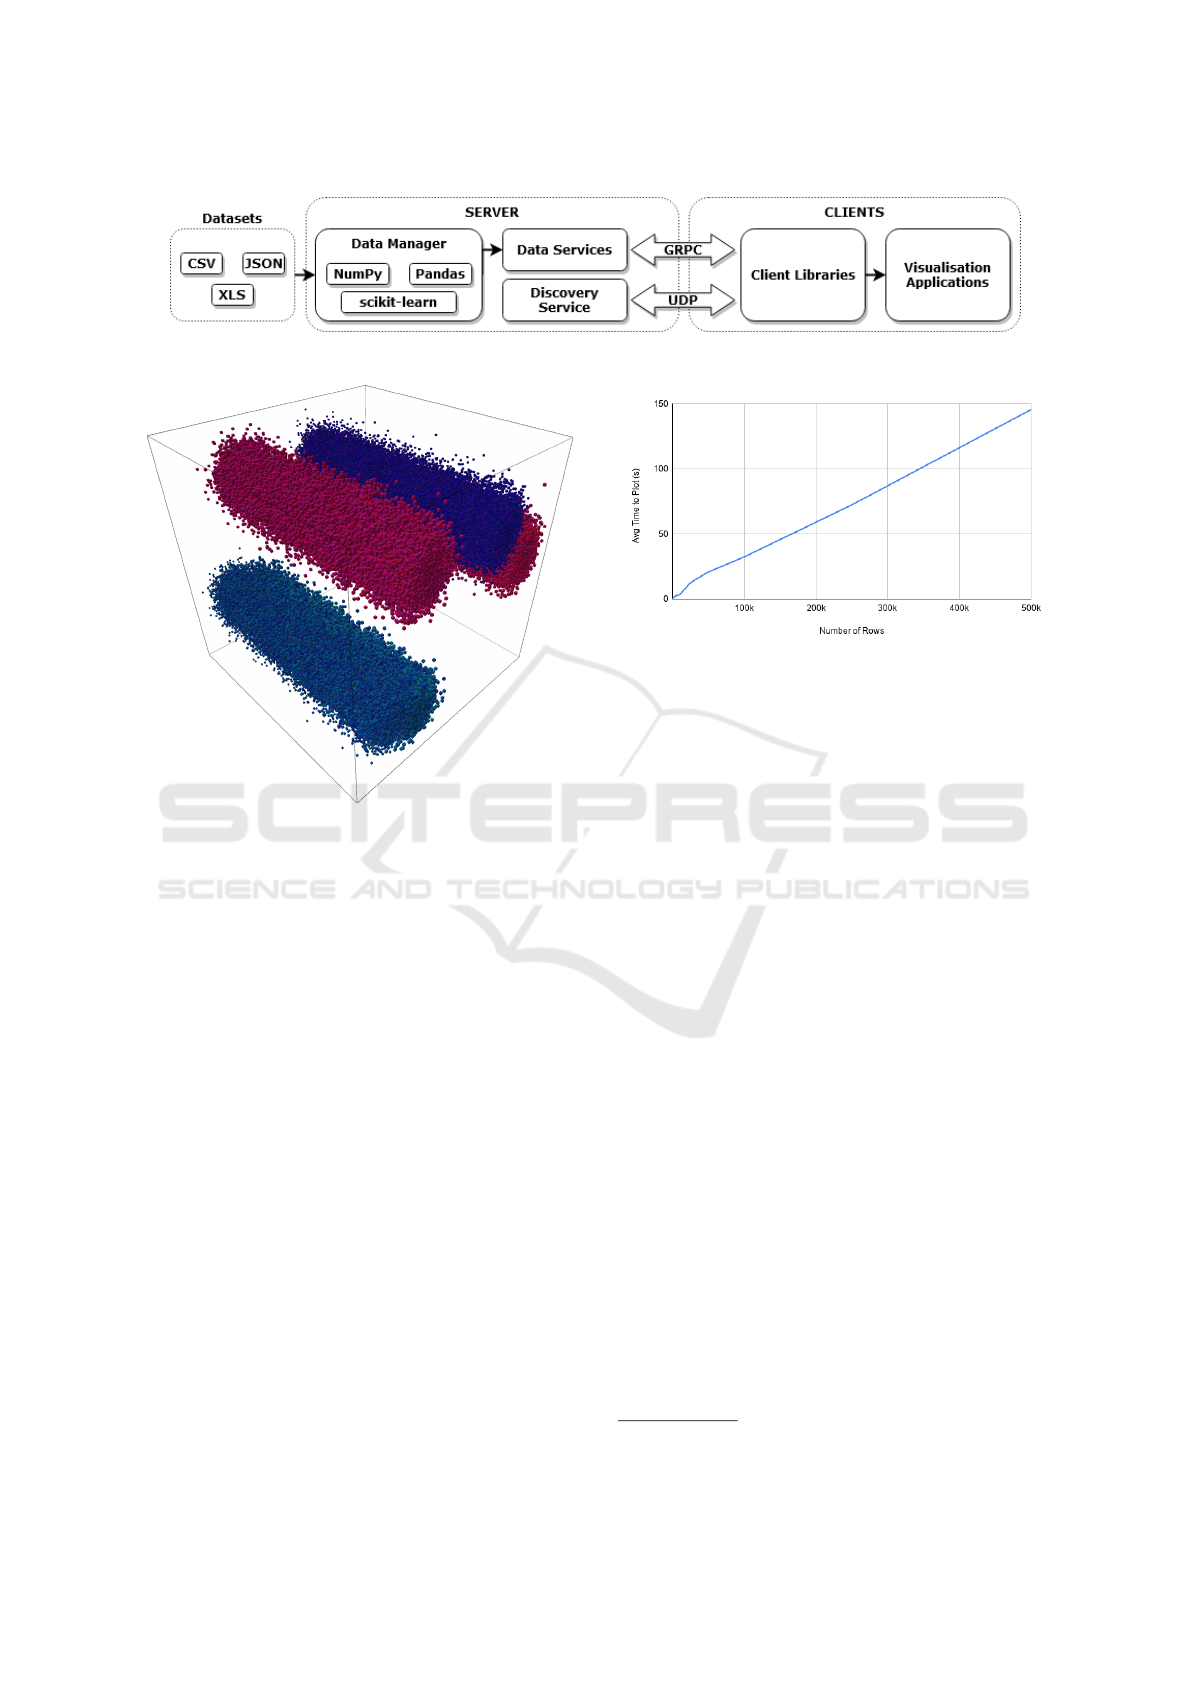
Figure 2: A high-level overview of ImmVis architecture.
Figure 3: A 3D scatterplot with 500,000 points being ren-
dered in Unity using ImmVis as a data source.
can smooth the process of integration for less experi-
enced developers.
The initial version of ImmVis provides a Unity
client library that simplifies the integration by pro-
viding a prefab, a reusable component that develop-
ers can drag and drop into their projects, configure
the connection parameters and subscribe to an event
when the client is ready to interact with the server.
Figure 3 shows one of the samples included with the
library, where the ImmVis is used as a data source of
a 3D scatter plot.
4 PERFORMANCE EVALUATION
One of the concerns of adopting a “client-server” so-
lution is the communication latency between both
parties. To evaluate that, we generated a set of
datasets using the machine learning Python library
scikit-learn, and we measured the performance of the
scatter plot application shown in Figure 3.
The tests were performed using the same com-
puter as server and client, using the loopback network
interface. The device used has the following specifi-
Figure 4: The performance evaluation of ImmVis using
“scikit-learn” generated datasets.
cations: Windows 10; Intel(R) Core(TM) i7-8850H
CPU @ 2.60GHz; 32 GB RAM and the Quadro
P1000 graphics card.
All the generated datasets contained twenty-one
dimensions: the first one representing the “row in-
dex” and the others containing continuous values rep-
resented by floating-point numbers. To evaluate the
framework, we generated 13 datasets with different
sizes, varying the number of rows between 100 and
500,000. The code used to generate the dataset is also
available on our Github page
9
.
The tests measured the time needed to: load the
dataset; infer descriptive statistics; normalise avail-
able value; and send the data to be plotted by the
client. The tests were executed manually ten times
for each dataset available.
Figure 4 shows the results of the measurements
where the amount of time needed to plot the nor-
malised dataset increases linearly according to the
amount of data. As an example, a dataset containing
50,000 rows takes an average of 21s to be loaded and
displayed for the user. Preliminary results of the same
test performed with the same server and an Oculus
Quest device as client showed that the same dataset
takes up to 14.5 seconds.
9
https://github.com/imdavi/immvis-datasets-generation
ImmVis: Bridging Data Analytics and Immersive Visualisation
185

5 DISCUSSION AND FUTURE
WORK
In this section, we elaborate a discussion on the next
steps for the framework and points that we think need
improvement to advance the proposed solution.
• Expanding to Other Domains: the initial imple-
mentation of the framework aimed to handle and
analyse tabular datasets. As described in Section
3.2.2, the framework could provide multiple ser-
vices to enable the interaction with other dataset
types. For example, it would be possible to pro-
vide a service that interacts with imaging libraries
like OpenCV
10
.
• Loading Multiple Datasets: as mentioned on the
Section 3.2.1, the “Data Manager” component is
only able to load one dataset at a time, limiting
some types of analysis that combine the informa-
tion between two or more existing datasets.
• Improve the Data Transmission: As the Sec-
tion 4 showed, the time needed to transmit the
data grows linearly. We need to invest more
time on investigating possible network optimisa-
tions. Preliminary tests showed that changing
some GRPC parameters and adopting streaming
techniques can improve data transmission times.
Also, there is the possibility of adopting Apache
Arrow Flight, another framework that is on early
stages and also leverages GRPC to transport large
datasets over network (McKinney, 2019).
• Integration with Jupyter Notebooks: currently
it is possible to start and interact with an ImmVis
server from Jupyter Notebooks, but we are exper-
imenting with a version that would allow note-
books users to control and interact with the visu-
alisations in the immersive environment.
• Client Libraries for Other Programming Lan-
guages: since GRPC can generate code to mul-
tiple programming languages, it would be inter-
esting to provide other client libraries to explore
how other types of applications can benefit from
the framework.
6 CONCLUSIONS
The present work introduces ImmVis, an open-source
framework that integrates Python data analysis tools
and IA applications, allowing developers of these ap-
plications to leverage analysis capabilities inside the
10
https://opencv.org/
immersive space. Preliminary tests showed that the
framework has the potential of being used with large
amounts of data, and there is an opportunity to opti-
mise data transmission. We believe that through the
usage of ImmVis, data science researchers could ex-
plore data analysis tasks inside the immersive space
and expand the types of metaphors and interactions
allowed by the current systems.
REFERENCES
Butcher, P. W. S., John, N. W., and Ritsos, P. D. (2020).
VRIA: A web-based framework for creating immer-
sive analytics experiences. IEEE Transactions on Vi-
sualization and Computer Graphics.
Chalin, P. (2020). Introduction to gRPC.
https://grpc.io/docs/what-is-grpc/introduction/.
[Online; accessed 9-September-2020].
Chandler, T., Cordeil, M., Czauderna, T., Dwyer, T.,
Glowacki, J., Goncu, C., Klapperstueck, M., Klein,
K., Marriott, K., Schreiber, F., and Wilson, E. (2015).
Immersive Analytics. In 2015 Big Data Visual Ana-
lytics (BDVA), pages 1–8.
Chen, S., Lin, L., and Yuan, X. (2017). Social Media Visual
Analytics. Computer Graphics Forum, 36(3):563–
587.
Cordeil, M., Cunningham, A., Bach, B., Hurter, C.,
Thomas, B. H., Marriott, K., and Dwyer, T. (2019).
IATK: An immersive analytics toolkit. In 2019 IEEE
Conference on Virtual Reality and 3D User Interfaces
(VR), pages 200–209. IEEE.
Cordeil, M., Cunningham, A., Dwyer, T., Thomas, B. H.,
and Marriott, K. (2017). ImAxes: Immersive axes as
embodied affordances for interactive multivariate data
visualisation. In Proceedings of the 30th Annual ACM
Symposium on User Interface Software and Technol-
ogy, pages 71–83.
Donalek, C., Djorgovski, S. G., Cioc, A., Wang, A., Zhang,
J., Lawler, E., Yeh, S., Mahabal, A., Graham, M.,
Drake, A., et al. (2014). Immersive and collabora-
tive data visualization using virtual reality platforms.
In 2014 IEEE International Conference on Big Data
(Big Data), pages 609–614. IEEE.
Dwyer, T., Marriott, K., Isenberg, T., Klein, K., Riche, N.,
Schreiber, F., Stuerzlinger, W., and Thomas, B. H.
(2018). Immersive Analytics: An introduction. In
Immersive analytics, pages 1–23. Springer.
Filonik, D., Bednarz, T., Rittenbruch, M., and Foth, M.
(2016). Glance: Generalized geometric primitives
and transformations for information visualization in
ar/vr environments. In Proceedings of the 15th ACM
SIGGRAPH Conference on Virtual-Reality Contin-
uum and Its Applications in Industry-Volume 1, pages
461–468.
Gieseler, W. (2017). The creation of LookVR.
https://looker.com/blog/creation-of-lookvr. [Online;
accessed 13-September-2020].
IVAPP 2021 - 12th International Conference on Information Visualization Theory and Applications
186

Juliani, A., Berges, V.-P., Vckay, E., Gao, Y., Henry, H.,
Mattar, M., and Lange, D. (2018). Unity: A gen-
eral platform for intelligent agents. arXiv preprint
arXiv:1809.02627.
Keim, D., Kohlhammer, J., and Ellis, G. (2010). Master-
ing the Information Age: Solving Problems with Vi-
sual Analytics. Eurographics Association, 1
st
edition.
Kitware (2016). VTK flavors. https://vtk.org/flavors. [On-
line; accessed 19-September-2020].
Kwon, B. C., Choi, M., Kim, J. T., Choi, E., Kim, Y. B.,
Kwon, S., Sun, J., and Choo, J. (2019). RetainVis:
Visual analytics with interpretable and interactive re-
current neural networks on electronic medical records.
IEEE Transactions on Visualization and Computer
Graphics, 25(1):299–309.
Lin, H., Gao, S., Gotz, D., Du, F., He, J., and Cao, N.
(2018). RCLens: Interactive rare category exploration
and identification. IEEE Transactions on Visualiza-
tion and Computer Graphics, 24(7):2223–2237.
McKinney, W. (2019). Introducing Apache Arrow
Flight: A Framework for Fast Data Transport.
https://arrow.apache.org/blog/2019/10/13/introducing-
arrow-flight. [Online; accessed 27-September-2020].
O’Leary, P., Jhaveri, S., Chaudhary, A., Sherman, W., Mar-
tin, K., Lonie, D., Whiting, E., Money, J., and McKen-
zie, S. (2017). Enhancements to VTK enabling scien-
tific visualization in immersive environments. In 2017
IEEE Virtual Reality (VR), pages 186–194. IEEE.
Reina, G., Childs, H., Matkovi
´
c, K., B
¨
uhler, K., Waldner,
M., Pugmire, D., Kozl
´
ıkov
´
a, B., Ropinski, T., Ljung,
P., Itoh, T., et al. (2020). The moving target of visu-
alization software for an increasingly complex world.
Computers & graphics, 87:12–29.
Sicat, R., Li, J., Choi, J., Cordeil, M., Jeong, W.-K., Bach,
B., and Pfister, H. (2018). DXR: A toolkit for building
immersive data visualizations. IEEE transactions on
visualization and computer graphics, 25(1):715–725.
Virtualitics, I. (2015). Virtualitics homepage.
https://www.virtualitics.com. [Online; accessed
13-September-2020].
Wang, J., Gou, L., Shen, H., and Yang, H. (2019). DQN-
Viz: A visual analytics approach to understand deep
q-networks. IEEE Transactions on Visualization and
Computer Graphics, 25(1):288–298.
Zhao, X., Wu, Y., Lee, D. L., and Cui, W. (2019). iForest:
Interpreting random forests via visual analytics. IEEE
Transactions on Visualization and Computer Graph-
ics, 25(1):407–416.
ImmVis: Bridging Data Analytics and Immersive Visualisation
187
