
Surface EMG Signal Classification for Parkinson’s Disease using WCC
Descriptor and ANN Classifier
Hichem Bengacemi
1,3 a
, Abdenour Hacine-Gharbi
2 b
, Philippe Ravier
3 c
,
Karim Abed-Meraim
3 d
and Olivier Buttelli
3 e
1
Signal Processing Laboratory, École Militaire Polytechnique, Algiers, Algeria
2
LMSE Laboratory, University of Bordj Bou Arréridj, Elanasser, 34030 Bordj Bou Arréridj, Algeria
3
PRISME Laboratory, University of Orléans, INSA-CVL, 12 Rue de Blois, 45067 Orléans, France
Keywords:
sEMG Signal Segmentation, Parkinson’s Disease, Wavelet Cepstral Coefficient (WCC), Artificial Neural
Network (ANN).
Abstract:
To increase the diagnostic accuracy, artificial intelligence techniques can be used as a medical support. The
Electromyography (EMG) signals are used in the neuromuscular dysfunction evaluation. The aim of this paper
is to construct an automatic system of neuromuscular dysfunction identification in the case of the Parkinson
disease based on surface EMG (sEMG) signals. Our proposed system uses artificial neural network method
(ANN) to discriminate healthy EMG signals (normal) from abnormal EMG signals (Parkinson). After de-
tecting the EMG activity regions using Fine Modified Adaptive Linear Energy Detecor (FM-ALED) method,
Discrete Wavelet Transform (DWT) has been used for feature extraction. An experimental analysis is carried
out using ECOTECH’s project dataset using principally the Accuracy (Acc). Moreover, a multi-class neural
networks classification system combined with the voting rule and Wavelet Cepstral Coefficient (WCC) for
healthy and Parkinsonian subjects identification has been developed. The diagnosis accuracy assessment is
carried out by conducting various experiments on surface EMG signals. Proposed methodology leads to a
classification accuracy of 100%.
1 INTRODUCTION
Parkinson’s disease (PD) is a neurodegenerative dis-
order due to the dopaminergic degeneration in the
substantia nigra pars compacta that projects to the
basal ganglia. Heterogeneous symptoms such as
bradykinesia, rigidity, tremor and gait disturbances
are sources of major disability.
In literature, several approaches have been used
for PD motor dysfunction evaluation such as:
gait evaluation through stride intervals recording
(Wendling, 2008; Bhoi, 2017), handwriting (Rosen-
blum et al., 2013), accelerometry (Ghassemi et al.,
2016), voice (Manwatkar et al., ) and the gait analy-
sis using sEMG recordings (Elamvazuthi et al., 2015;
Raut and Gurjar, 2015; Nazmi et al., 2016).
Many studies have been conducted to analyse the
gait variables in neurodegenerative diseases, includ-
a
https://orcid.org/0000-0002-4141-5275
b
https://orcid.org/0000-0002-7045-4759
c
https://orcid.org/0000-0002-0925-6905
d
https://orcid.org/0000-0003-2652-1923
e
https://orcid.org/0000-0001-7290-6344
ing Parkinson’s disease (Carletti et al., 2006; Henmi
et al., 2009; Hausdorff et al., 1998; Sugavaneswaran
et al., 2012). It has been presented that the stride
interval fluctuations are increased in Parkinson’s dis-
eases and correlated to severity’s degree (Hausdorff
et al., 1997). The variability in Electromyogram
(EMG) signal acquired from gastrocnemius muscle
was found higher in PD patients (Miller et al., 1996).
In our study, the muscle’s sEMG recordings are con-
sidered to characterize the subject’s gait. These
sEMG signals are used to detect and classify the
Parkinson from normal gait. The EMG signal is a bio-
electrical manifestation of the neuromuscular activity
which is used in the field of kinesiology studies and
neuromuscular diagnostics.
Several techniques are used for PD classification
such as : probabilistic neural network (Okamoto et al.,
2009), support vector machine (SVM) (Surangsrirat
et al., 2016), K-means clustering algorithm (Bhoi,
2017). In (Elamvazuthi et al., 2015), the ANN us-
ing linear prediction coefficients (LPC) features is de-
veloped to classify neuromuscular disorders (myopa-
thy and neuropathy disorders). The ANN approach
(ANN) was one of the techniques used for sEMG
Bengacemi, H., Hacine-Gharbi, A., Ravier, P., Abed-Meraim, K. and Buttelli, O.
Surface EMG Signal Classification for Parkinson’s Disease using WCC Descriptor and ANN Classifier.
DOI: 10.5220/0010254402870294
In Proceedings of the 10th International Conference on Pattern Recognition Applications and Methods (ICPRAM 2021), pages 287-294
ISBN: 978-989-758-486-2
Copyright
c
2021 by SCITEPRESS – Science and Technology Publications, Lda. All rights reserved
287
classification (Reaz et al., 2006). One of the ANN
major advantages is its ability to represent both linear
and non-linear relationships (Oskoei and Hu, 2007)
(Reaz et al., 2006). Many studies have adopted this
technique to classify time domain features using mul-
tilayer perceptron (MLP) as well as linear discrimi-
nate analysis (LDA) to achieve high classification ac-
curacy up to 95 % (Oskoei and Hu, 2007) (Micera
et al., 2010). Other works combined both time and
frequency domains features and used the back prop-
agation algorithm to increase the classification accu-
racy from 95 % to 96 % (Andrade and Soares, 2001).
Our main contribution is to design an automatic
EMG signal classification system for Parkinson’s dis-
eases diagnosis. The proposed system is based on
ANN classifier combined with the WCC descriptor
and the voting rule. This system enables us to eval-
uate the developed segmentation system of EMG ac-
tivity regions (Bengacemi et al., 2020) for the diag-
nostic task. The main task consists of searching for
optimal parameters of ANN model and WCC coeffi-
cients to achieve the best classification performances.
This approach is carried out in a learning and a test
phases. The learning phase consists in modeling
the two classes P and N (P: Parkinson and N: Nor-
mal), while the test phase aims to evaluate the per-
formance of the classification systems using the ANN
and K-NN method. These two phases require a step
of extracting discriminating parameters from the two
classes.
The rest of the paper is organized as follows: sec-
tion 2 describes the problem formulation and the pro-
posed methodology. Section 3 is dedicated to the per-
formance analysis and discussions while section 4 is
reserved for the concluding remarks.
2 METHODOLOGY
The typical EMG signals of muscles involved in gait
activity contain inactive segments (noise region) with
low activity and active segments (burst EMG activ-
ity) which are mainly composed of the motor unit ac-
tion potential (MUAP). There are mainly three types
of parameters which characterize the MUAP wave-
form such as: amplitude, duration and stability. These
parameters provide information about certain spatial
and temporal characteristics of motor fiber (MF) and
motor unit (MU) activity. Neuromuscular diseases
change the shape, characteristics of the MUAP and
the firing patterns of the motor unit (MU) are also
changed. In normal conditions, MUAPs show mean
peak-to-peak amplitudes of around 0.5 mV and dura-
tion from 8 to 14 ms, depending on the size of the
MUs. In neurogenic disorder, the amplitude is in-
creased to achieve 5 to 10 times normal and the dura-
tion is also increased (Barkhaus, 2001). The size and
shape of MUAPs are determined by certain structural
and functional aspects of MUs (Rodríguez-Carreño
et al., 2012).
In our study, the EMG activity bursts (EMG active
segments) detected using the Fine Modified Adap-
tive Linear Energy Detector (FM-ALED) technique
(Bengacemi et al., 2020), have been selected in order
to classify PD subjects versus normal subjects. The
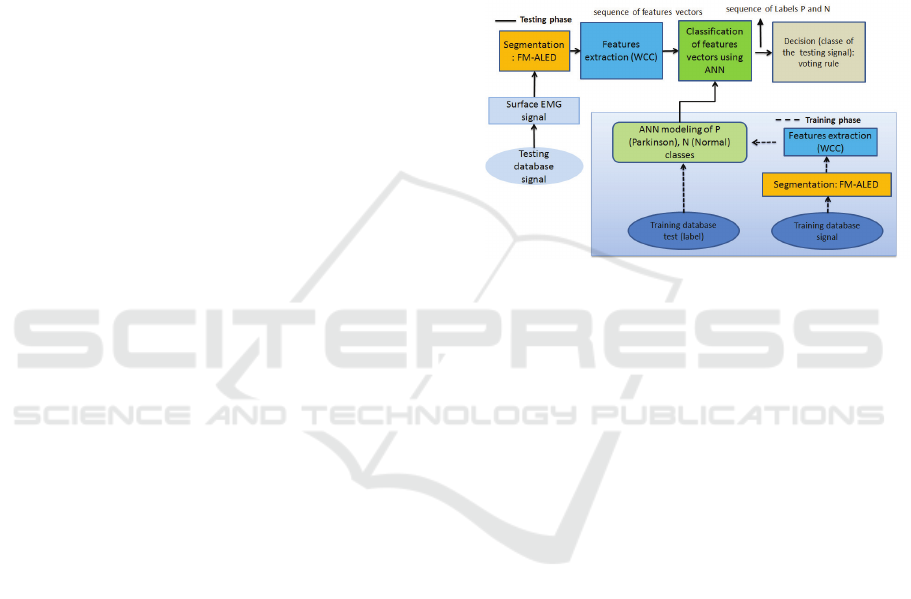
whole task scheme is presented in Fig.1.
Figure 1: Block diagram for classification system.
The proposed classification system is composed of
learning and testing phases. The learning phase con-
sists of detection of EMG activity segments, extrac-
tion of features, modeling of the two classes P and N
using the ANN method. The testing phase consists
of detection of EMG activity segments, extraction of
features, classification of each vector of features by
ANN technique, then classification of the sequence of
vectors of each signal from the test database using the
voting rule in order to find the dominant class from
this sequence. The database of surface EMG signal
is collected from French national project ECOTECH
(Buttelli, 2012). These sEMG signals were obtained
from many subjects (9 healthy subjects and 8 subjects
suffering from Parkinson’s diseases).
2.1 Surface EMG Signal Database
For this research work, eight Parkinsonian patients
and nine healthy subjects were recruited in the frame
of the French national research project ECOTECH
(Buttelli, 2012). This study was approved by the local
ethics committee and subjects provided written con-
sent prior to commencement.
A specific lower limb muscles of gait activity have
been measured. Patients were prepared for electrodes
placement by shaving the skin and cleaning it with al-
cohol wipes. EMG sensors were placed on the muscle
ICPRAM 2021 - 10th International Conference on Pattern Recognition Applications and Methods
288

belly parallel to the main direction of muscle fibres in
accordance with study on the innervation zone (Bar-
bero et al., 2012). Data were collected using an on
board system of wearable sensors (20-450 Hz band-
width, 16 bits per sample, 1926 Hz sampling rate).
Data collection provides several burst activities from
each right soleus muscle corresponding to several gait
cycles. The data base description is reported in tables
1 and 2.
Table 1: Description of sEMG signals for healthy subjects.
Subjects Number of EMG bursts Signal duration (second)
Data base for training phase
Control
1
22 26.0685
Control
2
10 11.2128
Control
3
11 14.3998
Control
4
11 14.7441
Data base for testing phase
Control
5
11 11.1635
Control
6
6 7.7121
Control
7
6 6.5298
Control
8
12 14.3458
Control
9
26 28.5702
Table 2: Description of sEMG signals for Parkinsonian sub-
jects.
Subjects Number of EMG bursts Signal duration (second)
Data base for training phase
Park
1
10 28.5702
Park
2
10 9.1317
Park
3
5 4.8657
Park
4
37 39.6152
Data base for testing phase
Park
5
10 11.2876
Park
6
9 8.9152
Park
7
5 4.4742
Park
8
5 4.6487
2.2 EMG Signal Preprocessing
Several techniques can be used for handling data of
EMG signals before processing the feature extrac-
tion which represents the pre-processing stages such
as data segmentation, filtering and rectification often
considered to improve the data controller accuracy. In
this study, the FM-ALED technique is used to iden-
tify and extract the EMG activity segments in order
to eliminate the non EMG activity regions (noise re-
gions) (Bengacemi et al., 2020). In order to evaluate
the influence of the quality of this preprocessing step
on the classification performance results, the double
threshold method was also considered, as commonly
used in activity EMG segmentation (Bonato et al.,
1998).
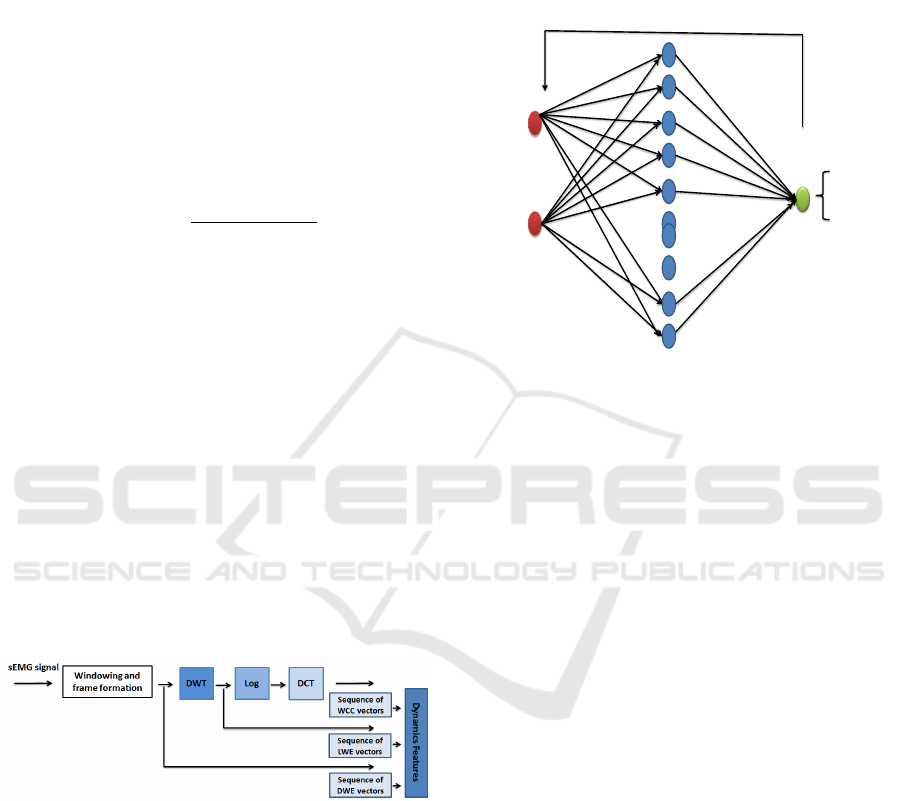
2.3 Features Extraction and EMG
Signal Modeling
The feature extraction plays a critical role to get a ro-
bust classification system. This process transforms
the raw sEMG signal into a feature vector. Gener-
ally, the used features in EMG signals analysis can
be divided into three categories: time domain, fre-
quency domain and time-frequency domain features
(Tsai et al., 2014) (Hogan and Mann, 1980) (En-
glehart et al., 1999). As a particular class within
the time-frequency methods, the time-scale methods
have gained high interest because the scale parameter
provides a natural analysis of biological phenomena,
that is to say a high time precision for rapid events
(low scales) and conversely a poor time precision
with high frequency precision for slow events (high
scales). Moreover, they show a high tuning flexibility
in their design useful for performance seeking. In our
work, we are interested in the use of Discrete Wavelet
transform, particularly the Wavelet Cepstral Coeffi-
cient (WCC) coefficients. In this study, we have also
analysed the Discrete Wavelet Energy (DWE) nor-
malized on total energy of window analysis, the loga-
rithm of wavelet energy (LWE) and the Wavelet Cep-
stral Coefficient (WCC) computed from the discrete
cosine transform (DCT) of LWE (Hacine-Gharbi and
Ravier, 2018) (see Fig.2). All the features were cal-
culated using the discrete wavelet transform (DWT)
which mother wavelet is characterized by two digital
low-pass and high-pass filters. The DWT provides co-
efficients by an iterative down sampling-filtering pro-
cedure achieved at successive scales beginning on the
N-length original signal x[n] up to a desired decom-
position level L
decomp
(that should be lower than the
maximum decomposition level L
max
= log
2
[n] pro-
vided N is a power of 2 or rounded to its nearest
high value). The iterative procedure extracts the set
of wavelet coefficients d
i
[n] at each scale i from 1
up to L
decomp
value plus the a
L
decomp
[n] at the last
scale. Then the DWE features E(d
i
) and E(a
L
decomp
)
are composed of the energy values calculated as the
squared absolute magnitude sum of the wavelet co-
efficients at each scale i. The LWE are the log of
the DWE coefficients previously normalized by the
number of samples per scale. Finally, the WCC co-
efficients are obtained by applying the inverse DCT
on the previous LWE coefficients for decorrelation.
In this work, we investigated the impact of these
descriptors on the performance results of PD clas-
sification. Hence different experiences have been
carried out to search for the optimal configuration.
These features are widely used in: speech recognition
(Lei and Kun, 2016),(Adam et al., 2013), Electrical
Appliances Identification (Hacine-Gharbi and Ravier,
2018) and Recognition of Heart Sound (Xiong et al.,
2019).
In this work, we have also integrated the dynamic
features which are the first order differential coeffi-
cients (also called delta ∆) and second order (called
delta-delta ∆∆), resulting from the initially calcu-
lated coefficients DWE, LWE and WCC, considered
as static features. The static’s features contain only
information on a given frame. In order to improve
Surface EMG Signal Classification for Parkinson’s Disease using WCC Descriptor and ANN Classifier
289
the representation of the frame’s information, it is of-
ten proposed to introduce new features in the vector
of features. (Furui, 1981) and (Furui, 1986) proposed
the use of dynamic features which present the spectral
transition information in the signal. The dynamic fea-
tures are calculed using HCopy command of the HTK
tools library (Hidden Markov Model Toolkit).
Let C
k
(t) is the extracted feature k of frame t,
then the corresponding differential coefficient ∆C
k
is
calculated on 2η
∆
analysis frames by estimating the
slope of the linear regression of the coefficient C
k
at
time t (Young et al., 2006):
∆C
k
(t) =
i=+η
∆
∑
i=−η
∆
i.C
k
(t + i)
2.
i=+η
∆
∑
i=−η
∆
i
2
(1)
The second order differential coefficients ∆∆ (delta-
delta or acceleration) are calculated in the same way
from the first order coefficients.
The proposed system can be seen as pattern recog-
nition system which requires a training and recogni-
tion phases. The first one is used for modelling the
temporal pattern classes and the second one is used
for Parkinson’s diseases classification. Hence, both
phases require feature extraction step to convert each
signal (EMG activity region) in sequence of features
vectors obtained by dividing the signal into overlap-
ping windows and computing from each window a
set of features that constitutes the feature vector (see
Fig.2). This sequence of vectors can be considered as
input sequence of observations in modelling or clas-
sification steps.
Figure 2: Features extraction steps.
2.4 ANN for Subjects Classification
In this research, the ANN have been used with error-
back propagation which is employed as a learning
procedure for multi-layer, feed-forward neural net-
work. By the means of this process, the network can
learn to map a set of inputs to a set of output. In this
work, we have used the reduced-size feature vector
as an input vector. The network topology is made
of one input layer containing N neurons, where N is
the number of features considered, one hidden layer
with 10 neurons and one output layer with one neu-
ron which output gives the Parkinsonian subject or
healthy subject decision (see Fig.3). The activation
function used is sigmoid with Levenberg-Marquardt
algorithm as learning method on Matlab environment.
Healthy
subject
.
.
.
.
.
.
Input: Features
Parkinsonian
subject
.
.
.
Input
layer # 1
Input
layer # N
Output
layer
Hidden
layer
Error back propagation
Figure 3: ANN topology with back-propagation algorithm,
with N neurons in input layer, 10 neurons in hidden layer
and 1 neuron for output layer.
2.5 K-NN Classifier
In this work, we have also used the k-NN classifier
which is commonly applied in the field of pattern
recognition for its simplicity. k-NN is a supervised
classification algorithm that requires a training phase
and a testing phase. In the training phase, each class is
represented by a set of labelled feature vectors, each
feature vector being a class instance. In the testing
phase, each testing input feature vector is compared
to all the labelled feature vectors stored in the train-
ing dataset. The recognized class is the one obtaining
the majority vote between the classes of the K nearest
neighbors.
In this work, K-NN is used for classifying the
feature vectors, each representing an analysis frame.
The default choice k=1 and the Euclidean distance be-
tween two vectors for comparisons are applied.
2.6 Accuracy Measures and Voting Rule
Method
Recall that each labelled signal is composed of a se-
quence of activity regions (previously manually or au-
tomatically segmented from the raw data). Each ac-
tivity region is then decomposed in a sequence of fea-
ture vectors (LPC, DME, LWE or WCC) computed
in successive overlapping analysis frames which tem-
poral duration may vary. We investigated the follow-
ICPRAM 2021 - 10th International Conference on Pattern Recognition Applications and Methods
290

ing frame duration set 16.61 20.00 30.00 33.22 40.00
50.00 60.00 66.45 70.00 80.00 90.00 100.00 110.00
120.00 130.00 132.91 140.00 150.00 expressed in
ms. Each duration value is tested and the best per-
formance result is retained.
Performance results of the sEMG signal classifi-
cation methods are measured using accuracy which
can be differently computed. Basically, each feature
vector is presented as input to ANN or K-NN classi-
fier. The output of the system makes a decision that
is correct or not, depending on the known label of the
signal. From these individual decisions, we can com-
pute the following accuracies:
• The averaged accuracy counts the number of cor-
rect decisions by the total number of input feature
vectors; counts are done by concatenating all the
signals.
• The voting rule method assigns the decision to the
class label for which the decisions number follows
majority rule among all the decisions; the deci-
sions can be made from feature vectors, activity
regions or the whole signal as the concatenation
of activity regions; here, the voting rule for sEMG
activity regions is applied twice: first to feature
vectors for each activity region and second to the
activity regions for each signal; accuracy is the
number of correct decisions made for the signals
by the total number of signals.
• The voting rule for sEMG signal is applied to fea-
ture vectors for each signal; accuracy is the the
number of correct decisions made for the signals
by the total number of signals.
3 RESULTS AND DISCUSSION
To evaluate our proposed method, the developed
study is divided in three parts: the first one is dedi-
cated to evaluate the ANN method for different de-
scriptors for the optimal analysis frame duration. The
second one is dedicated to analyse the selected de-
scriptor for different mothers wavelet, while the third
part is developed for studying the impact of the seg-
mentation and EMG activity burst detection step.
3.1 ANN and K-NN Techniques
In this study, we have evaluated the K-NN and ANN
techniques for different descriptors such as LPC,
DWE, LWE and WCC. We have investigated the
best Acc for the optimal analysis frame duration and
with/without the dynamic features
1
. For this task,
the mother wavelet Coi f 5 for decomposition level
L
decomp
= 4 has been used. The obtained results are
presented in tables 3 and 4. Note that the perfor-
mance gain of the WCC descriptor combined with
ANN technique shows the 100% of Acc compared to
LPC, LWE and DWE descriptors for analysis frame
duration equal to 132.91 ms using voting rule. For
each descriptor, the use of dynamic features improve
accuracy. Tables 3 and 4 show that both voting rule
strategies always improve accuracy (except in one sit-
uation with DWE descriptor and KNN).
Table 3: Performance comparison of the Acc (%) for ANN
method for LPC for p=6, DWE, LWE and WCC features for
different analysis frame durations.
ANN Acc % Frame (ms)
LPC
LPC coefficients without dynamics features 68.67 150
LPC coefficients with dynamics features 69.70 110
Voting rule for EMG activity regions 75 30
Voting rule for surface signal EMG 75 30
DWE
DWE coefficients without dynamics features 54.07 110
DWE coefficients with dynamics features 59.54 140
Voting rule for EMG activity regions 75 66.45
Voting rule for surface signal EMG 75 80
LWE
LWE coefficients without dynamics features 53.08 110
LWE coefficients with dynamics features 64.45 130
Voting rule for EMG activity regions 75 16.61
Voting rule for surface signal EMG 87.5 110
WCC
WCC coefficients without dynamics features 53.75 60
WCC coefficients with dynamics features 63.41 130
Voting rule for EMG activity regions 75 100
Voting rule for surface signal EMG 100 132.91
Table 4: Performance comparison for K-NN method of the
Acc (%) for LPC for p=6, DWE, LWE and WCC features
for different analysis frame durations.
K-NN Acc % Frame (ms)
LPC
LPC coefficients without dynamics features 67.48 140
LPC coefficients with dynamics features 66.29 140
Voting rule for EMG activity regions 87.50 120
Voting rule for surface signal EMG 75 16.61
DWE
DWE coefficients without dynamics features 52.74 140
DWE coefficients with dynamics features 62.75 130
Voting rule for EMG activity regions 62.5 110
Voting rule for surface signal EMG 62 100
LWE
LWE coefficients without dynamics features 52.74 140
LWE coefficients with dynamics features 57.01 61.32
Voting rule for EMG activity regions 75 60
Voting rule for surface signal EMG 75 110
WCC
WCC coefficients without dynamics features 52.74 140
WCC coefficients with dynamics features 57.01 132.91
Voting rule for EMG activity regions 75 60
Voting rule for surface signal EMG 75 132.91
3.2 Choice of the Mother Wavelet and
Decomposition Level
After choosing the feature’s descriptor, we investi-
gate the appropriate mother wavelet and decomposi-
tion level L
decomp
. We have considered L
decomp
varied
form 1 to log2 of samples number of analysis window
1
η
∆
= 1 for equation (1) is the default value of HTK
tools library
Surface EMG Signal Classification for Parkinson’s Disease using WCC Descriptor and ANN Classifier
291
(max level=7). In this work, we consider the follow-
ing wavelet families:
• The Daubechies family with orders 1 to 8: Db1,
Db2, ... , Db10;
• The Symlets family with orders 1 to 8: Sym1,
Sym2, ..., Sym8;
• The Coiflets family with orders 1 to 5: Coif1,
Coif2,..., Coif5.
The obtained results of Acc and L
decomp
are reported
in the tables 5, 6 and 7 for each mother wavelet fam-
ily respectively from which we can note that the best
results:
• For Daubechies family, the mean of Acc is greater
than 82 % and the best one is equal to 100% for
Db6 and L
decomp
= 2;
• For Symlets family, the mean of Acc is greater
than 75 % and the best one is equal to 87.5 % for
Sym7 and L
decomp
= 4;
• For Coiflets family, the mean of Acc is greater
than 82 % and the best one is equal to 100% for
Coi f 5 and L
decomp
= 4.
Table 5: Performance results in terms of Acc for WCC fea-
tures using Daubechies wavelet family.
Daubechies Db1 Db2 Db3 Db4 Db5 Db6 Db7 Db8 Db9 Db10 mean
132.91 ms
L
decomp
6 5 3 2 2 6 2 2 6 2 //
Acc % 62.50 75 75 87.5 87.5 100 87.5 87.5 87.5 75 82.50
Table 6: Performance results in terms of Acc (%) for WCC
features using Symlets wavelet family.
Symlets Sym1 Sym2 Sym3 Sym4 Sym5 Sym6 Sym7 Sym8 mean
132.91 ms
L
decomp
6 6 3 2 2 3 4 2 //
Acc % 62.5 75 75 75 75 75 87.5 75 75
Table 7: Performance results in terms of Acc (% ) for WCC
features using Coiflets wavelet family.
Coiflets Coi f1 Coi f2 Coi f3 Coi f 4 Coi f5 mean
132.91 ms
L
d ecomp
3 3 2 7 4 //
Acc % 75 87.5 75 87.5 100 82.14
3.3 Impact of Segmented Data Base for
PD Diagnostic
In this section, we have studied the impact of the
segmented database based on the FM-ALED and
Double-threshold methods which have been reported
in (Bengacemi et al., 2020) (the obtained results are
presented in table.8). We have used the optimal
configuration composed of descriptor WCC, mother
wavelet Coi f 5, decomposition level L
decomp
= 4 for
analysis frame duration equal to 132.91 ms. The ob-
tained results are reported in the Table.9 from which
we can note that the same results of Acc have been ob-
tained for the both database (labelled and segmented)
for FM-ALED method contrary to Double threshold
method. This result shows that our method is robust
against segmentation inaccuracies. We thus can ex-
ploit the EMG activity bursts for Parkinson’s disease
diagnosis using the ANN approach combined with the
efficiency of the FM-ALED technique for EMG sig-
nals segmentation.
Table 8: Comparison of error probability, mean and stan-
dard deviation (STD) of burst EMG activity detection for
RSol: right soleus for healthy and Parkinson’s subjects.
Statistics are presented for each subject of the EcoTech
dataset (8 Parkinson and 9 healthy) using Double-TH or
FM-ALED method.
Subject (S) S
1
S
2
S
3
S
4
S
5
S
6
S
7
S
8
S
9
mean STD
Parkinson
DoubleT H 0.2308 0.2402 0.1932 0.2108 0.2021 0.2200 0.1982 0.1708 // 0.2104 0.0230
FM − ALED 0.0264 0.1463 0.0823 0.0338 0.0978 0.0583 0.0792 0.1077 // 0.0790 0.0395
Healthy
DoubleT H 0.1211 0.1958 0.2058 0.1873 0.3401 0.2296 0.1804 0.1974 0.2201 0.2086 0.05816
FM − ALED 0.1047 0.0441 0.0699 0.0776 0.0760 0.0438 0.0507 0.0762 0.0760 0.0688 0.0196
Table 9: Performances comparison for labelled and seg-
mented databases for WCC descriptors, mother wavelet
Coi f 5, decomposition level L
decomp
= 4 and analysis frame
duration equal to 132.91 ms.
labelled data base (Acc %)
WCC coefficients without dynamics features 53.55
WCC coefficients with dynamics features 61.38
Voting rule for EMG activity region 75
Voting rule for surface EMG signal 100
Segmented database using FM-ALED (Acc %)
WCC coefficients without dynamics features 53.55
WCC coefficients with dynamics features 61.93
Voting rule for EMG activity region 75
Voting rule for surface EMG signal 100
Segmented database using Double-TH (Acc %)
WCC coefficients without dynamics features 53.96
WCC coefficients with dynamics features 53.55
Voting rule for EMG activity region 62.50
Voting rule for surface EMG signal 50
Table 9 also shows that a high segmentation er-
ror (from 7% for FM-ALED to 21% for Double-TH)
dramatically damages the signal classification perfor-
mance (the best accuracy result is divided by 2). On
the contrary, the segmentation error produced by FM-
ALED has very few influence on the signal classifica-
tion statistics.
4 CONCLUSION
Disease classification has important clinical applica-
tions. The present paper describes new approach to
deal with Parkinson’s disease classification based on
WCC and ANN. The results show that WCC-ANN
achieved high accuracy classification suitable for clin-
ical applications. Hence, it represents an appropriate
solution for the analysis of sEMG signals and its use
for diagnosis purposes. We have also seen the effec-
tiveness of the used method for surface EMG segmen-
tation, named FM-ALED and the interest of voting
rule on the performances of the proposed diagnostic
system.
However, we are aware that the fact a classifier
showing 100% correct classification may be a man-
ifestation of inadequate testing. We have achieved
testing with many combinations of features and pa-
rameters on a dataset of only 17 (9 + 8) patients in
ICPRAM 2021 - 10th International Conference on Pattern Recognition Applications and Methods
292

order to find the best configuration. Our procedure is
motivated by the relative limited dataset, which could
be increased for example by the use of data augmen-
tation methods. Indeed, in a classical way, it is im-
perative to have a sufficiently large dataset in order
to have a separate validation set for selecting the best
configuration. This validation set must be different
from the test set, which should only be used for the fi-
nal performance assessment. Evaluating different pa-
rameters on the test set, which is then used for report-
ing the final classification accuracy inevitably causes
leakage, as such test set cannot be considered "new"
or "unseen" by the algorithm since it was used for
making modeling decisions. Alternative to the sin-
gle training / validation / test split would be a proce-
dure called nested cross-validation (Cawley and Tal-
bot, 2010), often applied in tasks involving small data,
which can be investigated in this work.
Future works will also investigate data of
ECOTECH recorded on other muscles involved in
gait movement.
ACKNOWLEDGMENTS
The present paper used collected data from the French
national project ECOTECH supported by the French
National Agency for research under the contract No.
ANR-12-TECS-0020.
REFERENCES
Adam, T., Salam, M., and Gunawan, T. S. (2013). Wavelet
based cepstral coefficients for neural network speech
recognition. In 2013 IEEE International Conference
on Signal and Image Processing Applications, pages
447–451. IEEE.
Andrade, A. O. and Soares, A. (2001). EMG pattern recog-
nition for prosthesis control.
Barbero, M., Merletti, R., and Rainoldi, A. (2012). Atlas
of muscle innervation zones: understanding surface
electromyography and its applications. Springer Sci-
ence & Business Media.
Barkhaus, P. E. (2001). Motor unit action potential quantita-
tion. In An AAEM workshop. Rochester, Minn: Amer-
ican Association of Electrodiagnostic Medicine, vol-
ume 2.
Bengacemi, H., Abed-Meraim, K., Buttelli, O., Ouldali, A.,
and Mesloub, A. (2020). A new detection method for
EMG activity monitoring. Medical & Biological En-
gineering & Computing, 58(2):319–334.
Bhoi, A. K. (2017). Classification and clustering of parkin-
son’s and healthy control gait dynamics using LDA
and K-means. International Journal Bioautomation,
21(1).
Bonato, P., Alessio, T. D., and Knaflitz, M. (1998). A sta-
tistical method for the measurement of muscle activa-
tion intervals from surface myoelectric signal during
gait. Transactions on Biomedical Engineering, IEEE,
45(3):287–299.
Buttelli, O. (2012). Agence nationale de la recherche.
http://www.agence-nationale-recherche.fr/Projet-
ANR-12-TECS-0020.
Carletti, T., Fanelli, D., and Guarino, A. (2006). A new
route to non invasive diagnosis in neurodegenerative
diseases? Neuroscience letters, 394(3):252–255.
Cawley, G. and Talbot, N. (2010). On over-fitting in
model selection and subsequent selection bias in per-
formance evaluation. Journal of Machine Learning
Research, 11:2079–2107.
Elamvazuthi, I., Duy, N., Ali, Z., Su, S., Khan, M. A., and
Parasuraman, S. (2015). Electromyography (EMG)
based classification of neuromuscular disorders using
multi-layer perceptron. Procedia Computer Science,
76:223–228.
Englehart, K., Hudgins, B., Parker, P. A., and Stevenson,
M. (1999). Classification of the myoelectric signal
using time-frequency based representations. Medical
Engineering and Physics, 21(6):431–438.
Furui, S. (1981). Cepstral analysis technique for automatic
speaker verification. IEEE Transactions on Acoustics,
Speech, and Signal Processing, 29(2):254–272.
Furui, S. (1986). Speaker-independent isolated word recog-
nition using dynamic features of speech spectrum.
IEEE Transactions on Acoustics, Speech, and Signal
Processing, 34(1):52–59.
Ghassemi, N. H., Marxreiter, F., Pasluosta, C. F., Kugler,
P., Schlachetzki, J., Schramm, A., Eskofier, B. M.,
and Klucken, J. (2016). Combined accelerometer and
EMG analysis to differentiate essential tremor from
parkinson’s disease. In Engineering in Medicine and
Biology Society (EMBC), 2016 IEEE 38th Annual In-
ternational Conference of the, pages 672–675. IEEE.
Hacine-Gharbi, A. and Ravier, P. (2018). Wavelet cepstral
coefficients for electrical appliances identification us-
ing hidden markov models. In ICPRAM, pages 541–
549.
Hausdorff, J. M., Cudkowicz, M. E., Firtion, R., Wei, J. Y.,
and Goldberger, A. L. (1998). Gait variability and
basal ganglia disorders: Stride-to-stride variations of
gait cycle timing in parkinson’s disease and hunting-
ton’s disease. Movement disorders, 13(3):428–437.
Hausdorff, J. M., Mitchell, S. L., Firtion, R., Peng, C.-
K., Cudkowicz, M. E., Wei, J. Y., and Goldberger,
A. L. (1997). Altered fractal dynamics of gait: re-
duced stride-interval correlations with aging and hunt-
ington’s disease. Journal of applied physiology,
82(1):262–269.
Henmi, O., Shiba, Y., Saito, T., Tsuruta, H., Takeuchi, A.,
Shirataka, M., Obuchi, S., Kojima, M., and Ikeda, N.
(2009). Spectral analysis of gait variability of stride
interval time series: comparison of young, elderly
and parkinson’s disease patients. Journal of Physical
Therapy Science, 21(2):105–111.
Surface EMG Signal Classification for Parkinson’s Disease using WCC Descriptor and ANN Classifier
293

Hogan, N. and Mann, R. W. (1980). Myoelectric
signal processing: Optimal estimation applied to
electromyography-part ii: Experimental demonstra-
tion of optimal myoprocessor performance. IEEE
Transactions on Biomedical Engineering, (7):396–
410.
Lei, L. and Kun, S. (2016). Speaker recognition using
wavelet cepstral coefficient, i-vector, and cosine dis-
tance scoring and its application for forensics. Journal
of Electrical and Computer Engineering, 2016.
Manwatkar, A. P., Salwe, S., Bagade, A., and Raut, R. A
review on detection of parkinson’s disease.
Micera, S., Carpaneto, J., and Raspopovic, S. (2010). Con-
trol of hand prostheses using peripheral information.
IEEE Reviews in Biomedical Engineering, 3:48–68.
Miller, R. A., Thaut, M. H., McIntosh, G. C., and Rice,
R. R. (1996). Components of EMG symmetry and
variability in parkinsonian and healthy elderly gait.
Electroencephalography and Clinical Neurophysiolo-
gy/Electromyography and Motor Control, 101(1):1–7.
Nazmi, N., Abdul Rahman, M. A., Yamamoto, S.-I., Ah-
mad, S. A., Zamzuri, H., and Mazlan, S. A. (2016).
A review of classification techniques of EMG signals
during isotonic and isometric contractions. Sensors,
16(8):1304.
Okamoto, M., Matsubara, Y., Shima, K., and Tsuji, T.
(2009). EMG pattern classification using hierarchi-
cal network based on boosting approach. Interna-
tional Journal of innovative computing, information
and control, 5(12):4935–4943.
Oskoei, M. A. and Hu, H. (2007). Myoelectric control sys-
tems—a survey. Biomedical Signal Processing and
Control, 2(4):275–294.
Raut, R. K. and Gurjar, A. A. (2015). Bio-medical (EMG)
signal feature extraction using wavelet transform for
design of prosthetic leg. International Journal of Elec-
tronics, Communication and Soft Computing Science
& Engineering (IJECSCSE), 4:81.
Reaz, M. B. I., Hussain, M., and Mohd-Yasin, F. (2006).
Techniques of EMG signal analysis: detection, pro-
cessing, classification and applications. Biological
procedures online, 8(1):11.
Rodríguez-Carreño, I., Gila-Useros, L., and Malanda-
Trigueros, A. (2012). Motor unit action potential du-
ration: measurement and significance. In Advances in
Clinical Neurophysiology. InTech.
Rosenblum, S., Samuel, M., Zlotnik, S., Erikh, I., and
Schlesinger, I. (2013). Handwriting as an objective
tool for parkinson’s disease diagnosis. Journal of neu-
rology, 260(9):2357–2361.
Sugavaneswaran, L., Umapathy, K., and Krishnan, S.
(2012). Ambiguity domain-based identification of al-
tered gait pattern in ALS disorder. Journal of neural
engineering, 9(4):046004.
Surangsrirat, D., Thanawattano, C., Pongthornseri, R.,
Dumnin, S., Anan, C., and Bhidayasiri, R. (2016).
Support vector machine classification of parkinson’s
disease and essential tremor subjects based on tempo-
ral fluctuation. In Engineering in Medicine and Biol-
ogy Society (EMBC), 2016 IEEE 38th Annual Inter-
national Conference of the, pages 6389–6392. IEEE.
Tsai, A.-C., Hsieh, T.-H., Luh, J.-J., and Lin, T.-T. (2014).
A comparison of upper-limb motion pattern recogni-
tion using EMG signals during dynamic and isometric
muscle contractions. Biomedical Signal Processing
and Control, 11:17–26.
Wendling, B. (2008). Gait analysis of left and right stride
intervals in neurodegenerative diseases.
Xiong, L., Zhao, Z., Pan, J., Yang, H., and Wang, W. (2019).
Recognition of heart sound based on wavelet cepstrum
coefficient and probabilistic neural network.
Young, S., Evermann, G., Gales, M., Hain, T., Kershaw, D.,
Moore, G., Odell, J., Ollason, D., Povey, D., Valtchev,
V., et al. (2006). The htk book (for htk version. 3.3),
cambridge university engineering department, 2005.
URL http://htk. eng. cam. ac. uk/docs/docs. shtml.
ICPRAM 2021 - 10th International Conference on Pattern Recognition Applications and Methods
294
