
Profiling and Discriminating of Containerized ML Applications in Digital
Data Marketplaces (DDM)
Lu Zhang
1
, Reginald Cushing
1
, Ralph Koning
1
, Cees de Laat
2
and Paola Grosso
1
1
Multiscale Networked Systems (MNS), University of Amsterdam, Amsterdam, The Netherlands
2
Complex Cyber Infrastructure (CCI), University of Amsterdam, Amsterdam, The Netherlands
Keywords:
Digital Data Marketplaces (DDM), System Calls, N-gram, Profiling, Containers.
Abstract:
A Digital Data Marketplace (DDM) facilitates secure and trustworthy data sharing among multiple parties.
For instance, training a machine learning (ML) model using data from multiple parties normally contributes
to higher prediction accuracy. It is crucial to enforce the data usage policies during the execution stage. In
this paper, we propose a methodology to distinguish programs running inside containers by monitoring system
calls sequence externally. To support container portability and the necessity of retraining ML models, we also
investigate the stability of the proposed methodology in 7 typical containerized ML applications over different
execution platform OSs and training data sets. The results show our proposed methodology can distinguish
between applications over various configurations with an average classification accuracy of 93.85%, therefore
it can be integrated as an enforcement component in DDM infrastructures.
1 INTRODUCTION
A Digital Data Marketplace (DDM) provides a digi-
tal infrastructure to facilitate data sharing in a secure
and trustworthy manner. The collaborating parties,
e.g. data providers and algorithm providers, normally
come to a DDM with a pre-agreed policy describing
which algorithm can work on which dataset. A DDM
should include a component to enforce those policies
(Zhang et al., 2019).
The compute algorithms in DDMs are normally
encapsulated in containers to gain better portability
(Canon and Younge, 2019). Multiple containers may
run on the same platform with permissions to execute
on different data sets. It is crucial to ensure each data
set is accessed by the container running the authorized
algorithm. To avoid information leakage, the DDM
infrastructures are not allowed to access the contain-
ers or the algorithm source code directly. This raises a
question: ”How to distinguish containerized applica-
tions only depending on external monitoring?”, which
we answer in this paper.
System calls provide an interface to the services
provided by an operating system. The behaviors of
a computer program can be well modelled as sys-
tem call sequences (Forrest et al., 1996). In this pa-
per, we propose an architecture to distinguish running
containers by establishing system call profiles. This
can be implemented as an enforcement component
in a DDM. An authorized party builds an authorized
profile of a computing algorithm after verifying the
source code. The program behavior is modelled with
the occurrence of fixed length subsequence of system
calls (n-grams). The execution platform monitors sys-
tem calls in real time and can, at the end of execu-
tion, distinguish programs running inside containers
based on system call profiles. The dissimilarity be-
tween profiles is computed with cross entropy. The
system will trigger an alarm if there is a mismatch be-
tween the policy and classification results.
However, system calls are highly localized and the
generated trace files depend on the configurations of
the execution platforms (Forrest et al., 2008). Also, an
authorized algorithm is retrained multiple times with
different training data sets. To support portability of
containers, an authorized profile may be reused over
platforms with different OSs. To address these points,
we investigate the suitability of our methodology over
different Linux distributions and with different train-
ing sets with 7 typical applications in DDMs. Based
on our experimental results, the proposed profiling
and distance calculation methodology show stable re-
sults over different platform configurations, e.g. OSs
and training data sets. Finally, we demonstrate that
the proposed methodology can gain an average clas-
sification accuracy of 93.85%.
508
Zhang, L., Cushing, R., Koning, R., de Laat, C. and Grosso, P.
Profiling and Discriminating of Containerized ML Applications in Digital Data Marketplaces (DDM).
DOI: 10.5220/0010254105080515
In Proceedings of the 7th International Conference on Information Systems Security and Privacy (ICISSP 2021), pages 508-515
ISBN: 978-989-758-491-6
Copyright
c
2021 by SCITEPRESS – Science and Technology Publications, Lda. All rights reserved
2 RELATED WORK
There are recent studies modelling program behaviour
with system calls. The work in (Paek et al., 2006) pro-
posed to use frequency of individual system calls to
build the normal profiles of an application. Such pro-
files may lose some important information about the
application behaviours because they do not capture
the sequential relationships among systems calls. In
addition, this method is vulnerable to mimic attacks.
Exploiting the profiles, the adversaries can mimic the
benign program to perform malicious actions (Vargh-
ese and Jacob, 2007). (Forrest et al., 1996) proposed
to profile normal behaviors of a running process as a
set of short sequences of system calls. The profile is
an enumeration of all fixed-length subsequence and
an anomaly is flagged if a sufficient number of new
short subsequences occur. (Hofmeyr et al., 1998) pro-
posed a similar version of program profiling method-
ology, which is called STIDE. In this case the authors
use Hamming distances to calculate the dissimilari-
ties to detect anomalies. These works provide us with
a good starting base for our research.
(Suratkar et al., 2019) proposed in their recent
work to use Hidden Markov Chain to model normal
behaviors of applications. The work in (Xiao et al.,
2019) proposed to train an LSTM model with be-
nign behaviors of a running program. However, those
methods are very computationally expensive and re-
quire a large amount of data.
The work in (Das et al., 2017) aimed to analyze
Android App behaviors using system calls. They built
the App profile based on the frequency distribution
of individual system calls. Their conclusion was that
system calls are not sufficient to classify application
behavior. In our work we will demonstrate that this
possible as long as the profiling methodology is more
refined than the one adopted by these authors.
3 ARCHITECTURE
We propose an architecture to enforce the data access
and usage policy among collaborating parties during
the execution phase of a data sharing application. The
architecture can be implemented as one of the en-
forcement components for DDM infrastructures.
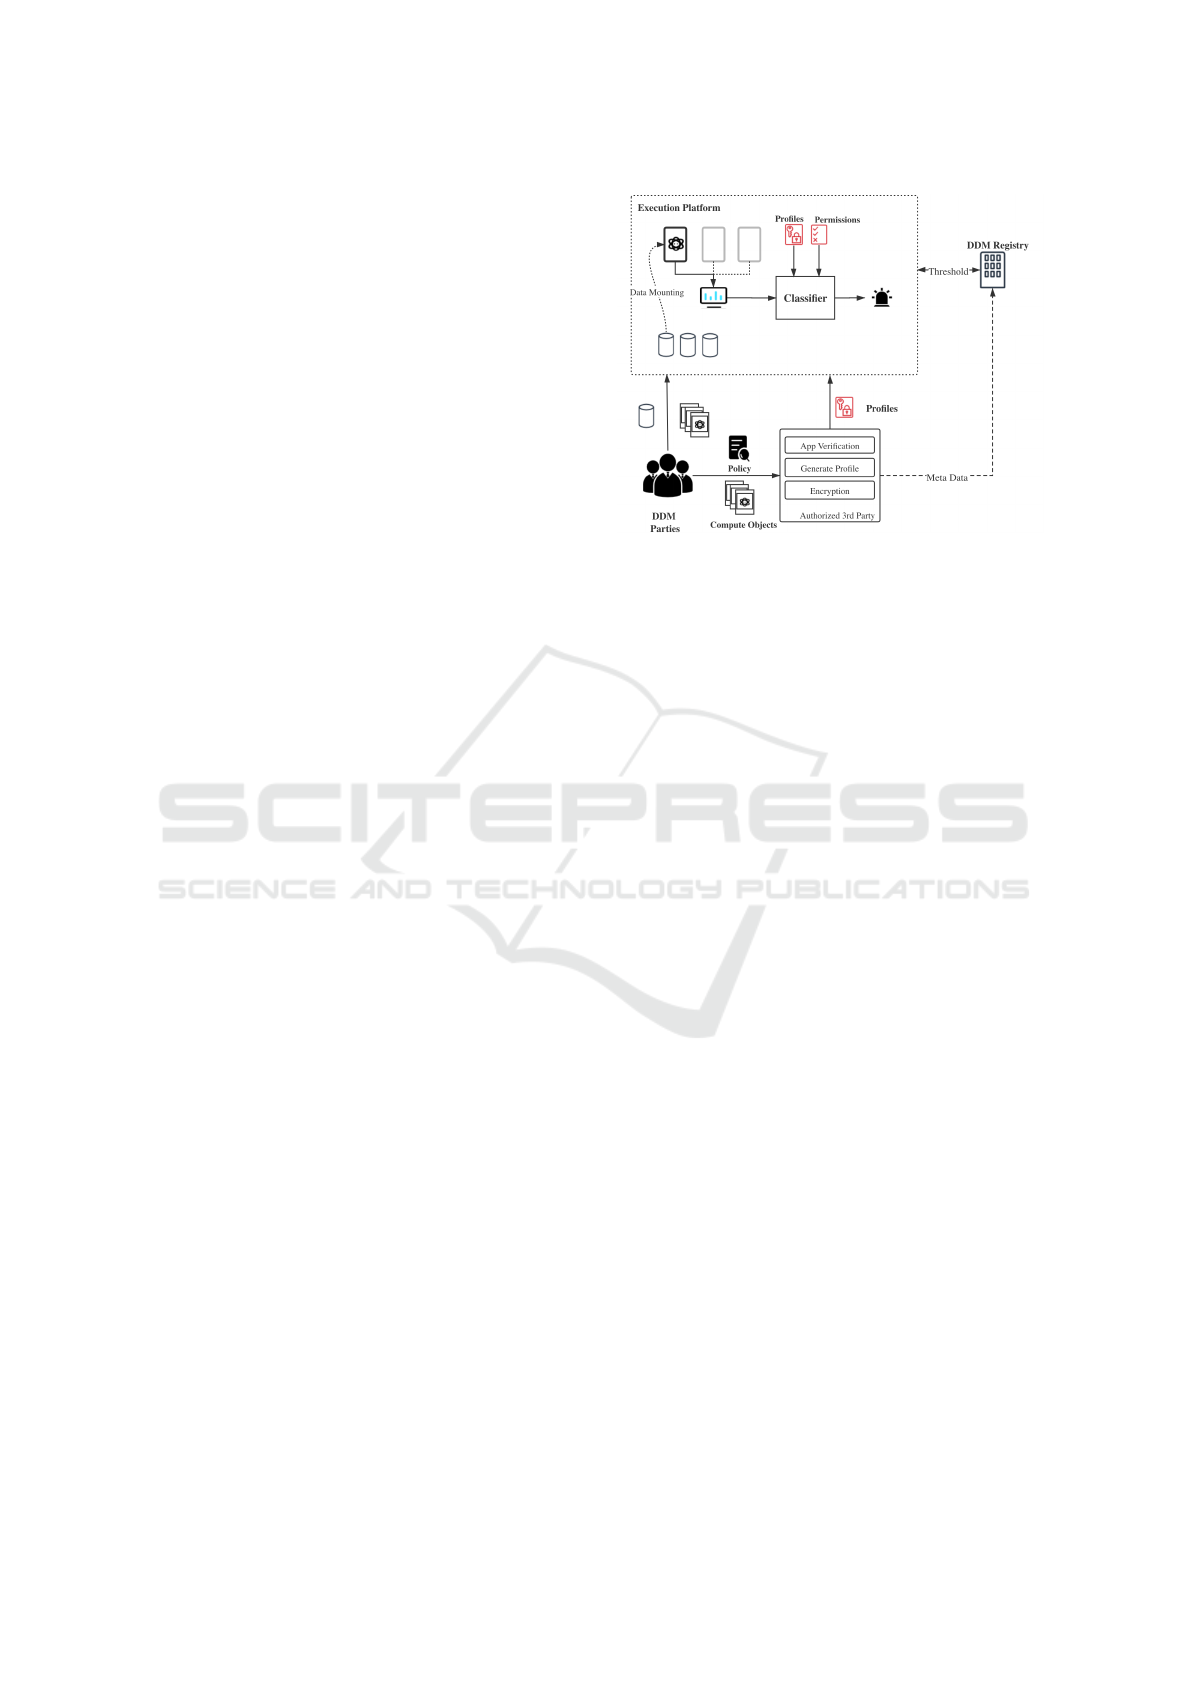
As shown in Figure 1, the data providers and al-
gorithm providers first agree on a policy, which de-
scribes the purpose of the computing algorithm, e.g.
the algorithm can perform on which specific data set.
For portability, the computing algorithms in DDMs
are containerized.
Figure 1: A DDM enforcement component to distinguish
and verify running algorithms inside containers with system
call profiles.
Secondly, the algorithm provider sends its com-
pute algorithm, one or multiple images, and the policy
to an authorized party for verification. It checks the
source code and verifies whether the given algorithm
complies to the policy. If so, the authority party gen-
erates profiles of the application images with system
call traces and sends them to the execution platform.
These profiles are digitally signed and encrypted with
the public key of the execution platform. Thus the
risk of mimic attacks for profiling is highly reduced
(Varghese and Jacob, 2007).
Thirdly, both data objects and compute objects
are sent to the execution platform. To keep confi-
dentiality of the algorithm, the compute containers
are normally executed by its owners remotely. The
platform monitors system calls of running containers
and feeds the information to a classifier. The classi-
fier discriminates running programs inside each con-
tainer and computes the dissimilarities between the
observed tracefiles with all authorized profiles.
4 PROFILE GENERATION
It is important to consider the behavioural variance
of system call traces when programs are running with
different configurations. For instance, the traces of
a specific ML algorithm may change with different
training data sets or with multiple runs. This may
cause false alarms when we use system call profiles
to distinguish compute applications. Good profiling
and similarity computation methodology will reduce
the noise and only extract the information which ac-
tually represents the algorithm behaviours.
Profiling and Discriminating of Containerized ML Applications in Digital Data Marketplaces (DDM)
509
We define self-variance of a profiling methodol-
ogy to be the dissimilarities among system call pro-
files of the same application. It represents how sen-
sitive a profiling methodology is to the intrinsic vari-
ability of the running application. The quantitative
definition of self-variance depends on dissimilarity
measures in the classifier. Higher self-variance is
likely to cause a higher false negative rate when mak-
ing the decisions.
To investigate our proposed methodologies, we set
up an experimental environment illustrated in Figure
2. We want to emulate the action of the authorized
3rd party in Figure 1 when it generates the profile as
well as the actions of the execution platform when it
is monitoring running applications.
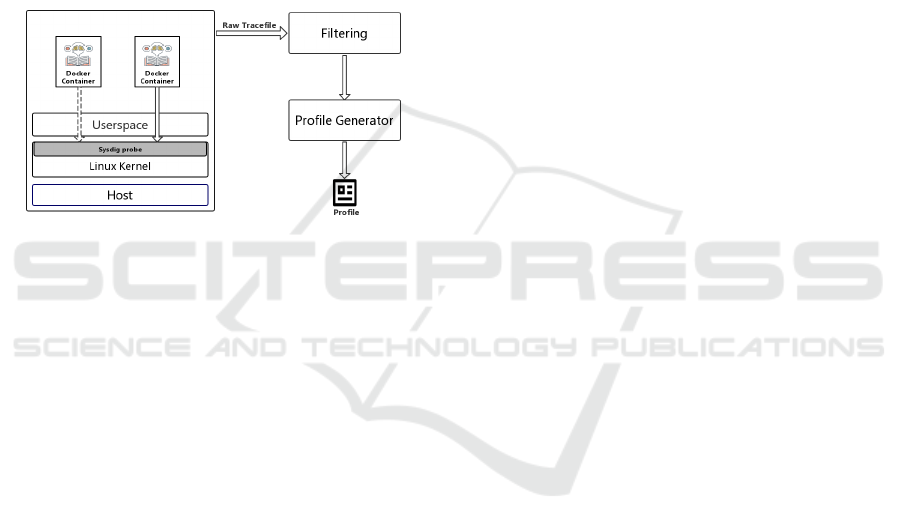
Figure 2: Profile generation setup: a single physical host
running Docker containers and the Sysdig probe in the
Linux Kernel.
We run containers within a physical node. We use
Sysdig to monitor the generated system calls because
it is specifically designed for containers. The probe is
placed in the Linux kernel of the host machine and
it traces all the system calls generated by the con-
tainer. The input data is accessed as the volume of the
Docker container. As shown in Figure 2, the result is
the raw trace file which serves as the input of Filter-
ing component. The Filtering component filters out
all system calls generated by the container runtime.
Finally, the Profile Generator will generate profiles
with the proposed methodology, which will be intro-
duced in Section 6.
5 CLASSIC N-GRAM PROFILES
Recently, there are plenty of work using fixed
length subsequence to detect characterize behav-
iors of running processes (Khreich et al., 2017;
Varghese and Jacob, 2007; Subba et al., 2017).
They segment a system call trace into fixed length
sub-sequence with a sliding window of length n
(normally 3 - 6). The subsequences are called
n-grams, with n being the length of the subsequence.
Suppose we have a sequence of system calls such
as f stat, mmap, close, open, read, write ·· ·. This
can be segmented into a list of n-grams with length
3: { f stat, mmap, close}, {mmap, close, open},
{close, open, read}, {open, read, write},
{read, write ···}.
The traditional n-gram profiling methodology was
proposed in (Forrest et al., 1996). It builds the profile
as an enumeration of all occurring n-grams and the
deviation between two distinct profiles is computed
as the number of n-grams that are distinct in two pro-
files. With the setup illustrated in Figure 2, we aim
to investigate the self-variance of traditional n-gram
profiles. The application is to train a fraud detector.
The operating system is Ubuntu 18.04. We first run
a docker container with the same training data set for
10 times and investigate the self-variance of the gen-
erated n-gram profiles. As seen in Figure 2, Sysdig
traces are generated by an entire container runtime. It
is interesting to filter out the runtime generated sys-
tem calls from the raw trace file. We filter out these
calls with a text processing script we wrote for this
purpose, as illustrated in the Filtering module in Fig-
ure 2.
Table 1 shows the average number of n-gram in
the 10 profiles. We distinguish between profiles gen-
erated by the entire container and profiles with con-
tainer runtime calls filtered out. The similarity of two
n-gram profiles is measured as the proportion of n-
gram entries that are common in both files. We do a
pair-wise comparison of the n-grams in the 10 traces
and show the average number of pair-wise common
n-grams in the middle column. Finally we present the
average number of overall common n-grams in all 10
traces in the last column.
We first focus on unfiltered traces. We can see that
the average number of unfiltered n-grams is 1520; this
reduces to 1310 when we do the pair-wise comparison
and finally only 1205 n-grams are common to all 10
tracefiles. There are only around 86% of the n-gram
entries are common between arbitrary two profiles, as
this is the ratio between 1205/1520. In addition, the
overall similarity is only 79%. Looking at the filtered
profiles we see that the pair-wise similarities are ap-
proximately 88% and the overall similarity is 82%.
This is only slightly better than the unfiltered case and
the likelihood of false negatives is still high.
From this we can conclude that the classic n-gram
profiling and distance computation methodology are
likely to generate false alarms if we adopt it for dis-
criminating containerized applications. In the next
sections we will propose a different profiling method-
ology that can solve this issue.
ICISSP 2021 - 7th International Conference on Information Systems Security and Privacy
510

Table 1: Average number of n-grams for the fraud detection application, before and after filtering of runtime generated system
calls in three categories: all n-grams, pair-wise common n-grams and overall common n-grams.
No. n-grams No. pair-wise common n-grams No. overall common n-grams
Before Filtering 1520 1310 1205
After Filtering 1370 1200 1125
6 N-GRAM FREQUENCY
DISTRIBUTIONS
The traditional n-gram method presented in section 5
builds the profile with distinct n-grams without occur-
rence frequency, which conveys information for de-
scribing the behavior of a program. Using the same
application (fraud detection) and using the 10 filtered
profiles we have obtained in the previous experiment
we produce the occurrence distribution.
Figure 3 shows the CDF of the occurrence distri-
bution of each n-gram in one run of our application.
The axis is the number of occurrence of each n-gram.
Figure 3: CDF of occurrence distribution of n-grams in one
filtered tracefile - a tracefile containing only the container
runtime calls.
There are in total 1350 distinct n-grams in this
profile. The occurrence numbers of those n-grams
range from 1 to as high as 10
5
. As shown in the Fig-
ure, more than 50% of the n-grams occur very rarely
with occurrence numbers of 1. We expect that those
rarely occurred n-grams contain little or at least less
important information about the actual program be-
haviors. On the other hand, n-grams which occur of-
ten provide a clear signature of the application.
This observation is in fact confirmed when we
compare the n-gram entries that are different between
two profiles of our application. We observe that al-
most all of those distinct n-gram entries occur only
once in the profile. In this sense, we confirm that the
traditional n-gram profiling methodology which treats
all the distinct n-grams entries equally does not model
the actual behaviour of an application well and may
result in a lower classification rate.
Hence we propose to profile a containerized pro-
gram with the frequency distribution of n-grams.
We do expect that the distinctive signatures of the
application’s profiles will result in lower variance.
To confirm our assumption we need to identify a
method to calculate the profile distances when they
are expressed as frequency distributions of n-grams.
The dissimilarity of two profiles will then be com-
puted using the cross entropy. Suppose OD
p
=
{nc
(p)
1
, nc
(p)
2
, · ·· , nc
(p)
N
} denotes occurrence distribu-
tion in tracefile tr
p
. nc
(p)
i
indicates occurrence counts
for i the n-gram in the tracefile tr
p
and N denotes the
total number of distinct n-grams. Similarly, OD
q
=
{nc
(q)
1
, nc
(q)
2
, · ·· , nc
(q)
M
} denotes occurrence count of
M n-gram entries in tracefile tr
q
. In most scenarios,
we have two distributions with M 6= N.
To obtain the cross entropy, two input distributions
need to have an equal number of entries. To accom-
plish this we define a procedure to adjust the sets. We
first compute the union set of OD
p
and OD
q
:
OD
u
= OD
p
[
OD
q
= {nc
1
, nc
2
, · ·· , nc
L
} (1)
L ≥ M, L ≥ N (2)
L denotes the cardinality of the union set OD
u
. We
create two sets
ˆ
OD
p
and
ˆ
OD
q
with L entries; we add
all the n-grams contained in OD
u
but not in the orig-
inal OD
p
with an occurrence of zero to form the new
set
ˆ
OD
p
. We do the same procedure to form
ˆ
OD
q
.
ˆ
OD
p
= {nc
1
, nc
2
, · ·· , nc
N
, 0, 0} (3)
ˆ
OD
q
= {nc
1
, · ·· , nc
N
, 0, 0, 0} (4)
To avoid zero probability, we adopt Laplace
smoothing, specifically add-one smoothing, to calcu-
late the frequency distribution.
laplace smoothing =
nc
i
+ 1
∑
L
i
nc
i
+ L
(5)
laplace smoothing :
ˆ
OD
p
→ FD
p
(6)
laplace smoothing :
ˆ
OD
q
→ FD
q
(7)
FD
p
= { f d
(p)
1
, f d
(p)
2
, · ·· , f d
(p)
L
} denotes the fre-
quency distribution of each n-gram entry after ap-
plying laplace-smoothing for tracefile tr
p
. Similarly,
Profiling and Discriminating of Containerized ML Applications in Digital Data Marketplaces (DDM)
511

FD
q
denotes the smoothed frequency distribution for
tr
q
.
After this procedure, we can compute the cross
entropy of two tracefiles tr
p
and tr
q
as:
C(tr
p
, tr
q
) =
K
∑
i=1
( f d
(p)
i
− f d
(q)
i
) · log
f d
(p)
i
f d
(q)
i
(8)
The value of cross entropy has a lower bound of
0 if two distributions are identical. A small value of
cross entropy indicates a large similarity between two
distributions.
7 SELF VARIANCE AND
MUTUAL DISTANCE
In this section we validate our frequency distribution
profile methodology by looking at the self-variance
and the distance of profiles calculated with cross-
entropy, which we define as follows.
Suppose T
M
= {t
(M)
1
, t
(M)
2
, · ·· , t
(M)
P
} represents the
set of tracefiles for Application M. Suppose T
N
=
{t
(N)
1
, t
(N)
2
, · ·· , t
(N)
Q
} represents the set of tracefiles for
Application N.
The self-variance of Application M with tracefile
set T
M
is the average value of the cross entropy for
any pair of tracefiles in set T
M
× T
M
:
self variance(T
M
) = average(C(t
(M)
i
, t
(M)
j
)) (9)
∀(t
(M)
i
, t
(M)
j
) ∈ T
M
× T
M
(10)
Similarly, the average mutual distance between
two applications M and N is calculated as:
Mutual Distance(T
M
, T
N
) = average(C(t
(M)
i
, t
(N)
j
))
(11)
∀(t
(M)
i
, t
(N)
j
) ∈ T
M
× T
N
(12)
To validate our methodology we select 7 typi-
cal DDM applications in the related field of machine
learning. Each application is encapsulated into a
Docker container (Merkel, 2014). All the algorithms
are written in Python and primarily rely on Tensor-
Flow, an open source library that helps to develop and
train ML models. The Docker images of all appli-
cations have a common underlying image of Python
Strech 3.6 and the algorithm script is running on top
of it. We run containers of all 7 applications as the
experimental setup depicted in Figure 2. The kernel
operating system is Ubuntu 18.04 and we run 4 times
for each application.
We compute self variance and average mutual dis-
tances among all 7 containerized applications. The
application names and computation results are shown
in Table 2.
The self variance of each application is shown as
the value on the diagonal line. The self variance is
small compared to the mutual distances. This implies
our proposed classification methodology can provide
a lower false negative rate than the classic n-gram
method.
When we look at the mutual distances between ap-
plication we observe a number of interesting features.
First we see that distances range from a value of 0.38
(App3-App5 pair) to 23 (App4-App6 pair). This large
variation can be explained by observing that a number
of our applications use the same libraries; we there-
fore expect that those applications are more difficult
to distinguish. This is in fact the case for App4 which
has a very unique set of libraries and therefore gives
larger distances.
8 STABILITY
The system call trace files of a running program de-
pend on configurations of the execution environment.
In this section, we will investigate the stability, quan-
tified as self-variance, of generated profiles over dif-
ferent OSs and training sets. We mainly focus on 3 of
them: App 1 - Unbalanced classifier, App2 Text clas-
sification and App3 - Collaboration filtering as they
are widely used ML algorithms in DDMs.
8.1 Stability over Different Platform
OSs
One benefit of containerization is the portability over
different platforms. In DDMs the same application
will run at different times on different platforms, and
that the OS of the execution platforms chosen to run
on may vary. It would be obviously very convenient
if we could determine that a baseline profile gener-
ated by an application in a certain OS can be used for
classification in another OS. To assess this we need
to determine what is the stability of generated profiles
over different platforms as this influences the classi-
fier accuracy. In our experiment we ran the three ap-
plications on 3 host machines, each one configured
with the following OS: Ubuntu 18.04, CentOS 7 and
Debian GNU Linux 9. For each application, the con-
tainer is running 5 times with the same training data
set. We then calculated the cross entropy for all ap-
plication profiles produced in one OS and the cross
ICISSP 2021 - 7th International Conference on Information Systems Security and Privacy
512
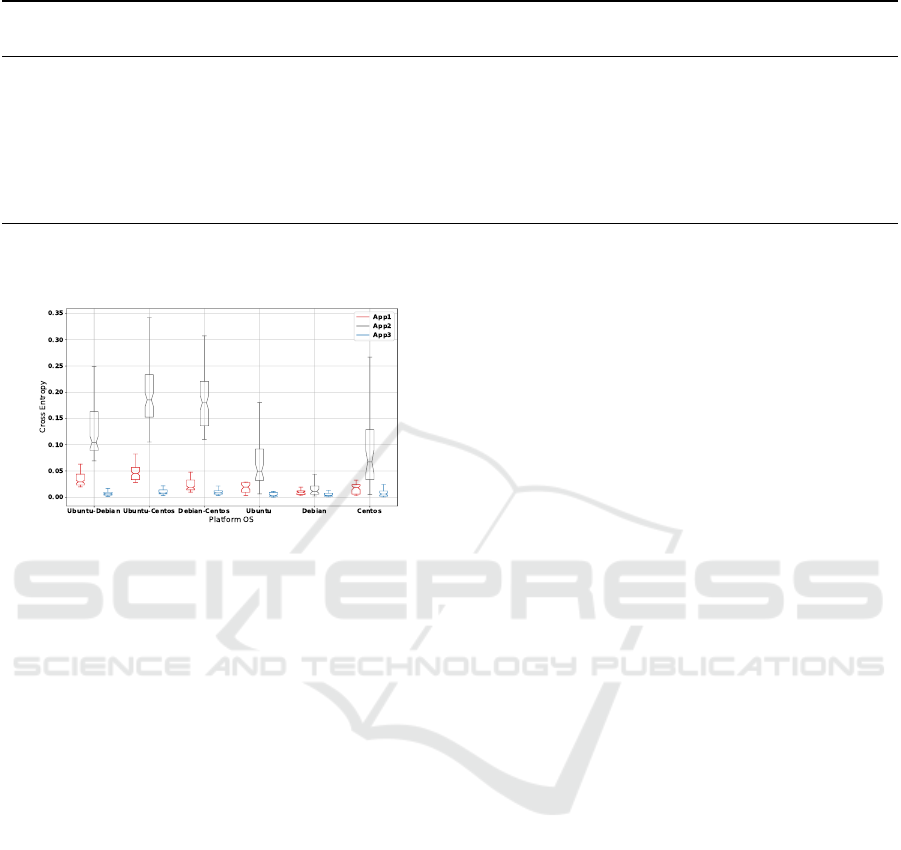
Table 2: Self variance and mutual distances among all 7 containerized applications.
Application name No. APP 1 APP 2 APP 3 APP 4 APP 5 APP 6 APP 7
n-grams
APP 1 Unbalanced classifier 1370 0.064 5.21 1.42 12.5 3 3.35 5.56
APP 2 Text classification 5491 - 0.038 4.81 20 6.09 6.68 9.23
APP 3 Collaborative filtering 1394 - - 0.002 18 0.38 0.66 5.2
APP 4 Federated learning 1140 - - - 0.045 22.3 23 19
APP 5 S2S learning 1452 - - - - 0.0007 0.58 2.76
APP 6 Train a LSTM 1948 - - - - - 0.0009 4.74
APP 7 Train a quasi-svm 2204 - - - - - - 0.02
entropy for pairwise comparison of application pro-
files in different OSs.
Figure 4: Stability of the profiles, expressed as cross en-
tropy, for 3 model applications over execution platforms
running three OSs: Ubuntu, Debian and CentOS.
As shown in Figure 4, there are in total of 6 groups
of boxes. Each group contains the results for the runs
of the same application: App1 in red, App2 in black
and App3 in blue. The 3 groups on the right show
the values of cross entropy of profiles generated on
machines with a specific OS. The 3 groups on the left
show the cross-platform variance of the profiles when
running on two host machines with a different OS.
Not surprisingly, we observe that the variance
among different platforms is application-dependent.
According to Figure 4, the profiles of App2 suffers
from more variance compared to the other two. One
explanation is that App2 is more resource intensive
and that more device management system calls are
inserted into the program behavioral traces. This gen-
erates more rarely occurring n-grams that contribute
to higher variance. Also, we can observe that Debian
GNU Linux 9 provides the most stable profiles for all
3 applications.
When we compare the variances for runs in the
same OSs, with values ranging from 0 to 0.27, to
the runs with different OSs pairs, with values rang-
ing from 0 to 0.34, the cross-platform variance is only
slightly larger. In addition, as shown in Table 2, the
mutual distances among the 3 applications are 5.21
(APP1- APP2), 1.42 (APP1 -APP3) and 4.81 (APP2 -
APP3). The absolute values of the variance cross plat-
forms are smaller than the mutual distances. This in-
dicates the variance of profiles over different platform
os is unlikely to cause false negatives. The results
strongly suggest that our proposed methodology will
support container portability with quite stable perfor-
mance, at least for typical DDM ML algorithms.
8.2 Stability over Different Training
Data Sets
Not only it is important to determine the stability of
profiles across OS-es, it is likewise essential to in-
vestigate the stability over different training data sets.
There are two reasons for this. First, to reduce the
risk of data leakage in a DDM, the authorized party is
not allowed to access the data objects directly and to
execute the compute algorithm on them. This means
that the data used to generate the profile in the autho-
rized party is normally different from the one used for
classification in the execution platform. Secondly, a
DDM customer may retrain a machine learning model
multiple times with different training data sets for
higher accuracy. To determine the stability of each
application in this case we trained the ML model with
the data sets. For each application there are 5 training
data sets of various sizes.
Figure 5 shows the stability of the application pro-
files expressed as cross entropy values for all pairs in
the Cartesian product of the tracefile set. The cross
entropy between profiles of the same application is
small, in the large majority of cases with values lower
0.1. In particular, the profiles of App1 are the most
stable across the 5 training data sets, and the cross
entropy has values ranging from 0 to 0.15 includ-
ing outliers. App2 and 3 have a few outliers with
cross entropy higher than 0.1. App 2 has outliers with
higher entropy values, ranging from 0.17 to 0.7. As
explained in Section 8.1 this is because more device
management system calls are generated in this case
and inserted into the program behavioral traces.
From our two experiments, stability over different
Profiling and Discriminating of Containerized ML Applications in Digital Data Marketplaces (DDM)
513
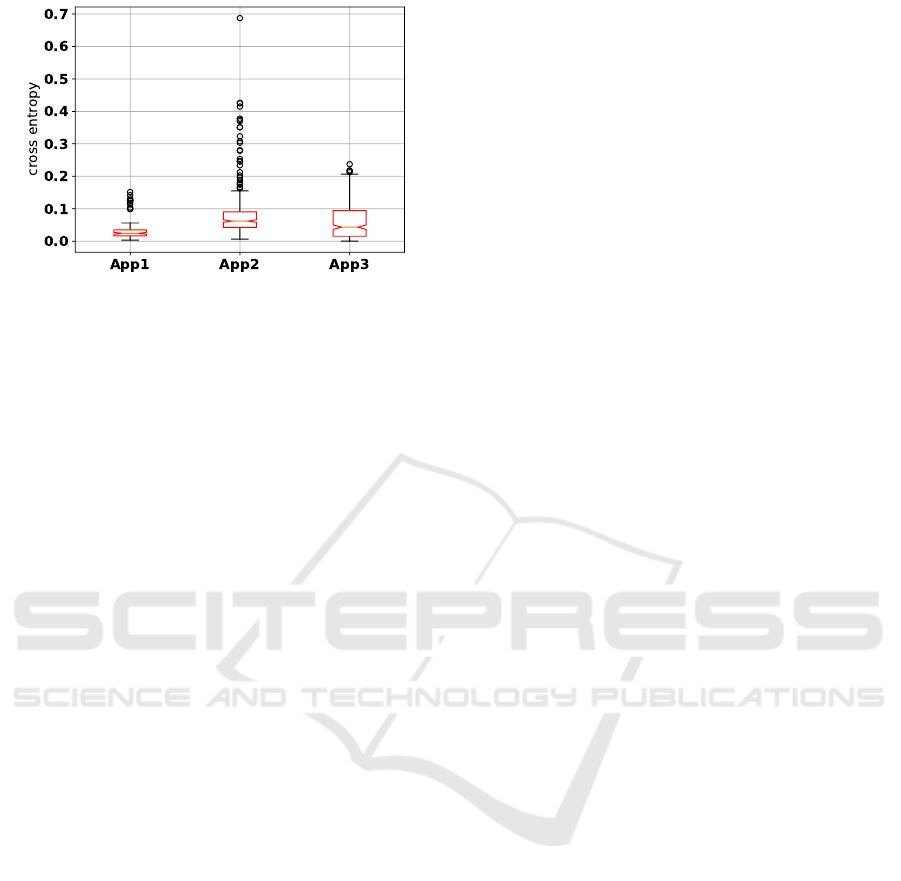
Figure 5: Stability of the three model application profiles
over all data sets expressed as cross entropy.
OSs and different data sets, we can conclude that pro-
files are fairly closely clustered together, as seen by
the low value of cross entropy. This means that we
expect that our methodology can deliver good results
independently from the OSs and training data set the
reference profiles has been generated with.
9 CLASSIFICATION ACCURACY
In this section, we will investigate how well our pro-
posed classifier works for distinguishing container-
ized applications. For each round, we randomly
choose one profile per application to be the refer-
ence profile and measure how accurate our classifier
can determine the remaining application profiles cor-
rectly. Table 3 shows the accuracy confusion matrix
of the classifier for 6 containerized ML algorithms.
In each row we report the classification result of the
specific application. The last column shows the mean
value and standard variation of classification accuracy
rates for each application among 40 rounds.
We can observe that the classifier can always
achieve an accuracy rate of 100% for App2, App6 and
App7 no matter how we built the authorized profiles.
The prediction accuracy is only 86.7% for App1, with
209 samples classified as App3 and 22 samples clas-
sified as App6. False classifications mainly occur be-
tween App3 and App5, App5 and App6. This is be-
cause of their mutual distance, as shown in Table 2,
are only 0.38 and 0.58. For those applications with
lower average classification accuracy, App1, App3
and App5, the std is also higher. This indicates that
the selection of authorized profiles plays an important
role in the performance of the classifier. The classi-
fier can predict profiles with 100% accuracy for some
applications sharing the same libraries and overall ac-
curacy for all applications is as high as 93.85%.
10 DISCUSSION
The work presented so far mainly focuses on distin-
guishing applications running inside the containers
based on system call monitoring. We must stress our
methodology is not concerned with the maliciousness
of the code. The focus is on whether the code is autho-
rized to run. Detecting malicious code and intrusions
in real time is out of the scope for the current paper,
but we will extend our architecture in Fig. 1 to include
this as a separate component.
The performance of our proposed methodology is
lower for applications that are pretty similar to each
other. It will be a focus of our future work to de-
termine if more fine-grained classifiers, namely Sup-
port Vector Machine (SVM), Decision Tree, KNN (K-
nearest neighbour), can improve the current classifi-
cation accuracy. These more refined methods require
many more tracefiles than the ones we currently. Still,
in many DDMs this larger data set tracefiles is diffi-
cult to collect, hence our methods will still be the one
adopted, and we believe deliver more than sufficient
discrimination power, as seen by its overall accuracy
of 93.85%.
Another interesting aspect to consider is the ef-
fect of the tracefile size, i.e. the number of distinct
n-grams contained in it. As we can see from Ta-
ble 2 the six applications we chose produce trace-
files which contain between 1140 and 5941 distinct
n-grams. When we look at Table 3 we can see that
there is no obvious correlation between number of
n-grams and accuracy, which is also a good perfor-
mance indicator for the suitability of our method as it
is application size agnostic.
11 CONCLUSION AND FUTURE
WORK
In this paper we propose an architecture to distin-
guish programs running inside containers by moni-
toring system calls. We propose to profile an algo-
rithm container with n-gram occurrence distribution
and compute dissimilarity with cross entropy. The
methodology allows profile reuse across execution
platforms with different OSs and different training
data sets. We showed that we can gain high classi-
fication accuracy with typical ML applications. Our
method can be easily incorporated in DDMs currently
under development.
In the future we want to profile a compute con-
tainer with multi-dimensional metrics, e.g. in and out-
going network traffic and the CPU usage. This will
ICISSP 2021 - 7th International Conference on Information Systems Security and Privacy
514

Table 3: The confusion matrix of the classifier for 6 applications running with various platform OSs and training data sets.
APP 1 APP 2 APP 3 APP 5 APP 6 APP 7 mean (%) ± std
APP 1 1529 0 209 0 22 0 86.7 ± 0.15
APP 2 0 1760 0 0 0 0 100 ± 0
APP 3 0 0 1623 137 0 0 92.2 ± 0.15
APP 5 0 0 61 1483 216 0 84.2 ± 0.21
APP 6 0 0 0 0 1760 0 100 ± 0
APP 7 0 0 0 0 0 1760 100 ± 0
93.85
allow us to build richer signatures and reduce inaccu-
racy of classification. Additionally we want to extend
our architecture to include intrusion detection mod-
ules, which will not simply classify an application as
being authorized or not, but also try to determine its
behaviour at runtime.
ACKNOWLEDGEMENTS
This paper builds upon the work done within the
Dutch NWO Research project ‘Data Logistics for Lo-
gistics Data’ (DL4LD, www.dl4ld.net), supported by
the Dutch Top consortia for Knowledge and Innova-
tion ‘Institute for Advanced Logistics‘ (TKI Dinalog,
www.dinalog.nl) of the Ministry of Economy and En-
vironment in The Netherlands and the Dutch Commit-
to-Data initiative (https://commit2data.nl/).
REFERENCES
Canon, R. S. and Younge, A. (2019). A case for porta-
bility and reproducibility of hpc containers. In 2019
IEEE/ACM International Workshop on Containers
and New Orchestration Paradigms for Isolated Envi-
ronments in HPC (CANOPIE-HPC), pages 49–54.
Das, P. K., Joshi, A., and Finin, T. (2017). App behavioral
analysis using system calls. In 2017 IEEE Confer-
ence on Computer Communications Workshops, IN-
FOCOM WKSHPS 2017, pages 487–492. Institute of
Electrical and Electronics Engineers Inc.
Forrest, S., Hofmeyr, S., and Somayaji, A. (2008). The evo-
lution of system-call monitoring. In 2008 annual com-
puter security applications conference (acsac), pages
418–430. IEEE.
Forrest, S., Hofmeyr, S. A., Somayaji, A., and Longstaff,
T. A. (1996). A sense of self for unix processes. In
Proceedings 1996 IEEE Symposium on Security and
Privacy, pages 120–128. IEEE.
Hofmeyr, S. A., Forrest, S., and Somayaji, A. (1998). Intru-
sion detection using sequences of system calls. Jour-
nal of computer security, 6(3):151–180.
Khreich, W., Khosravifar, B., Hamou-Lhadj, A., and Talhi,
C. (2017). An anomaly detection system based on
variable n-gram features and one-class svm. Informa-
tion and Software Technology, 91:186–197.
Merkel, D. (2014). Docker: lightweight linux containers for
consistent development and deployment. Linux jour-
nal, 2014(239):2.
Paek, S.-H., Oh, Y.-K., Yun, J., and Lee, D.-H. (2006). The
architecture of host-based intrusion detection model
generation system for the frequency per system call.
In 2006 International Conference on Hybrid Informa-
tion Technology, volume 2, pages 277–283. IEEE.
Subba, B., Biswas, S., and Karmakar, S. (2017). Host based
intrusion detection system using frequency analysis of
n-gram terms. In TENCON 2017-2017 IEEE Region
10 Conference, pages 2006–2011. IEEE.
Suratkar, S., Kazi, F., Gaikwad, R., Shete, A., Kabra, R.,
and Khirsagar, S. (2019). Multi hidden markov mod-
els for improved anomaly detection using system call
analysis. In 2019 IEEE Bombay Section Signature
Conference (IBSSC), pages 1–6. IEEE.
Varghese, S. M. and Jacob, K. P. (2007). Process profiling
using frequencies of system calls. In The Second In-
ternational Conference on Availability, Reliability and
Security (ARES’07), pages 473–479. IEEE.
Xiao, X., Zhang, S., Mercaldo, F., Hu, G., and Sangaiah,
A. K. (2019). Android malware detection based on
system call sequences and lstm. Multimedia Tools and
Applications, 78(4):3979–3999.
Zhang, L., Cushing, R., Gommans, L., De Laat, C.,
and Grosso, P. (2019). Modeling of collaboration
archetypes in digital market places. IEEE Access,
7:102689–102700.
Profiling and Discriminating of Containerized ML Applications in Digital Data Marketplaces (DDM)
515
