
Unipolar Amplifier Enabling Measurement of Far-field Intra-cardiac
Electromyogram for Blood Pump Control
Seraina Anne Dual
1,2,3 a
, Dominic Jacob
1
, Mirko Meboldt
1 b
and Marianne Schmid Daners
2 c
1
Product Development Group Zurich pd|z, ETH Zurich, Tannenstrasse 3, Z
¨
urich, Switzerland
2
Radiology, Stanford University, 780 Welch Rd., Palo Alto, U.S.A.
3
Cardiovascular Institute, Stanford University, 780 Welch Rd., Palo Alto, U.S.A.
Keywords:
Electromyogram, Electrophysiology, Hemodynamic Monitoring, Unipolar Amplifier, Brody Effect.
Abstract:
Heart pumps are implanted as an alternative to heart transplantation in patients with heart failure. Future de-
vices are expected to respond to the physiological need of each patient automatically. Physiological control
algorithms have shown to be robust if based on the measurement of end-diastolic volume (EDV); but real-time
measurements of EDV are not available. In theory, the EDV has been shown to correlate with the maxi-
mum depolarization amplitude (DA) of the intra-cardiac electromyogram (iEMG). In practice, this requires
the unipolar measurement of an electric signal, which has not been attempted inside the heart. We herein
present a custom-built unipolar amplifier, which we connected to a heart pump cannula prototype with four
integrated off-the-shelf pacemaker electrodes. The recorded signals from the unipolar amplifier showed excel-
lent agreement with the gold standard measurement of surface electrocardiogram (ECG) using a commercial
ECG simulator and in-vivo data acquired in four pigs. We present recordings of unipolar iEMG from the
cannula of a heart pump. The new unipolar amplifier makes it possible to measure the DA of the iEMG and
therefore potentially provides a real-time EDV signal to heart pumps for physiological control in the future.
1 INTRODUCTION
Heart pumps are implanted in patients with heart fail-
ure as an alternative to heart transplantation (Kirklin
et al., 2018). The heart pump is implanted in paral-
lel to the heart and provides additional blood flow to
supplement organ perfusion, where the level of sup-
port is determined by the pump speed. Inadequate
pump speed settings can lead to serious complica-
tions such as pulmonary congestion in the case of
under-pumping or suction of the myocardium in case
of over-pumping (Schima et al., 2008). Physiological
control algorithms based on the end-diastolic volume
(EDV) of the left ventricle (LV) have proven save and
robust in the experimental setting (Petrou et al., 2018;
Ochsner et al., 2014; Ochsner et al., 2017). How-
ever, their implementation is hindered by the lack of
real-time measurements of the EDV. A measurement
of EDV could further inform the clinical management
of patients with heart failure, as EDV is understood
to be a surrogate of fluid status. Even if no physio-
a
https://orcid.org/0000-0001-6867-8270
b
https://orcid.org/0000-0001-5828-5406
c
https://orcid.org/0000-0002-6411-8871
logical control algorithm was implemented, real-time
measurement of EDV could help clinicians set an ap-
propriate pump speed or administer diuretics. How-
ever, real-time EDV measurements is unavailable to
date.
The LV EDV has been suggested to correlate with
the maximum electric depolarization amplitude (DA)
of the heart by Brody et al in 1956 (Brody, 1956). The
maximum electric signal (R-wave) coincides with the
end-diastolic time point. The so-called Brody effect
attenuates or increases a measured electric potential
due conduction inhomogeneity. The blood in the LV
has a higher conductivity then its surrounding and
thus constitutes an inhomogeneity. The electric po-
tential in a homogenous thorax Φ
hom
is different from
the electric potential if including the inhomogeneity
of the LV blood pool Φ
inhom
(Brody, 1956). The
Brody factor is calculated as the ratio between these
two electric potentials (β) (Eq. 1) and depends on the
size of the LV blood pool.
β =
Φ
inhom
Φ
hom
(1)
Hence, depending on the LV EDV, the measured elec-
tric potential is increased or decreased by the Brody
40
Dual, S., Jacob, D., Meboldt, M. and Schmid Daners, M.
Unipolar Amplifier Enabling Measurement of Far-field Intra-cardiac Electromyogram for Blood Pump Control.
DOI: 10.5220/0010253800400048
In Proceedings of the 14th International Joint Conference on Biomedical Engineering Systems and Technologies (BIOSTEC 2021) - Volume 1: BIODEVICES, pages 40-48
ISBN: 978-989-758-490-9
Copyright
c
2021 by SCITEPRESS – Science and Technology Publications, Lda. All rights reserved

factor. Changes in the DA will correlate with changes
in the EDV.
Previous studies have investigated the Brody ef-
fect in the surface electrocardiogram (ECG) (Madias
et al., 2005; Amoore, 1985). The gold standard mea-
surement of ECG is performed by obtaining the elec-
tric potential difference between two points on the
body surface (DI, DII, DIII) according to the equa-
tions:
DI = φ
LA
− φ
RA
(2)
DII = φ
LL
− φ
RA
(3)
DIII = φ
LA
− φ
LL
(4)
It was shown that with respect to surface potentials,
the position of the heart in the thorax is likely to affect
the ECG to a much greater degree than the Brody ef-
fect (Amoore, 1985). The electric depolarization can
also be measured using the intra-cardiac electromyo-
gram (iEMG) inside the blood pool. Battler et al.
1980 showed that if measured in close proximity to
the heart the relationship between DA and EDV in-
verts from positive to negative, if measured endo- or
epicardially in conscious dogs (Battler et al., 1980).
Furthermore, the EDV and the DA were also corre-
lated when the iEMG was measured in the blood pool
using a pig tale catheter (Dual et al., 2016). Theoret-
ical analyses further concluded that the Brody effect
depends strongly on the choice of reference and can
only be measured with unipolar electrodes (van Oos-
terom, 2010), which has not been attempted so far.
We herein present a novel unipolar amplifier to as-
sist in measuring the iEMG from electrodes deployed
on the cannula of a heart pump. First, the amplifier
is tested against the gold standard surface ECG mea-
surement. Subsequently, we show unipolar measure-
ments of iEMG in the LV blood pool in four animals.
2 METHODS
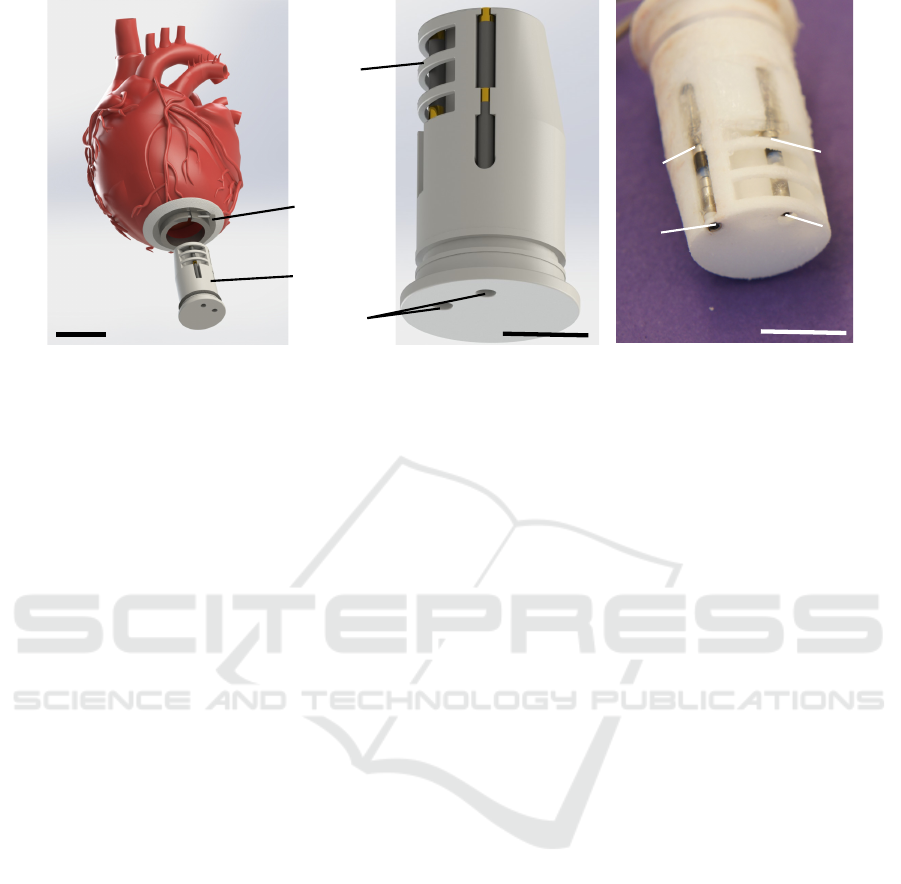
2.1 Design of Cannula and Electrodes
A dummy cannula featuring four electrodes was de-
signed in order to facilitate positioning in the blood
pool using the typical implantation procedure for
heart pumps (see Figure 1). The cannula was 3D-
printed from polyamid 12 (PA 12) using a selec-
tive laser sinter process. The geometry of the can-
nula matched the HVAD (Medtronic, Minneapolis,
MN, USA) suture ring with an outer diameter of
20.6 mm. The cannula was retrofitted with two com-
mercially available pacemaker leads (25539254 IS-
1 BI, Biotronik, Germany) with two electrodes per
lead (B1-B4). The leads were attached and the cav-
ities sealed using silicone glue (Dow Corning 732).
Electrodes B3 and B4 were shielded from interac-
tion with the myocardium, while B1 and B2 were not.
The leads were connected to the data acquisition unit
(DAQ) using shielded cables.
2.2 In-vivo Trial
The cannula prototype was implanted and tested
in acute pig models (n = 4, female, Swiss large
white).The animal housing and all procedures and
protocols were approved by the Cantonal Veterinary
Office (Zurich, Switzerland) under the license number
219/2016. Animal housing and all experimental pro-
cedures were in accordance with Swiss animal wel-
fare protection law, and conform to European Direc-
tive 2010/63/EU of the European Parliament and the
Council on the Protection of Animals used for Scien-
tific Purposes, and to the Guide for the Care and Use
of Laboratory Animals.
After loss of postural reflexes following premed-
ication with ketamine (15 mg/kg), midazolam (0.5
mg/kg) and atropine (0.1-0.2 mg/kg) anesthesia was
deepened by an intravenous bolus injection of propo-
fol (1-2 mg/kg body weight) and the animals were
intubated. General anesthesia was maintained with
propofol (2-5 mg/kg/h, i.v.) in combination with
isoflurane (1%-2.5%) by positive pressure ventila-
tion in an air-oxygen mixture (1:1, 4-6 L/min)with
an inspired oxygen fraction (FiO2) of 0.5, tidal vol-
ume of 6-8 mL/kg, a frequency of 10-15 breaths per
minute and a positive end expiratory pressure (PEEP)
of 5 cmH
2
O. For intra-operative analgesia, buprenor-
phine (0.01 mg/kg body weight) was administered
intravenously approximately 30 minutes before the
cut-down and was continued throughout anesthesia.
During surgery, animals received a continuous intra-
venous infusion of crystalloids (5-7 mL/kg/h).
For maximum control of hemodynamics, a mod-
ified cardiopulmonary bypass (CPB) was installed
without oxygenator, via a single femoral vein access
realized by inserting a venous CPB-cannula in the ani-
mal’s femoral vein. The surface electrodes on the left
arm (LA) and leg (LL) as well as on the right arm
(RA) were attached using sub-dermal steel needle-
electrodes.
After hemi-sternotomy was performed for access,
the cannula prototype was implanted into the LV at
the apex, using an HVAD suture ring, and thus mim-
icking a heart pump implant (see Figure 1). Af-
ter completion of both surgical steps, the thoracic
spreader was removed, and the suprasternal tissue
closed using sutures, while the pericardium was left
Unipolar Amplifier Enabling Measurement of Far-field Intra-cardiac Electromyogram for Blood Pump Control
41
cannula
HVAD
suture
ring
B1
B2
B3
B4
B1
B2
B3
B4
electrode
shield
2 cm
1 cm
lead
passages
1 cm
Figure 1: Cannula featuring four electrodes from pacemaker leads.
open. The thorax was re-opened only if necessary, to
stabilize or resuscitate the animal.
2.3 Unipolar Amplifier
The design of the unipolar amplifier is based on the
approach by Garguilo et al. (Gargiulo et al., 2013;
Gargiulo, 2015). The amplifier was modified to use
only one single common pseudo-infinite reference for
all other channels (see Figure 2). This means, that
also the reference electrode is referenced to itself and
allows for signal recording. The signal is further am-
plified across two amplifier stages.
The goal of the reference signal was to create
a pseudo-infinite potential by low-pass filtering the
signal from the reference electrode. The reference
electrode is filtered using a 2
nd
-order Sallen-Key low
pass filter with a cutoff frequency of 0.034 Hz (47
µF(10%) capacitors and 100 kΩ (1%) resistors). The
resulting high input impedance minimizes crosstalk
with the surface ECG. Both amplifier stages are
grounded through the DAQ, which is also wired to
the right leg surface electrode of the animal.
The first amplifier stage consists of an INA116 in-
strumentation amplifier with a fixed gain, optimized
to provide sufficient common-mode rejection ratio,
while avoiding saturation due to DC offset voltages.
The inverting input is wired to the buffered output
of the pseudo-infinite reference. The measuring elec-
trode connects to a 100 kΩ coupling resistor and then
buffered and forwarded to the non-inverting input of
the INA116. The guard terminal of the non-inverting
input is connected to the shield of the measuring elec-
trode. Of note, the first differential amplifier stage
does not remove high frequency, as the two input sig-
nals are not identical in their noise levels. High fre-
quency noise is reduced by band pass filter.
Between the two amplifier stages we implemented
a high pass followed by a low pass filter. The high
pass attenuates offsets and low frequency drift to
increase to achievable gain in the second amplifier
stage. The high pass was implemented as a first or-
der active high pass with a cutoff frequency of 0.015
Hz (47 µF(10%) capacitors and 220 kΩ(1%) resis-
tors). The low pass was implemented as a 2
nd
-order
Sallen-Key filter 590 Hz to suppress high frequency
noise and attenuate signals close to and above the
Nyquist Frequency (1 kHz)(27 kΩ(1%) resistors and
10 nF(5%) capacitors).
The second amplifier stage (INA128) features
an adjustable gain to adapt to variable electrode
impedances and the unknown value of the iEMG am-
plitude. The inverting input of the second amplifier
stage is wired to ground. The reference terminal is
connected to the inverting input of the signal con-
ditioner, allowing the amplifier to supply signals to
DAQs floating at different levels. If the signal condi-
tioner is a differential type, the inverting DAQ input
is connected to the DAQ ground by the jumper to pro-
vide a reference level. If the signal conditioner is a
single ended type, the jumper is left open, as the sin-
gle ended inverting input provides a ground reference
itself.
The design illustrated in Figure 2 can be scaled to
any number of channels by replicating the circuitry in
the grey box for each channel. The rest of the circuit is
needed once, independent of the number of channels.
2.4 Data Acquisition
All data was acquired using the ACQ 7700 (Data Sci-
ence International, St. Paul, MN, USA). A Windows
machine running the Ponemah software logged the
data at a sampling frequency of 2000 Hz. The in-
BIODEVICES 2021 - 14th International Conference on Biomedical Electronics and Devices
42

output
signal
Ba ery - GND
low pass
f = 0.034 Hz
high pass
f = 0.015 Hz
low pass
f = 590 Hz
ampli
er
ampli
er
electrode
Data
acquisi
on
reference signal
for other channels
bu
er
bu er
control unit
INA116
INA128
Figure 2: Schematic of the unipolar amplifier circuit.
put range of the Universal XE Signal Conditioner and
the Advanced Basic DC4 Signal Conditioners were
set to ±5 V. The Universal XE operated as a differen-
tial signal conditioner and the Advanced Basic DC4
operated in single ended mode. The unipolar ampli-
fier was connected to the Advanced Basic DC4 Signal
conditioner. As Gold Standard surface ECG we used
a Multi-Lead Pod connected to the digital Communi-
cation Module.
2.5 Experimental Protocol
The unipolar amplifier was tested against the gold
standard using (1) an ECG generator (Prosim 8, Fluke
Biomedical, Washington, USA) and (2) in-vivo mea-
surements of surface ECG in four pigs.
The Gold standard records the differentials be-
tween leads denoted as DI, DII and DIII. The unipo-
lar amplifier measures single potentials denoted as left
arm (φ
LA
), left leg (φ
LL
) and right leg (φ
RL
). The dif-
ferential leads (DI, DII, DIII) were reconstructed from
the unipolar ECGs for comparison according to equa-
tions 2,3 and 4.
DI
DII
DIII
LA
LL
RL
Unipolar
ampli
er
DI
DII
DIII
LA
LL
RL
Gold
standard
ECG
simulator
LA
LL
RL
LA
LL
RL
LA
LL
RL
2C
1C
1A
1B
Figure 3: Schematic of the experimental setup.
The first step consisted of three configurations
(see Figure 3): (1A) Unipolar amplifier - ECG simula-
tor; (1B) Gold standard - ECG simulator; (1C) Unipo-
lar amplifier and Gold standard - ECG simulator. In
the second step, the Unipolar amplifier and the Gold
standard ECG amplifier were connected to the surface
electrodes on the LA, LL and RA of each of the pigs
(2C). In the last step, the unipolar amplifier was con-
nected to the four electrodes on the cannula instead
(see Figure 4). Each protocol was repeated four times
and each measurement consisted of 15s of recorded
signal length.
vb
DAQ
Unipolar
ampli
er
Cannula
Figure 4: Connections cannula and unipolar amplifier.
2.6 Data Processing
A median filter of length three samples was used to
smooth the signal. A high pass filter eliminated re-
maining low frequency drifts. The high pass filter
was realized with a minimum order infinite impulse
response filter with a passband frequency of 0.05 Hz
and a stopband frequency of 0.01 Hz. Finally, a 6
th
or-
der notch filter with a center frequency of 50 Hz and
a -3dB bandwidth of 0.5 Hz was implemented and
a low pass filter removed additional high frequency
noise with a cutoff frequency of 250 Hz.
Unipolar Amplifier Enabling Measurement of Far-field Intra-cardiac Electromyogram for Blood Pump Control
43

2.7 Data Analysis
2.7.1 Crosstalk
Crosstalk can occur during simultaneous measure-
ments of surface ECG leads and the iEMG using the
same amplifier. Crosstalk was assessed by comparing
measurements of each amplifier alone (1A, 1B) and
together (1C). Only differential measurements were
compared, computed using equations 2, 3, and 4.
The ECG without crosstalk is denoted as ECG and
the one with possible crosstalk is denoted as
]
ECG.
If no crosstalk is present and noise neglected, then
ECG =
]
ECG holds. The normalized root mean square
error (NRMSE), the DA and the ECG’s signal power
were used as performance indicator (
b
•). The NRMSE
is computed as follows, using the root mean square
(RMS):
\
NRMSE =
RMS(
]
ECG −ECG)
RMS(ECG)
(5)
Furthermore, we compute the error in detecting DA
calculated as relative number according to (equation
6).
\
NDAE =
f
DA − DA
DA
(6)
2.7.2 Comparison Unipolar Amplifier vs. Gold
Standard
The comparison between the unipolar and the gold
standard amplifier was done using the simultaneously
acquired data of both the ECG simulator (1C) and
the in-vivo data (2C). The signal of the gold standard
amplifier served as reference, while the reconstructed
differential leads from the unipolar amplifier ECGs
were compared to it. The same performance indica-
tors as in the previous section were computed, with
minor adjustments as displayed in equations 6 and 7.
\
NRMSE =
RMS(ECG|
UP
− ECG|
GS
)
RMS(ECG|
GS
)
(7)
c
DA =
DA|
UP
DA|
GS
(8)
3 RESULTS
3.1 Crosstalk Quantification
The crosstalk between the unipolar amplifier and the
gold standard amplifier were tested on the ECG sim-
ulator. The values of the performance indicators are
shown in Table 1 for the gold standard amplifier and
in Table 2 for the unipolar amplifier. The
\
NRMSE re-
mained below 2% in all three surface leads. The error
of the estimated DA also remained below 2%. The
sum of the power from 0.05 Hz to 250 Hz remained
constant over the crosstalk test with an error of less
than 5%. We conclude that our amplifier measures
the surface and intra-cardiac potentials independently
from each other. A simultaneous measurement is ad-
vantageous, because we can then report the effect of
changes in LV volume for both the surface ECG as
well as the intra-cardiac iEMG. The surface ECG may
be confounded by a change in distance between the
heart and the chest wall. The unipolar iEMG, how-
ever, should allow for measurement of the Brody ef-
fect.
Table 1: Crosstalk of gold standard.
Gold Standard
\
NRMSE
\
NDAE
Unit [%] [%]
A1-DI 0,37 -0,10
A1-DII 0,67 0,00
A1-DIII 0,52 0,00
A2-DI 0,45 0,15
A2-DII 0,34 0,31
A2-DIII 0,30 -0,10
A3-DI 0,34 0,61
A3-DII 0,41 0,58
A3-DIII 0,45 -0,50
A4-DI 0,43 -0,34
A4-DII 0,31 -0,66
A4-DIII 0,30 0,50
Table 2: Crosstalk of unipolar amplifier.
Unipolar Amplifier
\
NRMSE
\
NDAE
Unit [%] [%]
A1-DI 0,37 0,00
A1-DII 0,34 -0,17
A1-DIII 0,32 1,09
A2-DI 0,72 -0,31
A2-DII 1,54 -1,01
A2-DIII 1,21 0,00
A3-DI 0,39 -0,24
A3-DII 0,34 0,51
A3-DIII 0,33 -1,43
A4-DI 0,35 0,00
A4-DII 0,34 0,00
A4-DIII 0,32 -0,41
BIODEVICES 2021 - 14th International Conference on Biomedical Electronics and Devices
44
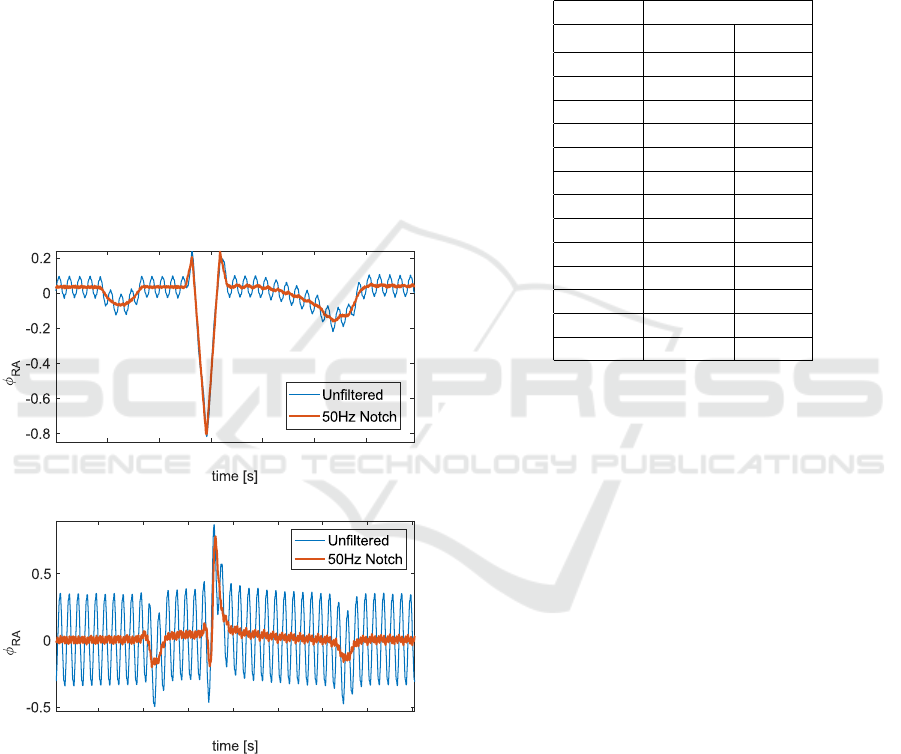
3.2 Performance of 50 Hz Notch Filter
The 50 Hz notch filter was assessed using a single
surface electrode (φ
RA
) measured against the pseudo-
infinite potential (Figure 5). In the top panel, the am-
plifier was wired to the ECG simulator (1C) and in
the bottom panel to the animal (2C). The signal was
filtered with a 6th order notch filter at 50 Hz. The root
mean square error was calculated under the assump-
tion that the filtered signal was the true signal. The re-
sulting RMSE for the signal obtained from the ECG
simulator is 0.04 mV. The error for the in-vivo data
was 0.24 mV, and increased with respect to the value
obtained in the ECG simulator. The 50 Hz notch filter
was critical in obtaining an undisturbed signal. The
large amount of digital equipment in the laboratory
facilities introduced a high amount of noise. We ex-
pect this to be true to a similar extent if such a device
was implemented in the clinical context.
0.0 0.1 0.30.2 0.70.5 0.60.4
[mV]
ECG Simulator
0.0 0.1 0.30.2 0.70.5 0.60.4 0.8
[mV]
In-vivo data
Figure 5: Reduction of 50 Hz noise using notch filter.
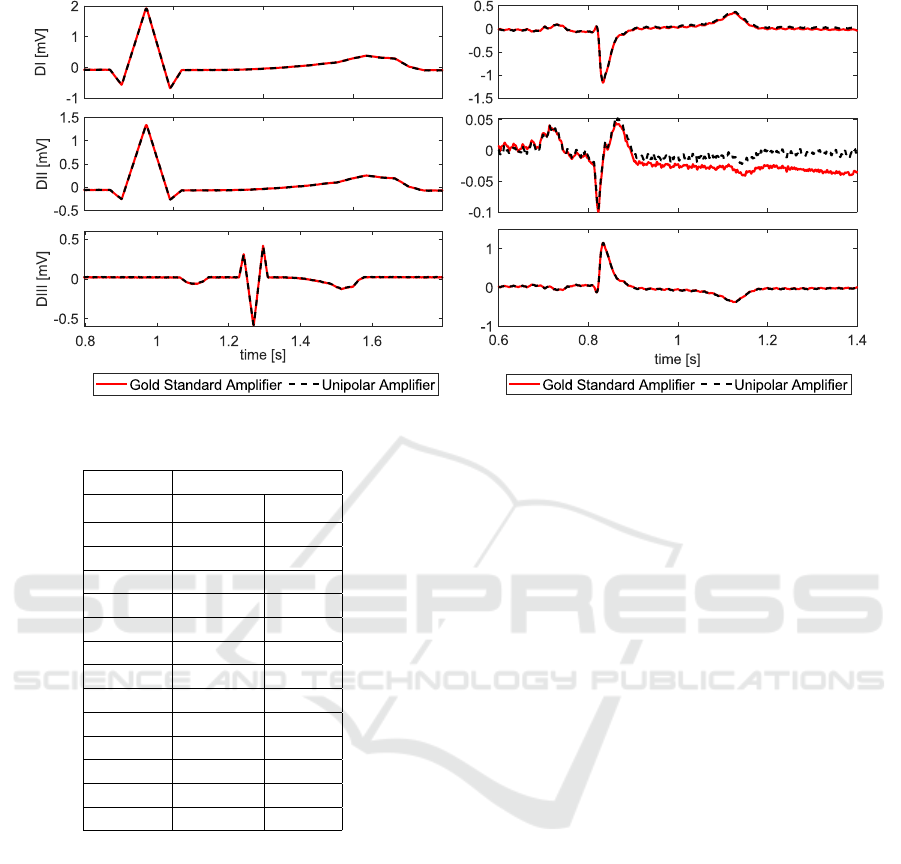
3.3 Comparison of Unipolar Amplifier
vs. Gold Standard
We compare the surface lead ECGs measured by the
unipolar and the gold standard amplifier for both sim-
ulated ECGs (see Table 3) and data obtained in-vivo
(see Table 4). A representative example of a time se-
ries data is shown in Figure 6. While connected to the
ECG simulator, the respective errors are within the
range of what was observed during the crosstalk ex-
periments (Section 3.1). The
\
NRMSE was below 1%
during all tests. The values of the performance indi-
cators
c
DA remained below 1.5%. The unipolar am-
plifier measured the same potentials as the gold stan-
dard, despite relying on a pseudo-infinite potential as
a reference.
Table 3: ECG Simulator Unipolar Amplifier vs. Gold Stan-
dard.
ECGSimulator
\
NRMSE
\
NDAE
Unit: [%] [%]
A1-DI 0,39 0,50
A1-DII 0,52 0,90
A1-DIII 0,43 -0,67
A2-DI 0,40 0,70
A2-DII 0,83 0,12
A2-DIII 0,72 1,44
A3-DI 0,39 0,51
A3-DII 0,35 0,18
A3-DIII 0,32 1,03
A4-DI 0,35 0,70
A4-DII 0,32 0,63
A4-DIII 0,29 0,71
In-vivo, the errors increase as more environmental
disturbances and noise are picked up by the amplifiers
(see Figure 5). The
\
NRMSE of the signal remained
below 5% for 10 out of 12 measurements. The devi-
ations were especially high in Animal 2 (A2), which
also showed a variable heart rhythm. Deviations in
the detection of the DA (
c
DA) were found to be less
than 5% in 9 out of 10 evaluated ECGs. The very
high value for A3-DII originated from an error in the
signal processing of the maximum DA peak detection.
The errors in differential lead DII were mostly higher,
when compared to the DI and DIII lead. It is impor-
tant to note that we report relative error values, such
that the low signal strength of DII results in unfavor-
able error values.
An ideal amplifier has minimal low frequency
drift. In Figure 5 on the right we can see a deviation
of the red signal from the iso-electric line. The sig-
nal measured by the gold standard amplifier is con-
founded by a low frequency drift. In this particu-
lar example, the unipolar amplifier outperformed the
gold standard measurement. Any reported error val-
ues might thus be confounded by low frequency drift
in the gold standard amplifier.
In summary, the accuracy of measuring unipolar
surface leads is accurate enough and the concept of
using a unipolar measurement works.
Unipolar Amplifier Enabling Measurement of Far-field Intra-cardiac Electromyogram for Blood Pump Control
45
ECG Simulator
In-vivo data
Figure 6: Comparison between Gold Standard and Unipolar Amplifier.
Table 4: In-Vivo Unipolar Amplifier vs. Gold Standard.
In-vivo
\
NRMSE
\
NDAE
Unit: [%] [%]
A1-DI - -
A1-DII 0,83 -1,18
A1-DIII - -
A2-DI 5,17 3,46
A2-DII 2,10 2,75
A2-DIII 6,17 1,15
A3-DI 1,81 -0,50
A3-DII 2,59 -92,57
A3-DIII 2,62 2,83
A4-DI 1,31 0,01
A4-DII 1,91 1,93
A4-DIII 0,85 -0,73
3.4 Effect of Post-processing of
Depolarization Amplitude
The effect of post-process filtering is displayed in Fig-
ure 7. We estimated the amount of 50 Hz noise, by
applying an additional 50 Hz filter and calculating the
error between the filtered and the original signal. The
ECG lead II was used for this analysis. In the sur-
face ECG, a 50 Hz noise with amplitude of 0.018 mV
was present with a DA of 0.61 mV (3%). In the iEMG
leads, the 50Hz noise amplitude equals approximately
5% (0.63 mV) of the DA. The noise reduction and the
distortion of the ECG signal and DA due to the fil-
ters is shown in Figure 7. Post-processing of the ac-
quired signals using an additional 50 Notch filter and
a lowpass filter was found to be necessary and feasible
without losing any signal amplitude of the DA.
3.5 Intra-cardiac Electromyogram
All four intra-cardiac electromyograms could be ac-
quired synchronously with one intra-cardiac electrode
chosen as reference. An example of the far-field intra-
cardiac signals obtained in Animal 2 is shown in Fig-
ure 8. The surface ECG shows a normal rhythm in all
three leads DI, DII, and DIII. The recordings between
the four unipolar intra-cardiac electrodes are highly
similar. However, the shape of the iEMG waveform
(B1-B4) is distinctly different compared to the surface
leads (DI-DIII). The R-wave in the surface ECG coin-
cides with the intra-cardiac depolarization amplitude.
Still, the intra-cardiac potentials show another distinct
peak originating from the re-polarization at the end of
the cardiac cycle. The re-polarization is less distinct
in the surface recordings.
3.6 Implications for Blood Pump
Control
The proposed technology constitutes and important
step towards integrated real-time measurement of
EDV for blood pump control. The real-time measure-
ment of LV volume has been attempted previously
using alternative measurement principles. Four ring-
shaped electrodes were integrated into the cannula of
a heart pump to allow for a measurement of electric
impedance (Cysyk et al., 2018). The outer two elec-
trodes span an electric field, while the inner electrodes
record changes in resistance. The technology showed
limited sensitivity, mainly because the measurement
BIODEVICES 2021 - 14th International Conference on Biomedical Electronics and Devices
46
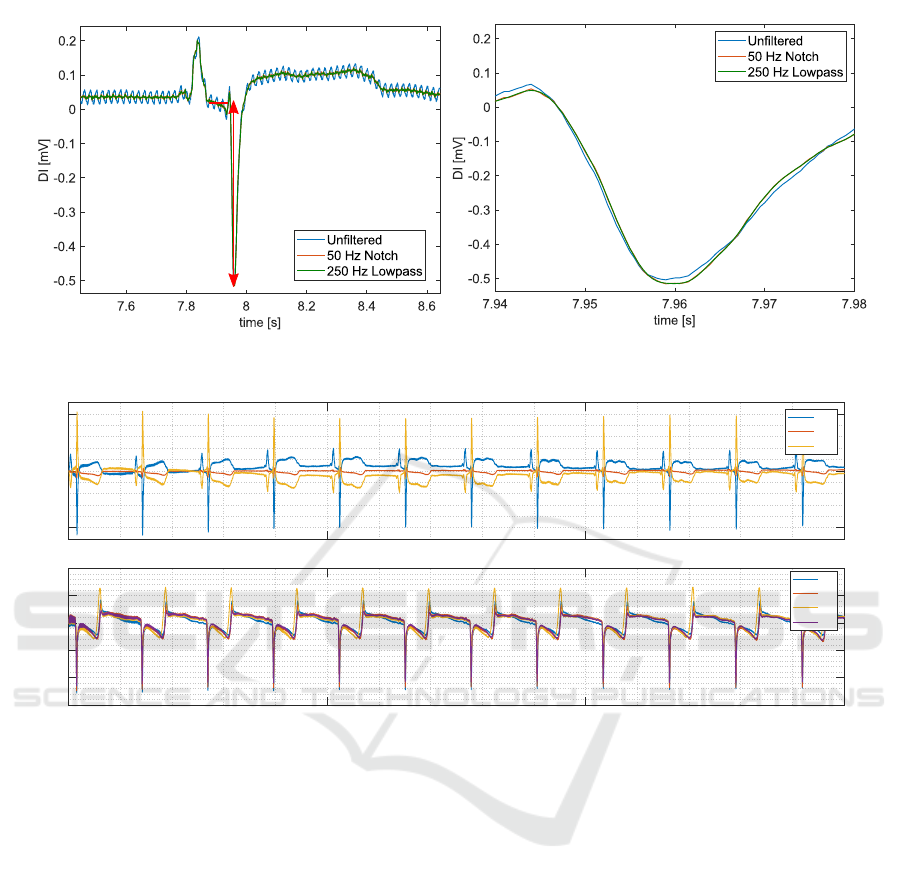
One heart beat
Depolarization
Depolarization amplitude
Figure 7: Effect of filtering on the measurement of the depolarization amplitude.
-0.5
0
0.5
Amplitude [mV]
DI
DII
DIII
0 5 10 15
-15
-10
-5
0
5
10
Amplitude [mv]
B1
B2
B3
B4
Time [s]
Surface Electrocardiogram
Intra-cardiac Electromyogram
Figure 8: Surface (top) and intra-cardiac electromyogram (bottom).
was limited to the blood pool immediately surround-
ing the cannula. The motivation for developing this
unipolar amplifier was to allow for a far-field electric
measurement of the entire LV blood pool. Another
promising approach makes use of electric impedance
measurement across implantable defibrillator leads
(Haines et al., 2017). As most patients with heart fail-
ure have a pacemaker, this could be feasible but would
require communication across devices. Alternatively,
ultrasonic concepts have been proposed and studied
but their applicability remains limited considering the
complexity of integrating such technology in an im-
plantable device (Dual et al., 2019).
Blood pump control requires an accuracy in EDV
of 20% for robust control. As a next step, the unipo-
lar amplifier will be used to study how accurate we
can estimate the EDV from the proposed unipolar
iEMG measurements. Furthermore, the influence of
the hematocrit needs to be carefully assessed. Pro-
vided positive results, the iEMG could enable blood
pump control based on the EDV using established
electrode technology.
4 CONCLUSIONS
We herein present a method to measure the unipo-
lar intra-cardiac electro-myogram using a novel am-
plifier. The design enables accurate detection of the
depolarization amplitude in the intra-cardiac blood
pool and will allow us to investigate the relationship
between iEMG and the EDV (Brody-effect) in the
future. The unipolar amplifier reproduces the gold
standard differential ECG measurements with mini-
mal errors. The unipolar amplifier is thus capable of
measuring electric potentials in a robust and accurate
way. Furthermore, the post-processing methodology
enables the preservation of the peak depolarisation
amplitude, despite significant noise. This technical
work will enable future investigations of the Brody
Unipolar Amplifier Enabling Measurement of Far-field Intra-cardiac Electromyogram for Blood Pump Control
47

effect during changes in left ventricular volume. The
current design is limited by the use of the right leg
of the animal as ground for the data acquisition soft-
ware. Furthermore, the current design of the unipolar
amplifier does not actively isolate the subject from the
DAQ. The performance of a fully portable system will
need to be re-evaluated using a similar experimental
setup as proposed in this paper.
ACKNOWLEDGEMENTS
The authors have no conflict of interest relevant to this
publication. The authors thankfully acknowledge the
financial support by the Georg und Bertha Schwyzer-
Winiker Foundation, the IMG Foundation, as well as
the ETH Zurich Foundation. This work is part of the
Zurich Heart project under the umbrella of Univer-
sity Medicine Zurich. Furthermore,the authors thank
Simon Suendermann, Christoph Starck, Nikola Ce-
sarovic, Mareike Kron and Marko Canic for their sup-
port with the animal study and Sara Mettler for the
electrical engineering support.
REFERENCES
Amoore, J. N. (1985). The brody effect and change of
volume of the heart. Journal of Electrocardiology,
18(1):71–75.
Battler, A., Froelicher, V. F., Gallagher, K. P., Kumada, T.,
McKown, D., Kemper, W. S., and Ross, J. (1980). Ef-
fects of changes in ventricular size on regional and
surface QRS amplitudes in the conscious dog. Circu-
lation, 62(1):174–180.
Brody, D. A. (1956). A Theoretical Analysis of Intracav-
itary Blood Mass Influence on the Heart-Lead Rela-
tionship. Circulation Research, IV:731–737.
Cysyk, J., Newswanger, R., Popjes, E., Pae, W., Jhun, C.-
S., Izer, J., Weiss, W., and Rosenberg, G. (2018).
Cannula Tip With Integrated Volume Sensor for Ro-
tary Blood Pump Control: Early-Stage Development.
ASAIO journal.
Dual, S. A., Ochsner, G., Petrou, A., Amacher, R., Wilhelm,
M., Meboldt, M., and Schmid Daners, M. (2016). R-
Wave Magnitude : a Control Input for Ventricular As-
sist Devices. International Workshop on Biosignal In-
terpretation, Osaka.
Dual, S. A., Zimmermann, J. M., Neuenschwander, J.,
Cohrs, N. H., Solowjowa, N., Stark, W. J., Meboldt,
M., and Schmid Daners, M. (2019). Ultrasonic sensor
concept to fit a ventricular assist device cannula evalu-
ated using geometrically accurate heart phantoms. Ar-
tificial Organs, 43(5):467–477.
Gargiulo, G. D. (2015). True Unipolar ECG Machine for
Wilson Central Terminal Measurements. BioMed Re-
search International, 2015.
Gargiulo, G. D., McEwan, A. L., Bifulco, P., Cesarelli, M.,
Jin, C., Tapson, J., Thiagalingam, A., and Van Schaik,
A. (2013). Towards true unipolar bio-potential record-
ing: A preliminary result for ECG. Physiological
Measurement, 34(1).
Haines, D. E., Wong, W., Canby, R., Jewell, C., Houmsse,
M., Pederson, D., Sugeng, L., Porterfield, J., Kottam,
A., Pearce, J., Valvano, J., Michalek, J., Trevino, A.,
Sagar, S., and Feldman, M. D. (2017). Validation
of a defibrillation lead ventricular volume measure-
ment compared to three-dimensional echocardiogra-
phy. Heart Rhythm, 14(10):1515–1522.
Kirklin, J. K., Xie, R., Cowger, J., de By, T. M., Nakatani,
T., Schueler, S., Taylor, R., Lannon, J., Mohacsi,
P., Gummert, J., Goldstein, D., Caliskan, K., and
Hannan, M. M. (2018). Second annual report from
the ISHLT Mechanically Assisted Circulatory Support
Registry. The Journal of Heart and Lung Transplan-
tation, 37(6):685–691.
Madias, J. E., Song, J., White, C. M., Kalus, J. S., and
Kluger, J. (2005). Response of the ECG to Short-Term
Diuresis in Patients with Heart Failure. Annals of Non-
invasive Electrocardiology, 10(3):288–296.
Ochsner, G., Amacher, R., Wilhelm, M. J., Vandenberghe,
S., Tevaearai, H., Plass, A., Amstutz, A., Falk, V.,
and Schmid Daners, M. (2014). A Physiological Con-
troller for Turbodynamic Ventricular Assist Devices
Based on a Measurement of the Left Ventricular Vol-
ume. Artificial organs, 38(7):527–538.
Ochsner, G., Wilhelm, M. J., Amacher, R., Petrou, A., Ce-
sarovic, N., Staufert, S., R
¨
ohrnbauer, B., Maisano, F.,
Hierold, C., Meboldt, M., and Schmid Daners, M.
(2017). In Vivo Evaluation of Physiologic Control Al-
gorithms for Left Ventricular Assist Devices Based on
Left Ventricular Volume or Pressure. ASAIO Journal,
63(5):568–577.
Petrou, A., Lee, J., Dual, S., Ochsner, G., Meboldt, M.,
and Schmid Daners, M. (2018). Standardized Com-
parison of Selected Physiological Controllers for Ro-
tary Blood Pumps: In Vitro Study. Artificial Organs,
42(3):E29–E42.
Schima, H., Trubel, W., Moritz, A., Wieselthaler, G., Stohr,
H. G., Thoma, H., Losert, U., and Wolner, E. (2008).
Noninvasive Monitoring of Rotary Blood Pumps: Ne-
cessity, Possibilities, and Limitations. Artificial Or-
gans, 16(2):195–202.
van Oosterom, A. (2010). Macroscopic Source Descrip-
tions. In Macfarlane, P., van Oosterom, A., Pahlm,
O., Kligfield, P., Janse, M., and Camm, J., edi-
tors, Comprehensive Electrocardiology, pages 193–
225. Springer Verlag, London, 2011 edition.
BIODEVICES 2021 - 14th International Conference on Biomedical Electronics and Devices
48
