
Web based Object Annotation Tool using a Triplet-ReID Sorting
Approach
Afonso Costa
1,2
, Andr
´
e L. Ferreira
1,2 a
and Jo
˜
ao M. Fernandes
1 b
1
University of Minho, Braga, Portugal
2
Bosch Car Multimedia Portugal S.A., Braga, Portugal
Keywords:
Labelling Tool, Triplet Loss, Object Detection, Computer Vision, Deep Learning.
Abstract:
The robustness of the object detection methods has seen an increasing attention, which leads to a desire for
more control over the training and testing phases. In practice, the need for labelling unique objects present
on a dataset can be of help. However, manually labelling datasets of considerable size can be impractical.
This paper describes an approach to improve labelling information of a dataset by supporting an object re-
identification task. The primary objective is to find repeated objects in the dataset. The proposed solution
relies on a web-based application that allows the user to choose which of the similar objects returned by the
Triplet-ReID method are in fact the same as the query object. The effectiveness of the method was tested on a
dataset with considerable object variability. Experimental results show a viable sorting performance associated
with considerable speed improvement when compared to a traditional labelling approach. In fact, a dataset
with 55 unique objects in a total of 1098 images would take 18 hours with a traditional tool and 12 hours
with proposed one. Moreover, given the generic architecture of the developed framework, it can certainly be
applied to a wide range of use cases.
1 INTRODUCTION
Object detection methods have seen substantial im-
provement over the last few years. In fact, tradi-
tional object detection frameworks which were based
in handcrafted features and shallow architectures
evolved to methods capable of learning high-level
feature representation through deeper architectures.
Alongside the models, the existing object detection
challenges have become more demanding and com-
plex. This change is naturally portrayed in the several
competition datasets, such as PASCAL VOC (Ever-
ingham et al., 2010) (Everingham et al., 2014), Im-
ageNet (Deng et al., 2010), MS COCO (Lin et al.,
2014), and Open Images (Krasin et al., 2017). In
detail, the more recent ones tend to have more im-
ages, more objects per image and a higher degree of
variability in terms of object position, size and place-
ment (Liu et al., 2020). As a result, the newer evalua-
tion process, which belongs to MS COCO, introduced
metrics which account for object localization and a
more detailed overview of the model’s performance
a
https://orcid.org/0000-0002-7028-426X
b
https://orcid.org/0000-0003-1174-1966
using different objects size. As might be expect, all
these changes reward models which perform best on
all the different scenarios and not just in a particu-
lar well-defined use case. Thus, greater importance is
being given to the robustness of the proposed models,
hence highlighting those that can perform effectively
not only in controlled environments, but also in more
difficult and diverse real worlds situations.
In order to achieve that goal, it is important to have
control over the training and testing phases, specially
when it comes to the used objects. In fact, such con-
trol enables a better and accurate understanding of the
performance during the development of an object de-
tection method. In practice, the need for labelling
unique objects in a dataset can be of help in such
circumstances. However, when dealing with datasets
with considerable size the labelling task can be man-
ually impractical.
The primary objective is to label the objects on
a dataset while maintaining trace of their uniqueness,
thus enabling finer control over the objects in the train
and test sets. For instance, increasing the confidence
that the train and test are disjoint sets or excluding
objects in certain configurations.
Costa, A., Ferreira, A. and Fernandes, J.
Web based Object Annotation Tool using a Triplet-ReID Sorting Approach.
DOI: 10.5220/0010253102790286
In Proceedings of the 10th International Conference on Pattern Recognition Applications and Methods (ICPRAM 2021), pages 279-286
ISBN: 978-989-758-486-2
Copyright
c
2021 by SCITEPRESS – Science and Technology Publications, Lda. All rights reserved
279

The existing labelling tools are not suited for the
use case in question since they all demand the user to
transverse every single unlabelled objects each time
the labelling occurs for a specific object, which is a
clearly not optimised workflow that can even make
the process unfeasible.
The present work has the goal of developing a new
tool that improves such workflow by minimizing the
time needed to label the objects of a given dataset.
Therefore, this paper contribution consists of a web-
based tool which uses the Triplet-ReID deep learning
model (Hermans et al., 2017) to sort the unlabelled
objects in relation to a query object so that similar
ones appear first. Thus, reducing the need to iterate
the entire dataset every time.
The applicability of the tool was tested on a real
dataset with considerable object variability, both in
terms of lighting and perspective. Additionally, a time
consumption comparison between the optimised and
manual approaches was conducted in order to access
the viability of the solution.
The remainder of this paper is organised as fol-
lows. Next section gives background and discusses
related work. Section 3 presents the architecture,
modules and functionality of the developed labelling
tool. Section 4 discusses the evaluation process and
results. Finally, conclusions are presented in Section
5.
2 BACKGROUND AND RELATED
WORK
2.1 Existing Labelling Tools
There is a high variety of existing labelling tools, for
instance, the LabelMe (Russell et al., 2008), Image
Labeler App, RectLabel (R. Kawamura, 2020), and
LabelImg (Tzutalin, ). They all mainly focus on la-
belling (e.g. segmentation or bounding box annota-
tions) one image at a time. Being the goal to label
every object image with a given ID, analysing them
repeatedly one by one leads to a cumbersome work-
flow. Additionally, since the images the not appear in
any useful order, the user needs to iterate every sin-
gle image when labelling each of the existing unique
objects.
2.2 Object Re-identification
The task of object re-identification (re-ID) can be de-
scribe as seeking the occurrences of a query object
in a set of candidate objects (gallery). The research
in this field has not been very active. In contrast,
the person re-identification subtask has attracted in-
creasing attention in recent years mainly due to the
automated video surveillance practical applications
(Mathur et al., 2020). Naturally, this research area
can be seen as a particular use case of the object re-
identification task as a whole, thus enabling several
solutions to also be used in the later task.
The person re-ID task matches people across a
monitoring system of multiple non-overlapping cam-
eras. In practice, given a query image the goal is to
found in the gallery those in which the same person
appears.
Before 2014, the existing approaches commonly
used hand-designed features to represent and match
the identity of different objects. The features can be
mainly separated in colour based and texture based
features, ranging widely from HSV colour histogram
(Li and Wang, 2013) (Farenzena et al., 2010), LAB
colour histogram (Zhao et al., 2013), SIFT (Zhao
et al., 2013), LBP histogram (Li and Wang, 2013),
HOG features (Li and Wang, 2013) and Gabor fea-
tures (Li and Wang, 2013). After the feature extrac-
tion process, most models use a simple standard dis-
tance measure (e.g. l
1
-norm, l
2
-norm, Bahattacharyya
distance) to evaluate the matching performance be-
tween the query and gallery images.
As might be expected, in realistic conditions the
person’s appearance usually undergoes dramatic vi-
sual changes regarding the view angle, resolution,
lighting, background clutter and occlusion. Conse-
quently, it becomes challenging to achieve high per-
formance results using handmade feature-based tech-
niques. Additionally, depending on the images con-
ditions, usually there is a subset of features that bet-
ter represent the identity of the given person. How-
ever, the distance measures mentioned above give the
same weight to every feature on every use case thus
potentially harming the overall method performance.
In 2011 papers such as Dikmen et al. (Dikmen et al.,
) and Zheng et al. (Zheng et al., 2011) addressed the
aforementioned problems by viewing the person re-
identification as a distance learning problem. As a re-
sult, the goal shifts from extracting robust appearance
features in order to better represent the identity of an
individual to learning the optimal distance that max-
imises the matching accuracy regardless the choice of
features. The end goal is to maximise the probability
of true matching pairs having a smaller distance than
two images of different individuals. Nowadays, this is
still an active approach (Hermans et al., 2017) (Wojke
and Bewley, 2018) (Yang et al., 2019).
From 2014 onwards, the person re-identification
field became increasingly popular and has seen great
ICPRAM 2021 - 10th International Conference on Pattern Recognition Applications and Methods
280
improvement, mostly due to the deep learning break-
through. In practice, the methods went from hand-
designed features to automatic feature extraction,
which opened the field to new possibilities. Yi et al.
(Yi et al., 2014) was one of the first papers to apply
a deep learning model to the person re-identification
problem. The paper proposed a deep metric learn-
ing method by using a Siamese convolutional neural
network, which allowed the transition from the pre-
viously mentioned hand-crafted features and discrete
workflow to jointly learning features and metrics in a
unified framework.
Currently, most person re-identification models
tend to use very specific features such as human body
part segmentation (Quan et al., 2019) and spatial-
temporal information (Wang et al., 2018) to improve-
ment the models performance. However, these mod-
ules make the techniques unsuitable for the object re-
identification task in hands, since there is no temporal
information and the objects do not always have a hu-
man body shape.
3 TOOL
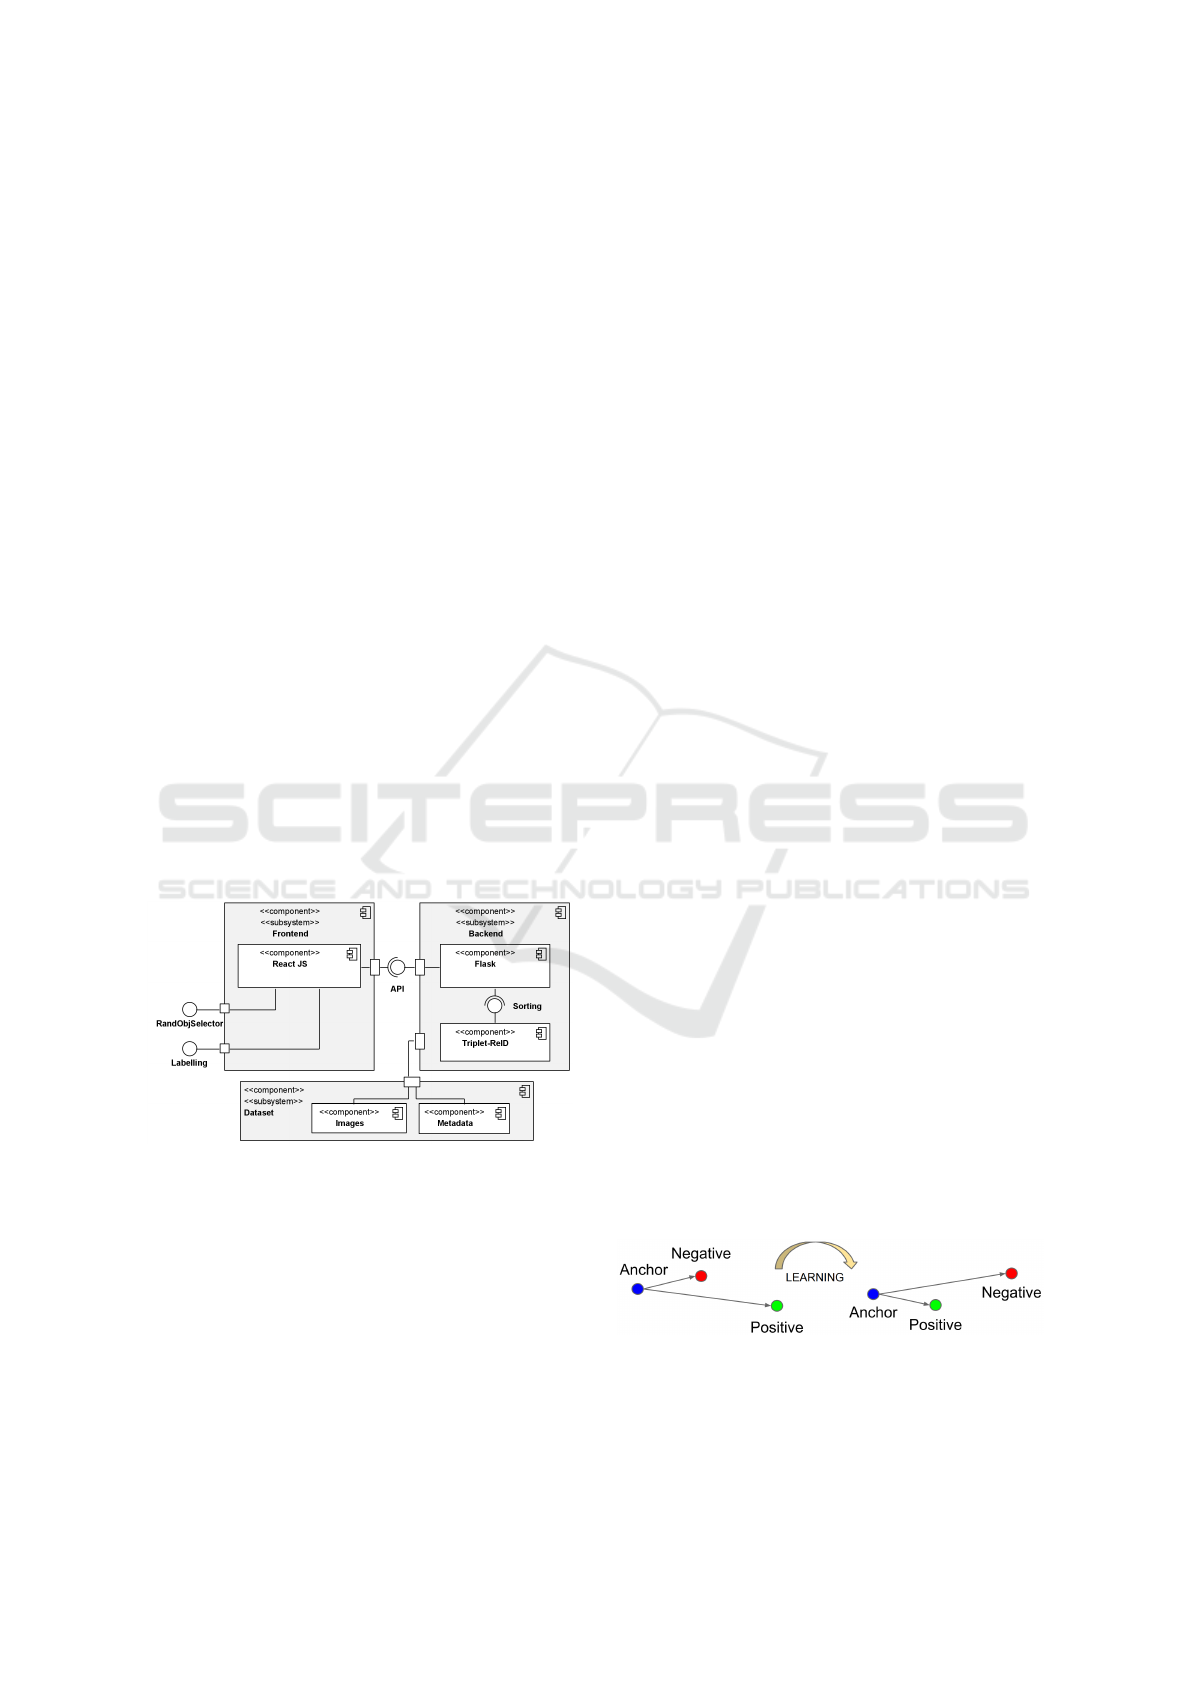
The Figure 1 describes the architecture of the la-
belling tool. In detail, it encompasses four main
components such as the objects dataset, Triplet-ReID
module, Flask web framework, and React JavaScript
library.
Figure 1: Tool architecture.
Firstly, the objects dataset component represents
the directory in which one can find the images as well
as the metadata associated to each object. The tool
allows one image to have multiple objects. In this
case, the metadata must specify each object bound-
ing box, thus enabling their extraction for future pro-
cessing, for instance by the Triplet-ReID module. All
the information needed to represent the dataset can be
defined in a configuration file, which decouples the
dataset from the actual tool implementation, hence in-
creasing the applicability of the tool.
Secondly, there is the backend which includes the
Triplet-ReID python module and Flask. The former
is a Triplet-ReID person re-identification model that
is imported by Flask and used to sort the results of a
given object query. The later is the bridge between
all the tool components. Through a REST API, it re-
ceives HTTP requests sent by the frontend component
and updates its internal state accordingly. In detail,
it reads and updates the dataset as the labelling pro-
cess is fulfilled, while also managing the state of the
Triplet-ReID embedding space throughout it’s lifes-
pan (initialisation, populate, update, and queries).
Finally, the frontend uses the React JS library in
conjunction with the React Bootstrap framework. The
later allows for a fast development process since most
of the components already exist. Moreover, by us-
ing pre-existing components and a minimalist inter-
face the user experience becomes familiar and more
fluid.
3.1 Triplet-ReID Module
The Triplet-ReID module is used as a sorting algo-
rithm, hence presenting the more similar unlabelled
objects first.
The module mainly uses a ResNet-50 architecture
with the last layer replaced with two fully connected
layers that generate an output of 128 units, which is
the final embedding dimension. The training batch
encompasses PK images of randomly sampled K in-
stances of randomly sampled P objects. In all experi-
ments, both K and P are set to their default values, 4
and 32 respectively. Afterwards, the batch images are
used to generate the training triplets which are a three-
fold of the current object instance being processed,
the hardest positive (more different instance of the
same object) and the hardest negative (more similar
instance of a different object) within the PK subset.
The triplets are then used to compute the Batch Hard
loss. As portrayed in the Figure 2, the module uses
the Batch Hard loss to project the objects in an embed-
ding space where, eventually, all instances of the same
object are closer to each other (lower Euclidean dis-
tance) than any instance of a different object (higher
Euclidean distance).
Figure 2: Triplet loss learning workflow. Source: (Schroff
et al., 2015).
In practice, in order to sort the unlabelled objects,
one needs to project them to the embedding space.
Web based Object Annotation Tool using a Triplet-ReID Sorting Approach
281
Later, an object can be used as query and the module
returns the unlabelled objects sorted by similarity.
3.2 Functionality / Workflow
The labelling workflow starts with the random se-
lection of an unlabelled object, in other words, the
query object. The random approach allows the user to
quickly iterate through the dataset and label an object
of their choice. After selecting the object, the remain-
der of the dataset is sorted with the Triplet-ReID mod-
ule, hence based on the similarity to the query object.
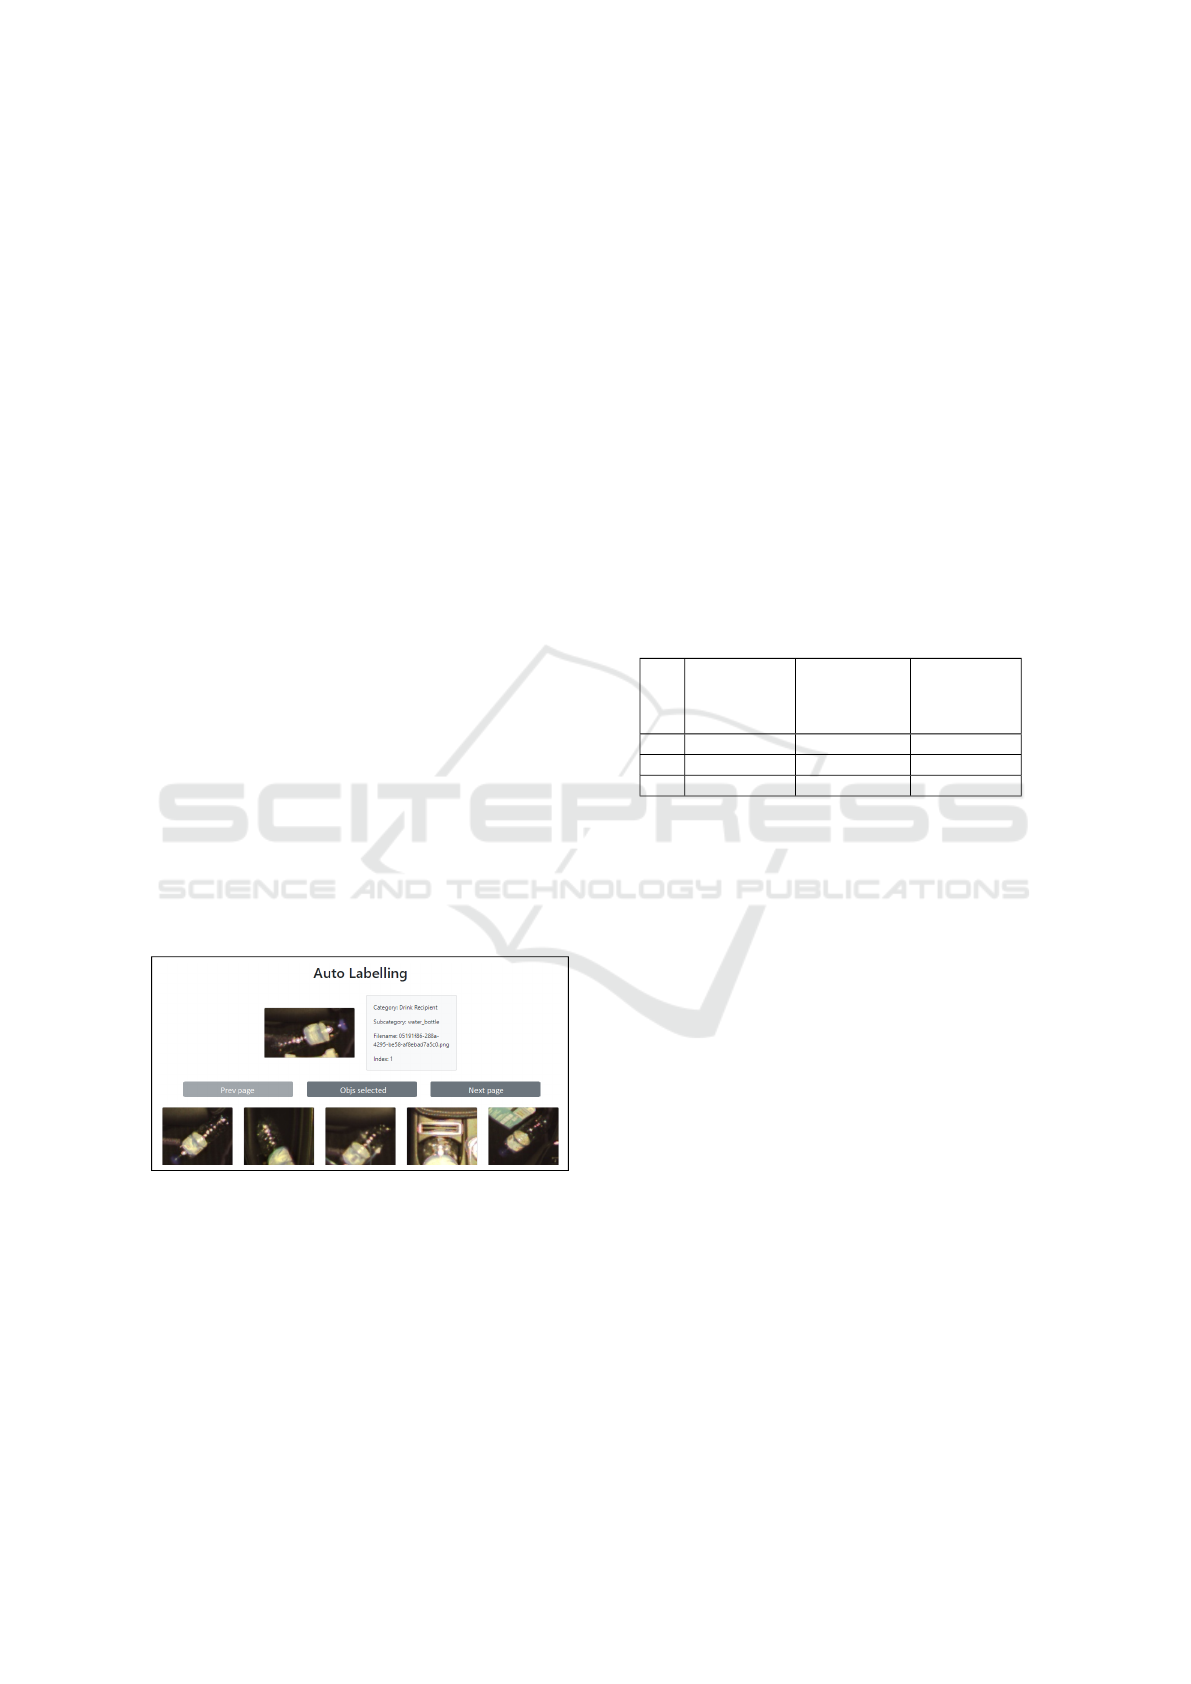
The Figure 3 shows the default view when engaging
in the labelling process. In the top of page the user
can visualise the query object, alongside some meta-
data, so it has a reference of the object that its trying
to identify. Afterwards, there is two buttons respon-
sible for navigating backward (‘Prev page’) and for-
ward (‘Next page’) in the results list. The third button
opens a popup dialog with a list of the selected objects
so far, where one can remove an object of the selected
list just by clicking on it and finish the labelling pro-
cess by clicking ‘Save Changes’. Finally, back in the
default viewing page one can find the list of proposed
unlabelled objects. By default the list presents ten ob-
jects at once. The task is to select the images where
the query object appears. When doing the selection
process the selected objects are replaced by the next
object on the list without forcing the user to move to
the next page, hence reducing the friction in the pro-
cess since new objects are automatically appearing on
the screen.
Figure 3: Layout of the page where the labelling process
occurs.
Depending on the object dataset in question, it can
be hard to visually understand the object depending
on its enviroment (e.g. low light and occlusion). To
this end, there is an option to further inspect an object
image at any given point. By using the control key
and the mouse left click combination, the user has ac-
cess to the full image where the object is placed. In
detail, it is possible to zoom over any specific point of
the image. Moreover, it is possible to re-query with
an specific object by using the alt key and left mouse
click combination. In some specific cases this feature
might be useful since re-querying can re-rank the un-
labelled objects in a more useful order.
In the end, after having all objects selected the la-
belling process can actually be completed with the
aforementioned ”Save Changes” button, which redi-
rects the user to the random object selection page,
restarting the process all over again.
4 EXPERIMENTAL RESULTS
The Table 1 summarises the three datasets, namely
A, B and C, used in the experiments with the Triplet-
ReID model. All objects were cropped out using their
bounding box annotations and none was discarded.
Table 1: Metadata describing the datasets used for training
and testing the Triplet-ReID model.
Dataset
Total objs
(unique IDs)
Training objs
(unique IDs)
Testing objs
(unique IDs)
A 2451 (96) 1963 (96) 488 (93)
B 2451 (96) 2231 (83) 220 (13)
C 3684 (145) 2586 (90) 1098 (55)
Firstly, the A and B datasets were generated based
on the same collection of objects. The splitting pro-
cess used to get the train and test sets are the main
difference between the two. The former was accom-
plished by iterating through every object ID and tak-
ing 90% of the object instances for training and the
remaining 10% for testing. As might be expected, de-
spite having different instances of the same object on
the training and testing dataset, the same object ap-
pears in both sets, which hinders a proper analyses on
the generalisation and robustness of the model. Con-
sequently, in order to evaluate the aforementioned im-
pact, the dataset B uses a default splitting technique,
thus splitting the dataset so the set of object IDs in
the train and test datasets are disjoint. The C dataset
uses the B dataset splitting technique with 70% of the
objects going for training and 30% for testing. Fur-
thermore, the C dataset is the union of all the objects
present in the B dataset and some novelty ones.
In order to get an accurate understanding of the
tool performance, the object instances present in the
datasets have high variability, which ultimately in-
creases the difficulty of the sorting task. The Figure 4
shows that variability occurs in terms of size, perspec-
tive, light and colour. Furthermore, there are some
cases where the object instances are blurry due to low
image quality and some are extremely occluded by
random components.
ICPRAM 2021 - 10th International Conference on Pattern Recognition Applications and Methods
282
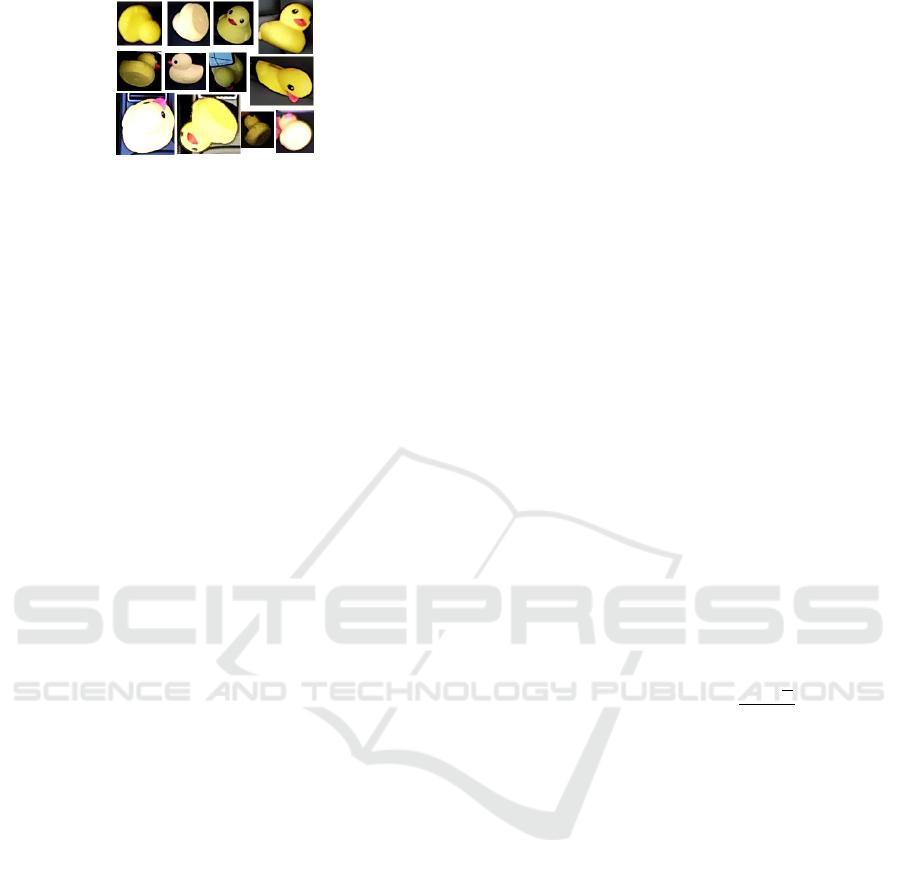
Figure 4: Example of variability within the same object.
Overall, the datasets include objects with high
variability obtained in a real world use case, which
allows an evaluation of performance of the labelling
tool in a realistic environment.
4.1 Evaluation Metrics
The evaluation encompass two different perspectives
of the tool: the labelling time and the sorting quality
of the unlabelled objects.
On the one hand, the labelling time will be evalu-
ated by comparing the same tool with and without the
objects sorted by the Triplet-ReID model. Hence, get-
ting a sense of the impact that the sorting can have in
the labelling process. In detail, the random approach
can be formulated using the following equation:
t
r
=
N
∑
i=0
(T − M ∗ i) ∗α (1)
where for each N unique objects, the user labels
the existing M repetitions by spending α seconds
analysing each remaining image in order to decide if it
is the query object or not. This process is looped until
the user labels all T images in the dataset. It should be
highlighted that the equation assumes that all unique
objects have the same number of repetitions.
The sorted approach can be approximated by the
following equation:
t
s
= N ∗ (M + E +C) ∗ α (2)
where for each N unique objects, the user labels
the existing M repetitions by spending α seconds
analysing each remaining image in order to decide if
it is the query object or not. However, as the model is
not capable of placing all matching objects in the first
M positions of the results, the E value is the overhead
needed to encompass this factor. For instance, if there
are 5 matching objects and the overhead is 10, then
within the first 15 positions, the user can find the 5
matching results. Additionally, the C constant repre-
sents an interval where a matching object does not ap-
pear. Normally, this value is equivalent to two pages
of objects (20 objects) where no match appears. Af-
terwards, the formulation assumes that the user saves
the existing selected objects and proceeds to the next
query.
On the other hand, there is the unlabelled objects
sorting performance. The Triplet-ReID method pro-
poses a Cumulative Matching Characteristics (CMC)
metric (Bolle et al., 2005), which is very popular for
person re-identification methods. However, the afore-
mentioned metric does not portrait well the sorting
performance since the goal is not to evaluate how
soon a correct object appears in the ranking but how
much are placed in the early positions of the ranking.
In order to solve the previous issue, the CMC met-
ric was replaced to encompass the new perspective
in which the model is being used. To this end, three
new metrics were introduced: mean average precision
(mAP), Rank-K accuracy and average distance (AD).
Firstly, the area under the Precision-Recall curve
is used to compute the average precision (AP) of each
querying object. Afterwards, the mean of all AP val-
ues produces the mAP metric. (Zheng et al., 2015)
In practice, a lower mAP value means that the user
needs to cycle through more objects than it needs to
label all instances of an object. In contrast, a perfect
mAP would mean that the user only needs to iterate
the exact number of correct objects to label them all.
Secondly, the Rank-K accuracy is the result of av-
eraging the division of the correct objects (c) by the
first K positions of the sorted objects. Therefore, the
Rank-K accuracy metric can be summarised as:
Rank-K accuracy =
∑
N
i=1
c
K
N
(3)
For instance, if one is trying to label an object with
100 unlabelled instances, a lower Rank-100 accuracy
means that a low number of those instances are within
the first 100 positions. In contrast, a higher Rank-
100 accuracy portraits a sorting order where a higher
number of correct objects are within the first 100 po-
sitions.
Lastly, there is the AD which directly portraits
the average distance between the correct objects po-
sitions after being sorted. For instance, a AD of 2.5
for a given query object means that the unlabelled in-
stances of such object have an average distance of 2.5
objects between them. In other words, a lower AD
results in correct objects being closer to one another
and a higher AD the opposite. Ideally, one wants an
AD below two pages of objects so that correct objects
are continuously seen throughout the labelling, which
results in a more fluid experience.
Web based Object Annotation Tool using a Triplet-ReID Sorting Approach
283
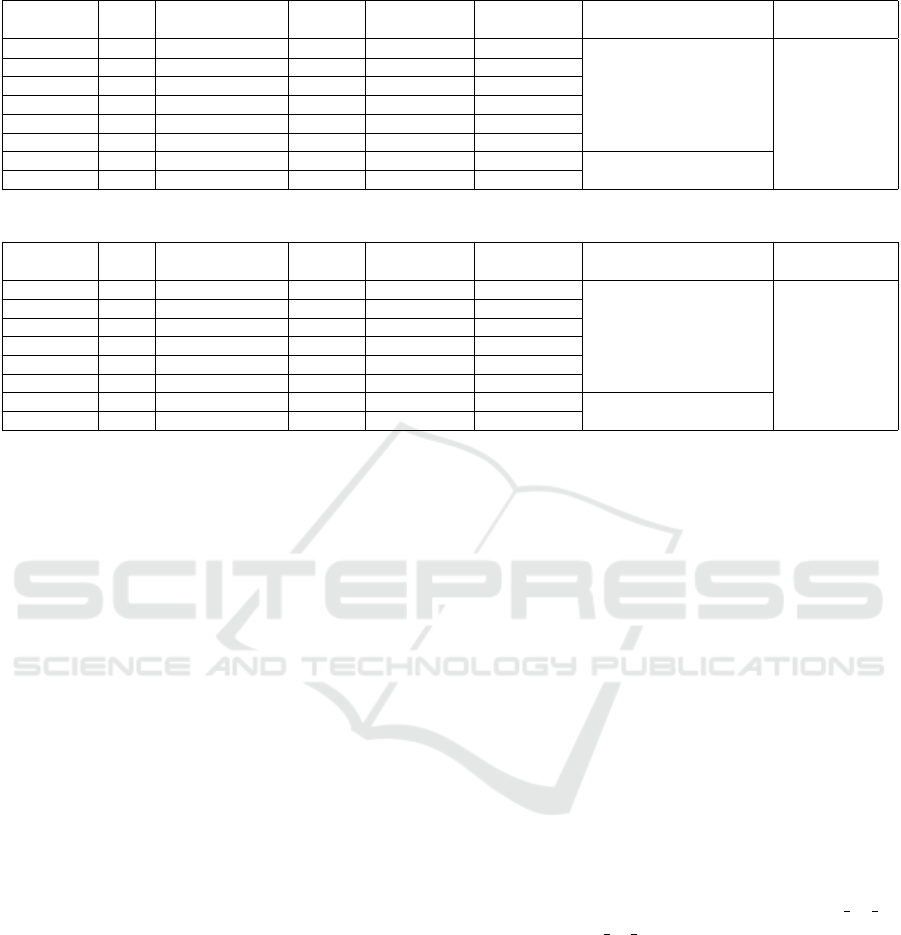
Table 2: Experiments with A dataset.
Experiment
name
mAP
(%)
Rank-K accuracy
(%)
AD
(objects)
Train
augmentation
Embedding
augmentation
Net Head
EA3 88.77 84.52 1.5784 flip -
ResNet50 v1
(pre-trained on ImageNet) Fully connected
(1024x1024)
EA5 88.91 84.20 2.5468 flip+crop -
EA6 88.36 84.25 2.3895 - flip
EA7 90.78 88.05 3.1601 - crop
EA9 86.78 81.83 1.8556 flip flip
EA12 89.51 85.72 2.3761 flip+crop flip+crop
EA15 88.38 84.74 3.1141 flip+crop flip+crop ResNet101 v1
(pre-trained on ImageNet)EA16 90.95 88 1.8446 flip flip
Table 3: Experiments with B dataset.
Experiment
name
mAP
(%)
Rank-K accuracy
(%)
AD
(objects)
Train
augmentation
Embedding
augmentation
Net Head
EB3 82.52 76.52 5.9809 flip -
ResNet50 v1
(pre-trained on ImageNet) Fully connected
(1024x1024)
EB5 79.26 73.01 5.4948 flip+crop -
EB6 81.94 75.92 4.5859 - flip
EB7 86.08 80.86 4.3681 - crop
EB9 79.75 73.60 6.0326 flip flip
EB12 78.00 71.90 5.2936 flip+crop flip+crop
EB15 79.04 72.67 5.8664 flip+crop flip+crop ResNet101 v1
(pre-trained on ImageNet)EB16 82.11 75.37 4.9387 flip flip
4.2 Results
Analysing the time consumption metrics in a more
practical point of view, the random approach (Eq. 1)
enforces the user to transverse every remaining object
image for each query object. In contrast, the sorted
version (Eq. 2) puts the control on the user so he can
stop earlier. Consequently, depending on the dataset
one approach can be better than the other. There-
fore, if the dataset has few unique objects (N) but each
with a high number of repetitions than the random ap-
proach can actually be better. Whereas, if the dataset
has a higher number of unique objects and each with a
low number of repetitions than the sorted version can
achieve better results, hence a faster labelling process.
An analyses was performed by using fictitious
datasets FB and FC which are lightly based on the
B and C dataset, respectively. The FB dataset can be
describe with the following values: T = 220, N = 13,
M = 16, C = 20, E = 32, and α = 2. Similarly,
the FC dataset is defined by the following constants:
T = 1098, N = 55, M = 19, C = 20, E = 357, and α
= 2.
When using the FB dataset, the random approach
(t
r
) would take about 54 minutes to complete the la-
belling. Meanwhile, the sorted approach (t
s
) would
take only about 30 minutes. Furthermore, when sim-
ulating with a bigger dataset such as the FC the t
r
time
increases significantly reaching the 18 hours while the
t
s
time would stay at about 12 hours. Naturally, bigger
datasets yield larger differences, making the random
approach quickly unfeasible in a business context.
Regarding the Triplet-ReID module, the same ex-
periments were performed with each of the three pre-
viously mentioned datasets. In detail, each experi-
ment started by training the model with the appro-
priate images of each dataset on a set of parame-
ters, such as the network architecture, the use of pre-
trained weights and crop/flip augmentations. The rest
of the parameters remained with their default values
as changing them did not improved the model perfor-
mance. Next, the trained model is used to project the
test images to an embedding space. As in training,
the embedding stage enables crop and flip augmenta-
tions as well. Lastly, the evaluation phase computes
the mAP, Rank-K accuracy and AD metrics by query-
ing all the test images over the populated embedding
space.
The Table 2 shows the results yield by the A
dataset. The highest performance increase is due
to the use of the pretrained weights. In contrast,
there is no meaningful performance difference be-
tween the experiments done with the resnet v1 50
and the resnet v1 101 networks. The best results
were achieved with the EA7 experiment with a mAP
of 90.78%, Rank-K accuracy of 88.05% and AD of
3.1601, and the EA16 experiment with a mAP of
90.95%, Rank-K accuracy of 88% and an AD of
1,8446.
The same experiments were conducted using the
B dataset and the results are reported in Table 3. The
best results were achieved in the EB3 and EB7 ex-
periments. The main difference between the EB and
EA set of experiments is the splitting algorithm used
to separate the training and testing data. As might be
expected, all metrics decreased. The main reason is
ICPRAM 2021 - 10th International Conference on Pattern Recognition Applications and Methods
284
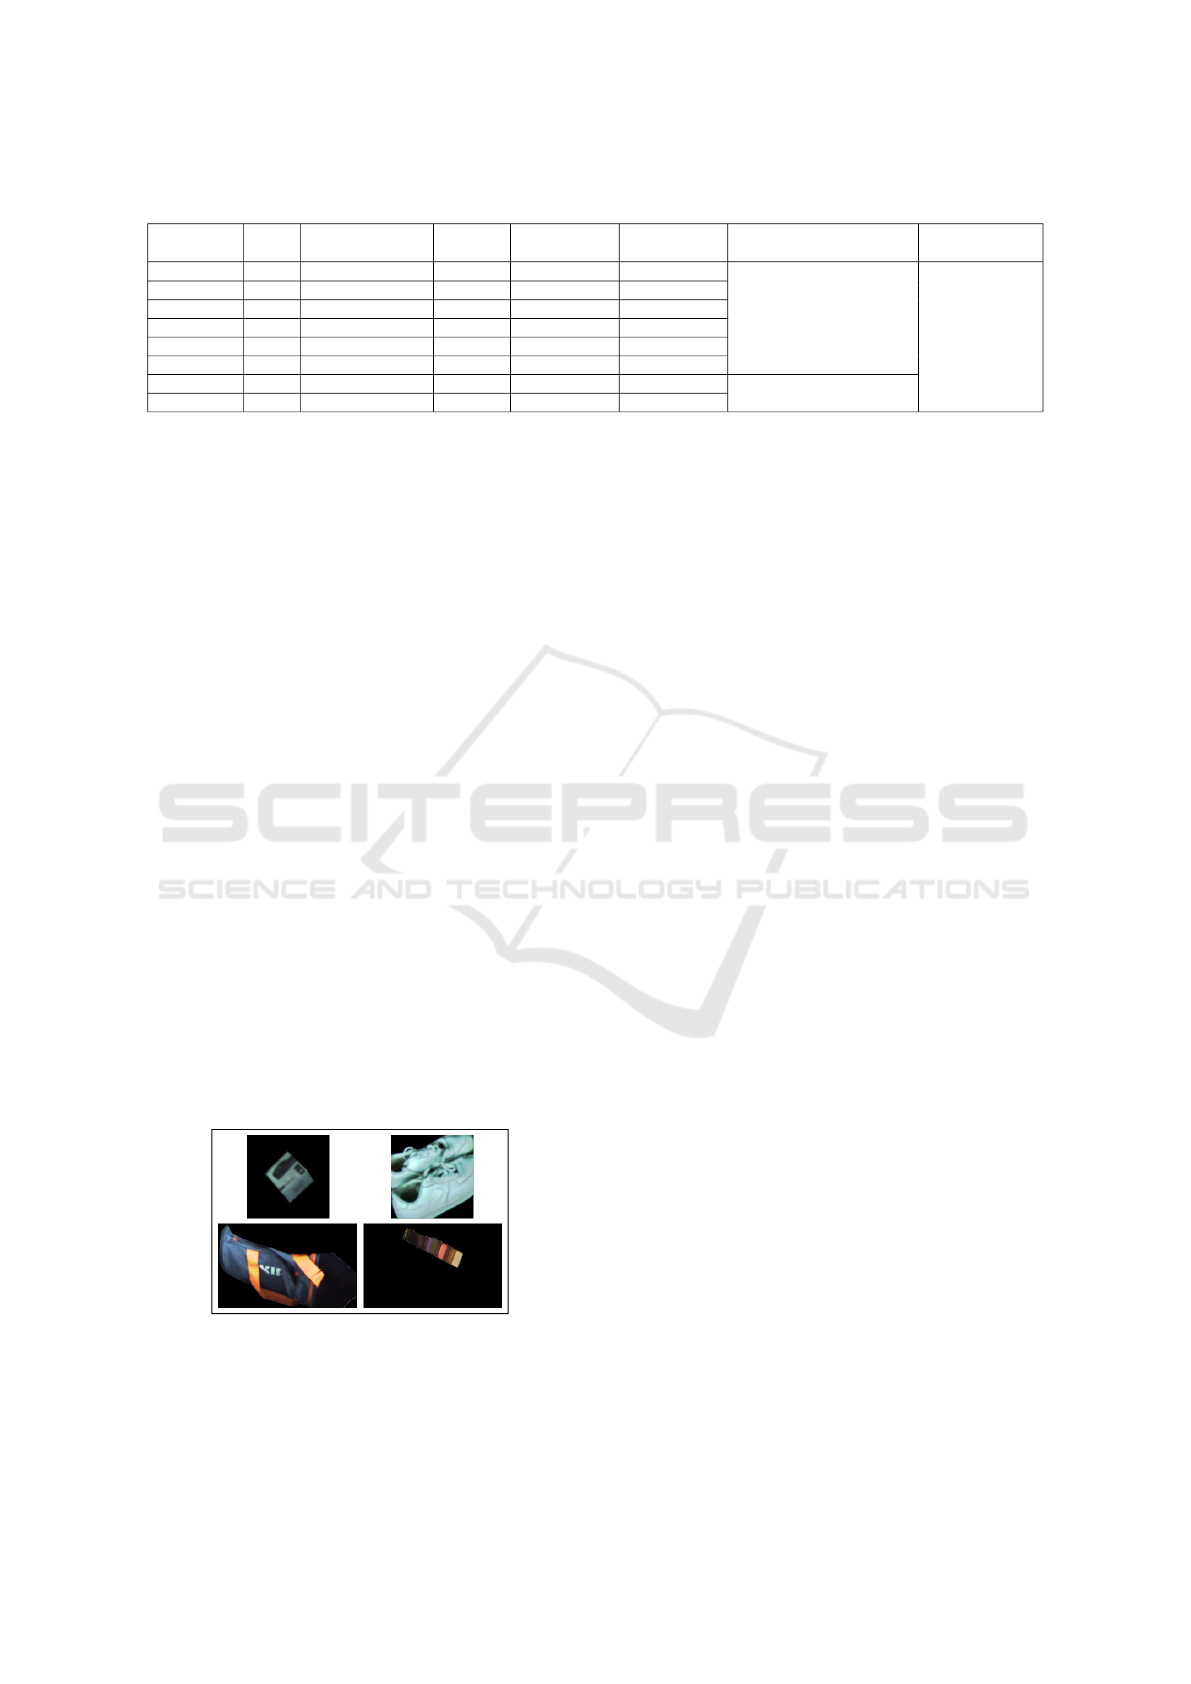
Table 4: Experiments with C dataset.
Experiment
name
mAP
(%)
Rank-K accuracy
(%)
AD
(objects)
Train
augmentation
Embedding
augmentation
Net Head
EC3 45.01 43.07 20.1552 flip -
ResNet50 v1
(pre-trained on ImageNet) Fully connected
(1024x1024)
EC5 44.62 42.57 20.7063 flip+crop -
EC6 49.27 45.91 16.855 - flip
EC7 45.81 43.54 21.3495 - crop
EC9 48.66 45.79 17.9821 flip flip
EC12 46.50 44.06 20.072 flip+crop flip+crop
EC15 47.01 44.36 19.4776 flip+crop flip+crop ResNet101 v1
(pre-trained on ImageNet)EC16 50.82 47.47 15.7853 flip flip
the novelty of the testing objects used as the model
had never seen them. The 7.97% decrease in mAP,
10.18% decrease in Rank-K accuracy and the increase
of 2.9620 objects in the AD metric show that the cor-
rect objects are further away from the first positions
as well as more distant from each other.
The results of the experiments with the C dataset
are reported in the Table 4. The main difference is
the significant lower metric values, with a decrease of
33.88% in mAP, 30.39% in Rank-K accuracy, and an
increase of 13.7278 objects in AD. Despite, the goal
of generating a more discriminative model through
using more training samples, the performance im-
pact suggests that the new objects added to the C
dataset are in fact harder to distinguish, thus result-
ing in lower metrics overall.
Lastly, after querying the system with a variety of
objects, one can notice a pattern regarding the real
size of the objects. In fact, all objects are cropped
by their bounding box and resized to height of 256
pixels and a width of 128 pixels. Consequently, it be-
comes impossible to compare their actual size since
objects with major size differences can fill the same
percentage of the final image. As a result, objects
which have a similar appearance but a noticeable size
difference are usually challenging for the system to
distinguish. Figure 5 shows some practical examples
were the problem appears.
Figure 5: Examples were the size problem is evident. The
first column shows a query object and the second column
shows an object that appears within the first 10 positions of
the results.
5 CONCLUSION
Due to the importance of the robustness in object de-
tection models, having control over the objects in both
the training and testing phase is crucial. The identifi-
cation of all unique objects using existing labelling
tools becomes an inefficient workflow since they only
allow the analyses of one image at once, which could
even make the labelling process unfeasible in large
datasets.
This paper proposes a web based tool coupled
with the Triplet-ReID model to improve the labelling
process. The addition of the machine learning module
allows the sorting of unlabelled objects by similarity.
Furthermore, being a web-based application enables
its deployment locally or on external servers, hence
allowing for both private and crowdsourced labelling
strategies.
The experiments demonstrate the viability of the
solution both in terms of sorting performance and la-
belling time when compared to a random approach,
specially when using a dataset of with high number of
different objects and each with a low number of rep-
etitions. Moreover, given the generic architecture of
the developed framework, it can certainly be applied
to a wide range of use cases.
As future work, the experiments should be repli-
cated with larger datasets as the size of the ones used
can influence the reported results. Also, the addition
of visual attention learning mechanism to re-weight
the learned feature maps will be explored to access
their impact on the objects similarity sorting perfor-
mance (Li et al., 2018) (Song et al., 2018) (Si et al.,
2018) (Chen et al., 2020). Moreover, several tech-
niques to maintain the scale between objects will be
experimented in order to make their size a valuable
feature on the object re-identification task.
Web based Object Annotation Tool using a Triplet-ReID Sorting Approach
285

ACKNOWLEDGEMENTS
This work is supported by: European Structural
and Investment Funds in the FEDER component,
through the Operational Competitiveness and Interna-
tionalization Programme (COMPETE 2020) [Project
n
o
039334; Funding Reference: POCI-01-0247-
FEDER-039334].
REFERENCES
Bolle, R. M., Connell, J. H., Pankanti, S., Ratha, N. K., and
Senior, A. W. (2005). The Relation Between the ROC
Curve and the CMC. Technical report.
Chen, Y., Wang, H., Sun, X., Fan, B., and Tang, C. (2020).
Deep Attention Aware Feature Learning for Person
Re-Identification.
Deng, J., Dong, W., Socher, R., Li, L.-J., Kai Li, and Li
Fei-Fei (2010). ImageNet: A large-scale hierarchical
image database. pages 248–255. Institute of Electrical
and Electronics Engineers (IEEE).
Dikmen, M., Akbas, E., Huang, T. S., and Ahuja, N. Pedes-
trian Recognition with a Learned Metric. Technical
report.
Everingham, M., Eslami, S. M., Van Gool, L., Williams,
C. K., Winn, J., and Zisserman, A. (2014). The Pas-
cal Visual Object Classes Challenge: A Retrospective.
International Journal of Computer Vision, 111(1):98–
136.
Everingham, M., Van Gool, L., Williams, C. K., Winn, J.,
and Zisserman, A. (2010). The pascal visual object
classes (VOC) challenge. International Journal of
Computer Vision, 88(2):303–338.
Farenzena, M., Bazzani, L., Perina, A., Murino, V., and
Cristani, M. (2010). Person re-identification by
symmetry-driven accumulation of local features. In
Proceedings of the IEEE Computer Society Confer-
ence on Computer Vision and Pattern Recognition,
pages 2360–2367.
Hermans, A., Beyer, L., and Leibe, B. (2017). In Defense
of the Triplet Loss for Person Re-Identification.
Krasin, I., Duerig, T., Alldrin, N., Ferrari, V., Abu-El-
Haija, S., Kuznetsova, A., Rom, H., Uijlings, J.,
Popov, S., Kamali, S., Malloci, M., Pont-Tuset,
J., Veit, A., Belongie, S., Gomes, V., Gupta, A.,
Sun, C., Chechik, G., Cai, D., Feng, Z., Narayanan,
D., and Murphy, K. (2017). OpenImages: A
public dataset for large-scale multi-label and multi-
class image classification. Dataset available from
https://storage.googleapis.com/openimages/web/index.html.
Li, W. and Wang, X. (2013). Locally aligned feature trans-
forms across views. In Proceedings of the IEEE Com-
puter Society Conference on Computer Vision and
Pattern Recognition, pages 3594–3601.
Li, W., Zhu, X., and Gong, S. (2018). Harmonious Atten-
tion Network for Person Re-Identification.
Lin, T.-Y., Maire, M., Belongie, S., Bourdev, L., Girshick,
R., Hays, J., Perona, P., Ramanan, D., Zitnick, C. L.,
and Doll
´
ar, P. (2014). Microsoft COCO: Common Ob-
jects in Context.
Liu, L., Ouyang, W., Wang, X., Fieguth, P., Chen, J., Liu,
X., and Pietik
¨
ainen, M. (2020). Deep Learning for
Generic Object Detection: A Survey. International
Journal of Computer Vision, 128(2):261–318.
Mathur, N., Mathur, S., Mathur, D., and Dadheech, P.
(2020). A Brief Survey of Deep Learning Techniques
for Person Re-identification. In Proceedings of 3rd In-
ternational Conference on Emerging Technologies in
Computer Engineering: Machine Learning and Inter-
net of Things, ICETCE 2020, pages 129–138. Institute
of Electrical and Electronics Engineers Inc.
Quan, R., Dong, X., Wu, Y., Zhu, L., and Yang, Y. (2019).
Auto-ReID: Searching for a Part-aware ConvNet for
Person Re-Identification.
R. Kawamura (2020). RectLabel.
Russell, B. C., Torralba, A., Murphy, K. P., and Freeman,
W. T. (2008). LabelMe: A database and web-based
tool for image annotation. International Journal of
Computer Vision, 77(1-3):157–173.
Schroff, F., Kalenichenko, D., and Philbin, J. (2015).
FaceNet: A Unified Embedding for Face Recognition
and Clustering.
Si, J., Zhang, H., Li, C. G., Kuen, J., Kong, X., Kot,
A. C., and Wang, G. (2018). Dual Attention Match-
ing Network for Context-Aware Feature Sequence
Based Person Re-identification. In Proceedings of
the IEEE Computer Society Conference on Computer
Vision and Pattern Recognition, pages 5363–5372.
IEEE Computer Society.
Song, C., Huang, Y., Ouyang, W., and Wang, L. (2018).
Mask-Guided Contrastive Attention Model for Person
Re-identification. In Proceedings of the IEEE Com-
puter Society Conference on Computer Vision and
Pattern Recognition, pages 1179–1188. IEEE Com-
puter Society.
Tzutalin. LabelImg.
Wang, G., Lai, J., Huang, P., and Xie, X. (2018). Spatial-
Temporal Person Re-identification.
Wojke, N. and Bewley, A. (2018). Deep Cosine Metric
Learning for Person Re-Identification.
Yang, X., Wang, M., and Tao, D. (2019). Person Re-
identification with Metric Learning using Privileged
Information.
Yi, D., Lei, Z., and Li, S. Z. (2014). Deep Metric Learning
for Practical Person Re-Identification.
Zhao, R., Ouyang, W., and Wang, X. (2013). Unsupervised
salience learning for person re-identification. In Pro-
ceedings of the IEEE Computer Society Conference
on Computer Vision and Pattern Recognition, pages
3586–3593.
Zheng, L., Shen, L., Tian, L., Wang, S., Wang, J., and
Tian, Q. (2015). Scalable Person Re-identification: A
Benchmark. In 2015 IEEE International Conference
on Computer Vision (ICCV), pages 1116–1124. IEEE.
Zheng, W. S., Gong, S., and Xiang, T. (2011). Person re-
identification by probabilistic relative distance com-
parison. In Proceedings of the IEEE Computer Society
Conference on Computer Vision and Pattern Recogni-
tion, pages 649–656. IEEE Computer Society.
ICPRAM 2021 - 10th International Conference on Pattern Recognition Applications and Methods
286
