
Self-Similarity Matrix of Morphological Features for Motion Data
Analysis in Manufacturing Scenarios
Ant
´
onio Santos
1
, Jo
˜
ao Rodrigues
1,3 a
, Duarte Folgado
1,2 b
, Sara Santos
2 c
,
Carlos Fuj
˜
ao
3
and Hugo Gamboa
1,2 d
1
Laborat
´
orio de Instrumentac¸
˜
ao, Engenharia Biom
´
edica e F
´
ısica da Radiac¸
˜
ao (LIBPhys-UNL), Departamento de F
´
ısica,
Faculdade de Ci
ˆ
encias e Tecnologia, FCT, Universidade Nova de Lisboa, 2829-516 Caparica, Portugal
2
Associac¸
˜
ao Fraunhofer Portugal Research, Rua Alfredo Allen 455/461, 4200-135 Porto, Portugal
3
Volkswagen Autoeuropa, Quinta da Marquesa, 2954-024 Q.ta do Anjo, Portugal
Keywords:
Self-Similarity Matrix, Time Series, Industry, Musculoskeletal Disorders, Inertial Sensors, Segmentation,
Manufacturing, Unsupervised.
Abstract:
There is a significant interest to evaluate the exposure that operators are subjected throughout the working
day. The objective evaluation of occupational exposure with direct measurements and the need for automatic
annotation of relevant events arose. Using time series retrieved from inertial sensors, this work proposes a
method that is able to automatically: (1) detect anomalies, (2) segment the working cycles and (3) by means of
query-by-example, identify sub segments along the working cycle. In a short summary, this technique firstly
organizes the dataset provided by all inertial measurement units (IMUs) sensors placed over the dominant
upper limb. After this, it retrieves a wide variety of features to an organized matrix and then calculates the
respective self-similarity matrix (SSM). This method provides information by comparing each subsequence of
the time series with the remaining subsequences. As the identified structures will provide information about
how repetitive or anomalous is the behaviour of the data in function of time. The results show that the presented
method is capable of identifying anomalies on this dataset with an accuracy of 82%, detect working cycles
with a duration error of about 6% of the working cycle, and has the ability to find matches of sub-sequences
of the working cycle.
1 INTRODUCTION
Work-related disorders have a global impact on the
well being of individuals and their quality of life, as
well as being a burden for companies by decreas-
ing productivity, increasing absenteeism and promot-
ing early retirements. More specifically, work-related
musculoskeletal disorders (WMSDs) represent a sig-
nificant portion of the total sum, especially in manu-
facturing scenarios, where the repetitive nature of the
tasks increases the risk of WMSDs (Irastorza et al.,
2010). Several strategies have been implemented in
large industries to prevent WMSDs and decrease their
impact on individuals and companies, namely (1) the
inclusion of job rotation schedules that promote a
a
https://orcid.org/0000-0001-7320-511X
b
https://orcid.org/0000-0002-8481-6079
c
https://orcid.org/0000-0002-2554-3648
d
https://orcid.org/0000-0002-4022-7424
variation of the exposure throughout the working day
and (2) the implementation of ergonomic assessment
methods that support the evaluation of the occupa-
tional risk for a specific workstation (Rodrigues et al.,
2020). Nevertheless, the current approaches are far
from being optimal in the sense that these strategies
might (1) not be automated, depending on observa-
tional methods, which requires dedicated personnel
to observe or look into video records of operators
at work, (2) still rely on subjective opinions, (3) be
based on global indicators that do not take into ac-
count the variability among the population of oper-
ators, namely anthropometric variations, age, work-
ing experience, among others and (4) yield to single
score to represent the ergonomic risk of a worksta-
tion, which is insufficient to explain the factors that
contribute to this risk.
All these factors contribute to the high work-
load that is required in implementing these strate-
gies, hence being very difficult to employ them across
80
Santos, A., Rodrigues, J., Folgado, D., Santos, S., Fujão, C. and Gamboa, H.
Self-Similarity Matrix of Morphological Features for Motion Data Analysis in Manufacturing Scenarios.
DOI: 10.5220/0010252800800090
In Proceedings of the 14th Inter national Joint Conference on Biomedical Engineering Systems and Technologies (BIOSTEC 2021) - Volume 4: BIOSIGNALS, pages 80-90
ISBN: 978-989-758-490-9
Copyright
c
2021 by SCITEPRESS – Science and Technology Publications, Lda. All rights reserved

the complete operator’s population at manufacturing
sites. With the advent of Industry 4.0, more compa-
nies are using new strategies and improving the ones
currently applied by the addition of digital industry
technology, namely sensors, automation, dedicated
algorithms and machine learning methods (Romero
et al., 2016).
In this work, we highlight the interest in using in-
ertial sensors to have direct measures for a more spe-
cific assessment of occupational risk for each oper-
ator. In (Santos et al., 2020), inertial sensors were
used to evaluate the occupational exposure of several
operators performing different types of workstations.
The assessment was based on the RULA screening
tool that considers biomechanical and postural load
requirements on upper limbs. These are evaluated for
each working cycle, which represents the period dur-
ing which an operator performs a specific set of tasks
of a workstation, repeating the cycle of tasks during
the working period. Having data signals from wear-
able sensors that characterize the working period of
an operator, there is more control and flexibility on
the time periods that are selected for assessment. This
has several benefits because it is possible to (1) make
objective assessments for each working cycle, under-
standing how the occupational exposure varies from
the first working cycle to the last one; (2) compare,
for the same workstation, how was the occupational
exposure of different workers; (3) compare the occu-
pational exposure of different workstations performed
by the same worker and (4) compare the occupational
exposure of subsections of the working cycle, iden-
tifying which are the tasks that contribute more for
the exposure score on the working cycle. Still, meth-
ods for the detection of working cycles and anomalies
should be available. With such techniques available,
the flexibility and detail of analysis can have a great
impact on improving the ergonomic assessment, have
better strategies to design balanced workstations and
improve the design of job rotation plans. Therefore,
the design of algorithms and tools that promote this
flexible, quicker and more detailed analysis is of great
relevance to achieve the mentioned benefits.
In this work, we propose an unsupervised method
that uses the acquired inertial data to (1) automati-
cally detect anomalies in the working period, (2) au-
tomatically divide the working period into working
cycles and (3) use a sub-segment of the working cy-
cle to identify all the corresponding sub-segments in
the working period by means of a query-by-example
approach. The method is performed by computing a
self-similarity matrix based on the extraction of a list
of features of all signals acquired by employing a slid-
ing window process.
The document starts with a review of the related
work that shares the same contextual problem. Then,
the description of the dataset follows, and a detailed
description of the proposed method is presented. The
results are then presented and discussed. Finally, we
conclude and detail ideas for future work.
2 RELATED WORK
The problems regarded in this work involve essen-
tially the identification of cyclic information and
anomalies. Typically, algorithms developed for these
purposes may resort to (1) supervised machine learn-
ing (ML) methods, which require a certain level of
annotation beforehand and (2) unsupervised methods,
which are based on the similarity analysis of the sig-
nals or their features, without any prior information.
Several methods found, employed in the analysis of
inertial data, are used in the context of human ac-
tivity recognition (HAR). The list of supervised ML
methods is extensive and promising works are found
to achieve this purpose. The application of neural
networks (Lara and Labrador, 2013), hidden Markov
models (Zhu and Sheng, 2009), decision trees (Ja-
tob
´
a et al., 2008), bayesian networks (Jatob
´
a et al.,
2008), and semi-automatic process (Bota et al., 2019),
among others, are algorithms capable of detecting and
classifying various human actions. Nonetheless, most
of the work done in this context only looks to identify
previously defined actions like lying, standing, sitting
down, move upstairs, etc., that might not be cyclic and
rely on a significant amount of labelled data.
Several works that use unsupervised methods for
the identification of cyclic information and anoma-
lies are also found. The most simple method of cycle
detection is the use of point references on the work-
place to describe when a cycle starts and ends. Which
is usually considered a system subject to flaws with
a requirement for further adjustments steps (Bauters
et al., 2014; Bauters et al., 2018). Other more re-
liable alternatives analyze features of the signal and
search for periodic motion in those. An automated
algorithm of segmentation was able to separate com-
plex and multidimensional data into smaller segments
that can be described through harmonic models. This
algorithm revealed to be significantly useful to iden-
tify cyclic movement without any a priori knowledge
of the input data, using a combination of a recur-
sive least squares segmentation algorithm, a model
fitting of damped harmonics, and in the end, a clus-
tering analysis to classify the events (Lu and Ferrier,
2004; Lu and Ferrier, 2003). The usage of features is
of great relevance in unsupervised works, and meth-
Self-Similarity Matrix of Morphological Features for Motion Data Analysis in Manufacturing Scenarios
81

ods are found to select adequate features for detec-
tion and classification tasks, such as in (Machado
et al., 2015). Another example is the use of four-pass
UKF (unscented Kalman filter) to produce an unified
model with kinematic parameters. These may then be
segmented by analyzing the parameter’s zero crossing
velocity and in the end uses a clustering algorithm to
identify repetitive segments (Wang et al., 2015).
Other methods rely on a self-similarity approach,
namely (Nunes et al., 2011), where cyclic informa-
tion is segmented by searching for minimums, in the
convolution of a segment of the signal with itself. The
Matrix Profile (MP), which is a method that com-
pares all sub-sequences of a given time series with
themselves through an euclidean distance, has also
revealed promising results. In the end, it returns the
minimum value distance for each segment, highlight-
ing the moments of the time series which are similar
within themselves (Yeh et al., 2018). Additionally,
autocorrelation revealed itself an useful tool, as the
search over maximum values can infer the cyclic na-
ture of the data (Bauters et al., 2014). Finally, for
anomaly detection in industrial scenarios, an interest-
ing work applies an unsupervised method based on
the clustering of time series segments to detect the
execution of improper movements (Varandas. et al.,
2019).
The following work is inspired over an algorithm
for the detection of musical structures on audio sig-
nals (Foote, 2000; Paulus et al., 2010; Bello et al.,
2018) by means of a Self-Similarity Matrix (SSM).
This sort of analysis of self-similarity to collect infor-
mation about the periodicity has also been performed
over video datasets. This type of analysis usually
consists on a framework where a Fourier analysis is
performed on an SSM to characterize and highlight
the periodicity of the data from the video (Cutler and
Davis, 2002; Cutler and Davis, 1999).
3 DATASET
3.1 Participants
The in-field data used in this work was acquired in
the assembly lines of an automotive assembly plant
while the subjects were performing the tasks of a spe-
cific workstation. The context of the acquisition re-
garded the validation of an inertial system that would
guarantee access to direct measures. These were used
to deliver an ergonomic risk assessment based on the
angular information retrieved by the raw data of the
sensors (Santos et al., 2020). The dataset included
six participants, each monitored while working at two
different workstations. In this scenario, each work-
station has a specific set of tasks that have to be
performed by the worker. These tasks are repeated
throughout the working period, being divided into
working cycles.
3.2 Experimental Setup
The study was conducted by measuring data from the
dominant upper limb of the subjects. The system
comprehends a set of four 9-DoF inertial motion units
(IMUs) with each containing a triaxial accelerome-
ter, gyroscope and magnetometer. The IMUs were
attached on the upper dominant limb of the subjects,
namely:
• IMU 1 posterior side of the hand
• IMU 2 posterior side of the forearm (wrist)
• IMU 3 posterior side of the arm (elbow)
• IMU 4 thorax area
All devices were attached so that the alignment
of Y-axis was pointed up. The Figure 1 presents the
main configuration of the acquisition setup and device
placement.
y
x
z
Acc
Gyr
Mag
Acc
Gyr
Mag
Acc
Gyr
Mag
Acc
Gyr
Mag
Figure 1: Schematic of the placement of Inertial sensors,
used for the dataset acquisition protocol. Based on (Santos
et al., 2020).
The signals available for analysis are the 3-axis
accelerometer, gyroscope and magnetometer of all
IMUs used, collected with a sampling rate of 100 Hz.
These data have multiple working cycles interca-
lated with resting moments. For the annotation of
these events, all signals were annotated by means of
video-records of the acquisition sessions.
4 METHODS
Signals acquired during a working period have a pe-
riodic nature, since the set of tasks of the worksta-
tion are repeated in each working cycle. Therefore,
each signal acquired has a recurrent pattern of the
BIOSIGNALS 2021 - 14th International Conference on Bio-inspired Systems and Signal Processing
82
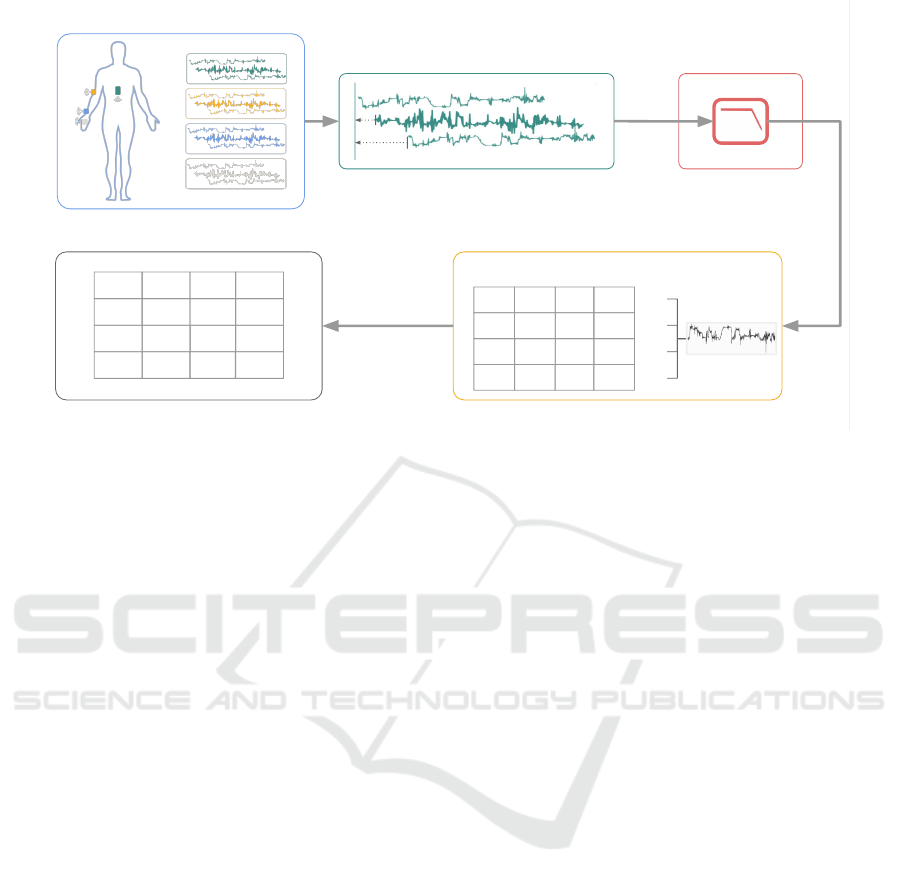
Raw Data Data Alignment Data Filtering
Feature ExtractionSelf-Similarity Matrix
F
1
F
2
...
F
N
F
11
F
12
... F
1N
F
21
F
22
... F
2N
... ... ... ...
F
N1
F
N2
... F
NN
F
M
F
M
T
F
M
S
11
S
12
... S
1N
S
21
S
22
... S
2N
... ... ... ...
S
N1
S
N2
... S
NN
Figure 2: Main schematic of the proposed method.
tasks performed during the working cycle. Neverthe-
less, being signals acquired in a real working context,
unexpected events occur and are present on the sig-
nal. Several anomalies can be found, namely (1) when
the operator stops working because of a break on the
working line, which can be caused by delays on other
workstations; and (2) when the operator takes more
time to perform a specific task or rather have to make
a significant amount of additional motions to perform
the working cycle. In this work, we are searching for
a method to unveil the periodic nature of the signal
and identify dissimilar moments.
The method proposed to identify (dis)similarity
on the signals acquired is inspired in a method em-
ployed to analyse several dimensions of musical
structures, namely homogeneity-based, novelty-based
and repetition-based (Paulus et al., 2010). The pro-
cess involves extracting a set of features that are able
to characterize the morphological dynamics of the
signal and how it varies over time, and compute a SSM
based on the features extracted (Paulus et al., 2010).
From the SSM we are able to extract a relevant set of
information.
The sequence of steps to calculate the SSM are
presented in Figure 2. The first row of steps shows
the preparation of the signals, namely the process for
data synchronization and alignment between signals
of different sensors, and filtering the signals with a
second order Butterworth low pass filter with a cut-
off frequency of 20 Hz. After the preparation of the
signals, the selected list of features are extracted from
all signals and organized in a matrix, from which the
SSM is computed.
4.1 Features Extraction
Extracting relevant features is of great importance to
have a rich characterization of the morphology of
each signal (Rodrigues et al., 2017). The features
were extracted employing a sliding window process.
With this method, a set of predefined features are ex-
tracted on each segment of the signal, selected in each
iteration. The window segment has a predefined size
window
s
and each iteration proceeds with a prede-
fined overlap percentage overlap
p
. We used the TS-
FEL (Barandas et al., 2020) Python library to extract
a set of features in the statistical, temporal and fre-
quency domains. We used all the available features
except the wavelet-based features to reduce the com-
putational time.
The window
s
and overlap
p
parameters have a
large influence on the results. The first defines the
time scale at which features are extracted, therefore
the higher is the size of the window, the larger is the
time scale at which feature values change. Regard-
ing the second parameter, it defines the resolution of
the resulting feature-signal, therefore the higher is the
overlap percentage, less information is lost and the
higher is the resolution.
After extracting the set of features, these are or-
ganized in a matrix F
M
. The rows are a feature rep-
resentation of the signal, and columns represent the
characterization of one sample of the signal by all fea-
tures extracted. The matrix is built with the features
extracted from all signals. At last, each extracted fea-
ture is z-normalized.
Self-Similarity Matrix of Morphological Features for Motion Data Analysis in Manufacturing Scenarios
83
A
AB C
A
AB C
Time
Time
s
f
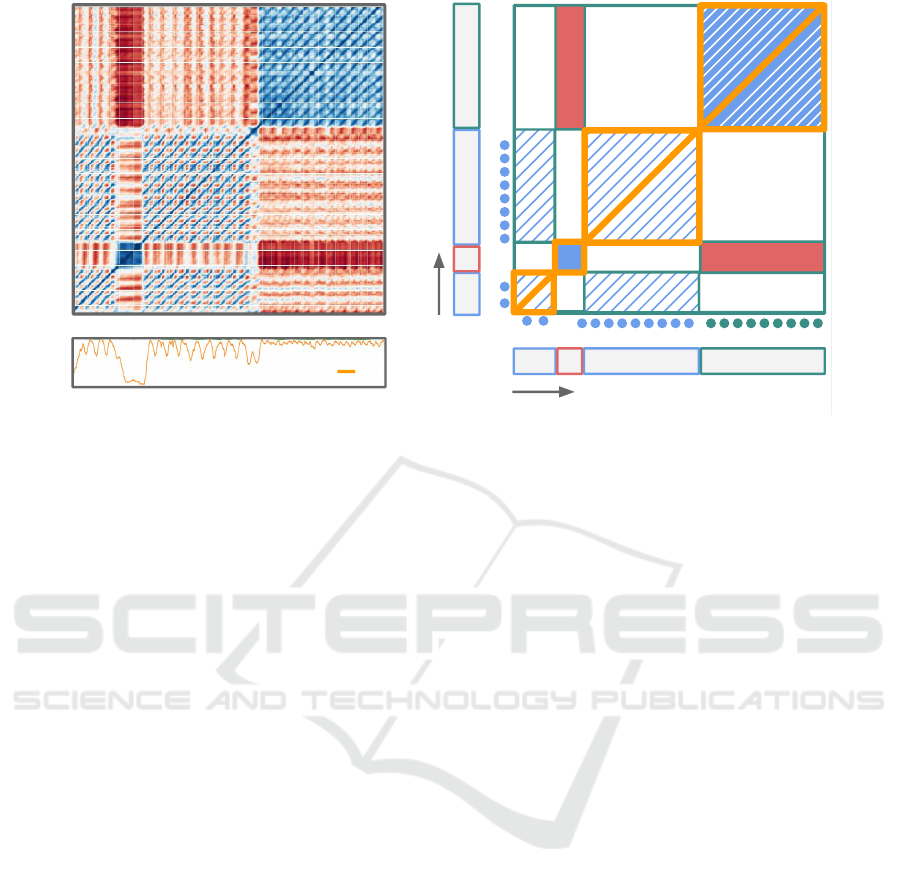
Figure 3: At the left is the SSM designed from the signals acquired while an operator was performing 2 different workstations.
At the right is a simplification of the original SSM, with highlights on the main structures present. Additionally, the orange
signal on the left plot is the similarity function, calculated by summing the values of the SSM column-wise.
4.2 Self-Similarity Matrix Analysis
The purpose of the SSM is to compare each sample
of the signals with all the other samples. In order to
calculate the SSM, the dot product between the trans-
posed F
M
and itself is performed. Therefore, each col-
umn of the matrix is compared with each other, giving
a similarity score. Columns that have feature values in
common have higher similarity scores, while columns
with diverging feature values will have lower simi-
larity scores (Paulus et al., 2010; Bello et al., 2018).
Each column of the matrix represents the characteri-
zation of each segment of the signal that was selected
during the sliding window process. By comparing
each column of the matrix with each other, we are
comparing each segment of the signal with each other,
hence creating a matrix that provides a rich visual in-
formation about how the signal is structured and how
it behaves over time.
In Figure 3 are illustrated the standard structures
encountered in a SSM (Paulus et al., 2010):
(1) Main Diagonal - The main diagonal is a result
of comparing each column of the transposed matrix
with the rows of the original matrix that correspond to
itself. The values of the main diagonal are the highest
similarity values;
(2) Blocks - Block structures represent areas of
the signal with an homogeneous behaviour. When a
block structure changes into a different block struc-
ture along the diagonal, it means the behaviour of the
signal changed. These structures help in identifying
significant changes in the signal. For instance, in Fig-
ure 3, block A changes to block B, then to block A
and finally to block C. These blocks are highlighted
in orange;
(3) Secondary Diagonals - As mentioned, the
main diagonal is created by comparing each column
of the matrix with itself. When other diagonals are
visible in the matrix apart from the main one, we can
infer that the columns and rows of the matrix seg-
mented by the secondary diagonal have similar prop-
erties. These structures are therefore a way of detect-
ing reoccurring patterns of the signal. For instance, in
Figure 3, secondary diagonals on blocks A and block
C, indicate that segments A and C are periodic. Ad-
ditionally, the pattern repeats on the instant the sec-
ondary diagonal starts, which is indicated by colored
circles under each segment.
From the SSM, we can extract the required infor-
mation by applying several methods. For the identifi-
cation of anomalies and the segmentation of working
cycles, we based the method on computing the simi-
larity function, which represents the column-wise ad-
dition of values from the SSM. Regarding the selec-
tion of similar sub-sequences of the working cycle,
we used a query-match by example approach on the
SSM, where the example is the selected sub-sequence
of the matrix. These methods will be further detailed
in the following subsections.
BIOSIGNALS 2021 - 14th International Conference on Bio-inspired Systems and Signal Processing
84

4.3 Anomalies and Working Cycles
Segmentation
Anomalies are, in this context, defined as being dis-
similar segments of the signals in comparison to the
average working cycle. These anomalies during the
working period will be assessed by means of identi-
fying the similarity levels in the signals with the sim-
ilarity function. The similarity function, sf, is calcu-
lated by summing the values of the SSM column-wise,
being each element of the sf calculated by:
s
f
(x) =
N
∑
i=0
SSM
ix
(1)
where j the column position for the sum, s f
j
the sam-
ple of the function at position j and N the size of the
SSM.
This function provides information about how
similar each sample of the signals is with the remain-
ing signals, therefore if samples belong to an anomaly
segment, the similarity values for the corresponding
column on the matrix will be lower. Therefore, the
sum of similarity values will also be lower than for
other segments of the matrix. With this process, seg-
ments of the similarity function with lower values in-
dicate the presence of the mentioned anomalies. This
can be visualized in Figure 3, where block B of the
SSM are associated with the lower values in the s
f
representing an anomaly.
Regarding to periodic signals, the sample values
of the similarity function will be very similar for equal
moments of each period, therefore creating a repeat-
ing pattern of similarity, which can be used to segment
working cycles. The process involved three stages:
(1) remove the anomalies, identified with the previous
method; (2) recompute the similarity function with
an SSM without the selected anomalies and (3) use
a peak detector to identify the cycles.
As previously mentioned, secondary diagonals in-
dicate the presence of similarity and reoccurring pat-
terns can be visualized on the SSM. The starting
point of these diagonals corresponds to the position at
which the cycle starts. By removing the encountered
anomalies, we can reject lower areas of the similarity
function, unveiling the periodic pattern of similarity.
The resulting similarity function has a prominent min-
imum at the position where diagonals start. Finally,
to segment and divide the working period in working
cycles, we have to identify the local minimums of the
function. This is illustrated in Figure 3 where the s
f
has repeating local minima at the position where the
secondary diagonals start, on blocks A.
4.4 Sub-segment of Working Cycle
Search
Another relevant purpose for the evaluation of the oc-
cupational exposure in industrial scenarios is to com-
pare the occupational risk of sub-segments of the
working cycle during the working period. As men-
tioned, this strategy helps professionals in identify-
ing which sequence of tasks of the working cycle are
more responsible for the occupational risk, and help
them understand if a workstation needs to be adapted,
i.e. having a more balanced set of tasks.
In this case, the search procedure is aided by sig-
nalling the desired sub-sequence in the signal, which
is given as an argument in the function. The search
procedure works by sliding the smaller column win-
dow (the example selected) along the SSM, one sam-
ple at a time. The distance, D, between the example
and the segment it slides over is calculated through
the sum of absolute differences:
D(x) =
x=M
∑
x=0
q
(SSM(x) − SSM
t
)
2
(2)
where SSM(x) the segment of the SSM over which
the example, SSM
t
, slides at moment x, starting from
0 to the size of the SSM, M. The resulting function
has minimums at the position where the example is
matched, as presented in Figure 4.
D(x)
1 2 3 4 5 6 7 8 9
Figure 4: The Figure illustrates a simplified representation
of a block structure of an SSM, with repeating secondary di-
agonals. The cycles are represented by order and their cor-
responding numbers, while also divided by the dotted lines.
The red highlighted segment represents the selected exam-
ple of the working cycle to match along the other periods of
the matrix. The green highlighted areas represent the per-
fect match along diagonals and has, therefore, a minimum
in the distance function (D(x)).
5 RESULTS AND DISCUSSION
In this section are presented the results of applying
the algorithm to the dataset for discovering anomalies,
working cycles and sub-sequence search. We present
an example of applying the proposed method to one
Self-Similarity Matrix of Morphological Features for Motion Data Analysis in Manufacturing Scenarios
85

of the acquisition sessions, whereas global results will
be shown for the entire dataset in Table ??.
5.1 Working Periods Identification
The detection of anomalies involved searching for ar-
eas with lower similarity. The areas with lower simi-
larity would represent segments of the working period
in which the operator would have different motion in-
formation than the most common during work. These
can correspond to the mentioned anomalies.
Table 1: Results of the detection of the mentioned anoma-
lies. The workstations (Wkstn) with no indicators reveal
no anomalies. Operator 6 was not considered because the
videos for the activity recorded only the beginning of the
task. TP-True Positives, FP-False Positives, FN-False Neg-
atives and A-Accuracy. TP, FP and FN are measured with a
resolution of seconds. (TN - True Negatives are not consid-
ered to not bias the results).
Signal Wkstn Detected TP FP FN A(%)
Operator 1
1 3/3 268 1 140 65.53
2 1/2 45 0 17 72.5
Operator 2
1
2/2 305 0 6 98.07
2 - - - - -
Operator 3
1 0/1 0 0 50 0
2 - - - - -
Operator 4
1 2/2 488 22 0 95.69
2 - - - - -
Operator 5
3 1/2 49 0 19 72.05
4 1/1 71 0 2 97.26
All 10/13 1226 23 234 82.67
Table 1 shows the results of applying a threshold
based method on the similarity function. Values under
the threshold would be considered anomalies of the
working period. The results are presented in terms
of how many anomalies were identified per working
period as well as how accurate was this detection, in
seconds, based on the values of TP, FP and FN.
Results show that the algorithm is able to detect
the majority of the anomalies. In cases where the
anomalies were short, the detection would not be pos-
sible. This might be a resolution problem, consider-
ing the window used to extract the features from the
signals, but further investigation should be made. The
error rate of the detection is still significant and is also
related with the resolution issue. Nevertheless, the
overall results are promising for using this technique
for these scenarios.
5.2 Working Cycles Identification
We applied the method of detecting the working cy-
cles by analysing the SSM. We evaluated the capabil-
ities of the algorithm by comparing its performance
with a well known algorithm proven to work in sim-
ilar problems, the Matrix Profile (MP). We applied
the MP algorithm to one signal of each acquisition
dataset. The MP algorithm receives only one param-
eter that defines the time scale of the repeating pat-
tern. For each session, the average size of the work-
ing cycle was taken into consideration for the usage
of the MP algorithm. We used the implementation
of the MP algorithm from stumpy (Law, 2019). Both
the MP and SSM algorithms have their performances
evaluated in terms of:
(1) Correct Detection of Cycles. A cycle seg-
ment is considered correct if the moments at which
the cycles are segmented correspond to a consistent
position on the signal. Even if the segmentation of cy-
cles occurs delayed from the ground-truth selection,
what is evaluated in this category is the consistency of
the algorithm in defining the working cycle. Here are
measured how many cycles are correctly segmented;
(2) Calculate the Error between the Ground-
truth Segmentation and the Algorithm’s Segmen-
tation. The ground-truth duration of cycles is com-
pared with the duration of the detected cycles by cal-
culating the absolute difference between durations.
This error is expressed in terms of seconds per cy-
cle and duration percentage of the cycle. In Fig-
ure 5, the left plot illustrates an example of segment-
ing the working cycles by means of the similarity
function. The SSM function was calculated by a set
of features extracted with a time window of 50 sec-
onds and an overlap of 85%. The similarity function
was smoothed with a moving average window of 20
seconds. The first figure of the right plot shows the
ground-truth segmentation, and the second figure the
segmentation based on the similarity function.
Results presented in Table ?? show that the meth-
ods tested have equivalent performance to detect
working cycles in industrial data. Most cycles were
correctly detected by both algorithms, although there
is a delay in the detection. This delay is comprehen-
sible considering that the algorithm, being unsuper-
vised, does not have a reference of where the cycle
has the ”real” start. The algorithms take into consid-
eration the beginning of the data as a reference, which
would not always match with the instant the operator
would start the cycle. The lag detected does not have
an effect in the detection of the entire cyclic informa-
tion, since both algorithms are consistent with their
decision of where the ”start” is, and are able to iden-
tify the cyclic pattern. Moreover, they have a similar
BIOSIGNALS 2021 - 14th International Conference on Bio-inspired Systems and Signal Processing
86
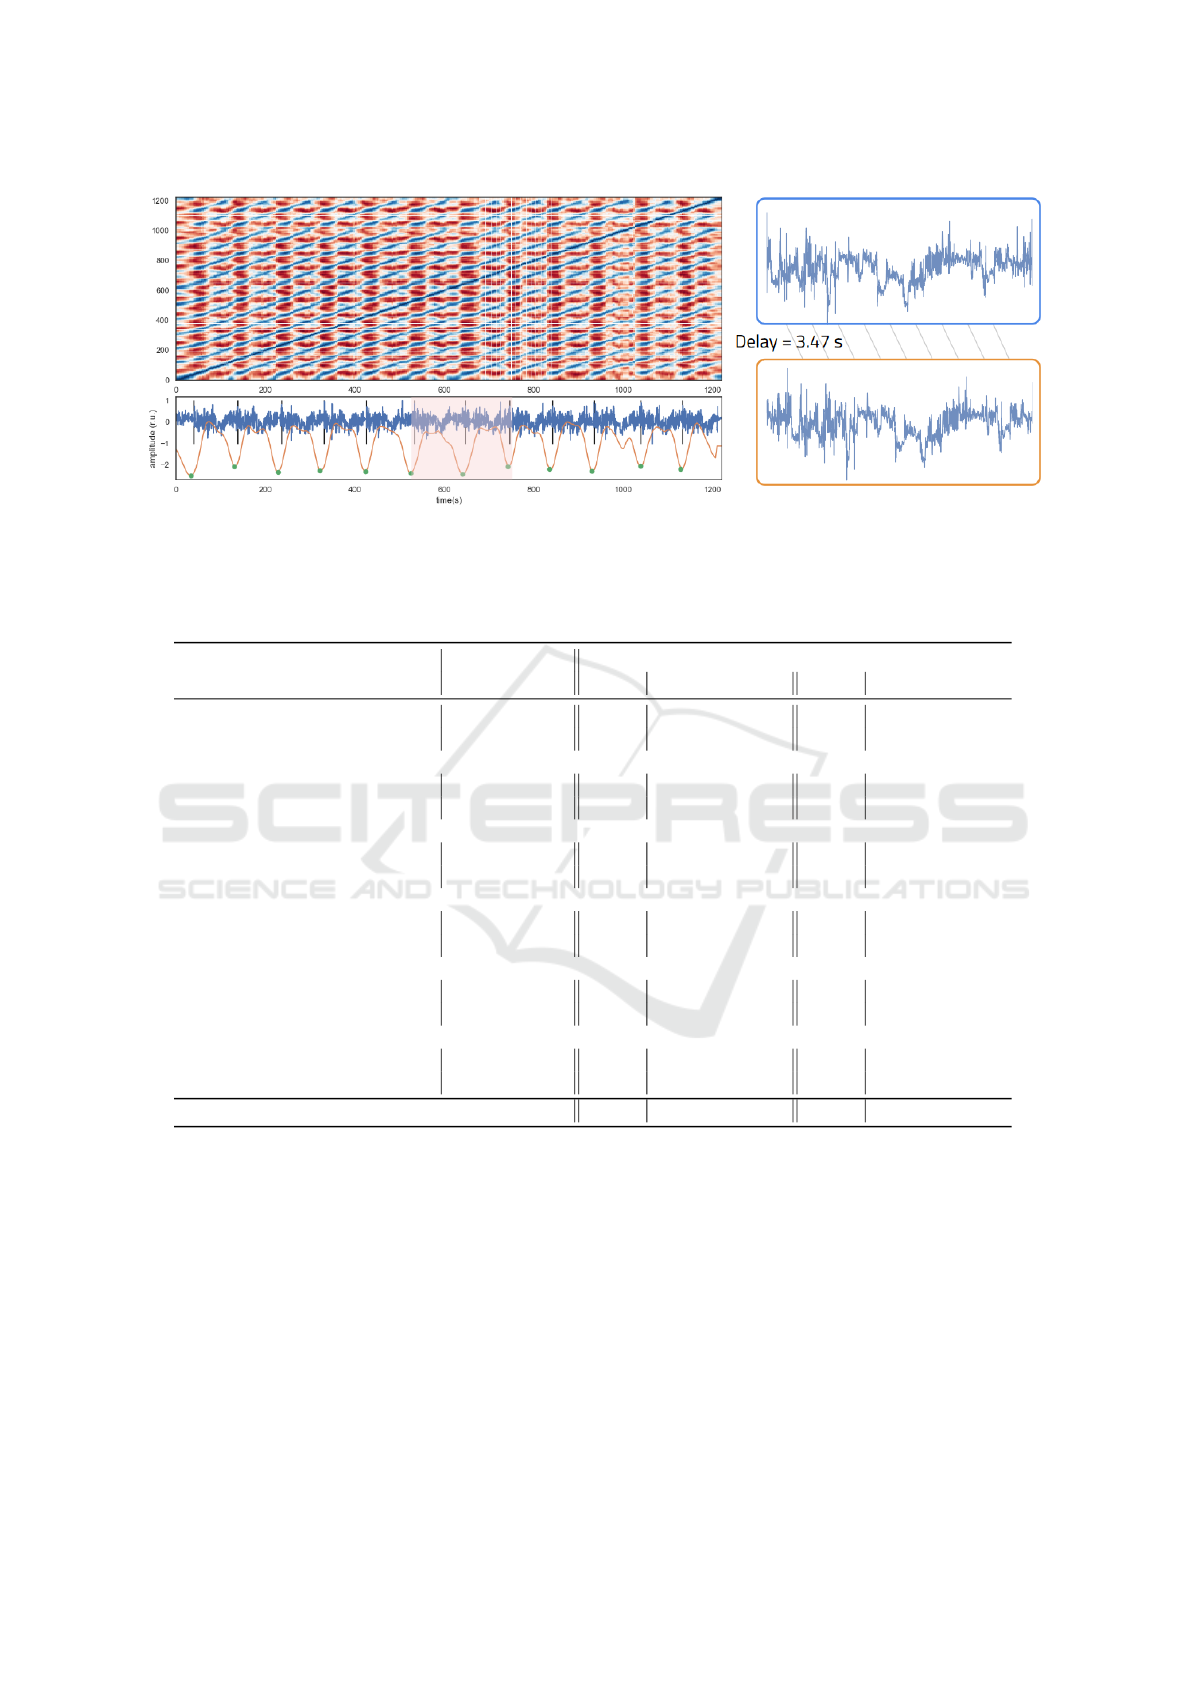
Figure 5: Example of the detection of working cycles by means of the SSM after removing the anomalies. Black bars represent
the ground truth events, green circles are the detected cycles on the similarity function (orange), represented on the bottom
subplot. The X-accelerometer signal from the hand sensor is in blue.
Table 2: Results of searching for minimums in the similarity function, calculated based on the SSM. The proposed method is
compared with the Matrix Profile, by means of number of cycles detected and duration error.
Signal Workstation Cycles
SSM Matrix Profile
Cycles Duration Error Cycles Duration Error
Operator 1
1 11 11 3.26s (3.04%) 11 11.08s (10.34%)
2 15 14 16.97s (15.83%) 14 8.09s (7.55%)
Operator 2
1 14 14 6.45s (6.40%) 14 6.74s (6.70%)
2 11 11 8.48s (8.62%) 11 11.2s (11.39%)
Operator 3
1 16 16 12.35s (11.79%) 16 7.39s (7.05%)
2 13 13 8.81s (8.25%) 12 11.41s (10.68%)
Operator 4
1 14 14 1.05s (0.4%) 14 8.72s (8.24%)
2 11 11 3.42s (3.32%) 10 4.9s (4.75%)
Operator 5
3 12 12 2.83s (2.85%) 11 5.39s (5.43%)
4 10 11 3.47s (3.45%) 10 6.7s (6.69%)
Operator 6
5 15 14 3.79s (3.74%) 15 7.25s(7.15%)
6 15 14 5.79s (5.73%) 15 6.13s (6.06%)
All 157 154 6.12% 154 7.6%
performance in this regard.
The proposed algorithm also shows that it works
for several scenarios, namely different types of work-
stations made by the same worker as well as different
workers making the same workstation.
The duration error is mostly good as well, but still
significant in some of the cases. The duration was
calculated to be an indicator of the detection quality.
Even in cases where the detection is delayed from the
ground-truth annotation, the duration of the working
cycles should be the same. On average, the error rep-
resents 6% of the working cycle, which can be up to
6 seconds in working cycles of 100 seconds. This er-
ror might have contributions from the loss of resolu-
tion when extracting features, smoothing the similar-
ity function to detect the minimums and errors in the
manual annotation of the events. Nevertheless, the re-
sults are promising, showing that the algorithm is able
to segment the working cycles of a working period.
The difference in performance between the SSM
method and the Matrix Profile are not significant. The
slight difference in duration error might occur be-
cause of the smoothing factor used with Matrix Pro-
file, which was higher, and therefore increased the
Self-Similarity Matrix of Morphological Features for Motion Data Analysis in Manufacturing Scenarios
87

chance of errors in the duration of the working cycle.
Nevertheless, both had equal performance in dividing
the working period into cycles.
5.3 Sub-segment Search
In the example presented in Figure 6 is demonstrated
how the SSM can be used to identify sub-segments
of the working cycle during the working period. The
detection is based on the match of columns (or diag-
onals), which results in a precise matching function.
The orange signal represents the similarity function
to demonstrate that the minimum values of the dis-
tance function are consistent with the cycle position.
Highlights are used on the image starting at the ex-
act minimum position, which is the place where the
sub-segment being searched starts.
4
Figure 6: Example of sub-segment search on the SSM. The
SSM is presented in the upper plot, with a sub-segment
highlighted between cycles 5 and 6. The blue signal is the
X-accelerometer of the hand sensor, the orange signal is the
similarity function and the grey signal represents the dis-
tance function. The red segment highlighted is the example
used to compute the distance, and the green segments are
the matches based on the distance function.
5.4 Overview
The results show that the SSM is fit for the problems
in demand. This method has the advantage of relying
on characteristics of the signal, giving a rich insight
about the signals being analysed. Additionally, using
this method enables the use of a multisignal approach,
not relying on the information extracted from a single
signal for the analysis of the entire dataset, or having
to analyse all signals individually to match the infor-
mation. Nevertheless, further tests should be made
to understand the clear benefits and disadvantages of
using a multisignal approach.
This method also has the advantage of giving so-
lutions to several questions at once. In this case, from
the SSM we were able to identify anomalies, search
for the cyclic pattern underneath the data and make a
sub-sequence match.
6 CONCLUSION AND FUTURE
WORK
In this work, we demonstrated that the application of
the proposed method on motion signals acquired in
cyclic tasks of the industrial context is possible. The
proposed method was able to identify (1) anomalies
during working periods, (2) segment the working pe-
riod in working cycles with similar performance to the
MP algorithm and (3) search for sub-segments of the
working cycle along the working period. The appli-
cation of this method in the ergonomic context can be
of great interest since it can improve the current ap-
proaches of ergonomic evaluations in these scenarios.
This strategy turns the process more flexible, allow-
ing to identify in the working cycle sources of risk
factors. Moreover, this allows not only to compare
the occupational exposure of different workstations
for the same worker but also to compare the occupa-
tional exposure throughout the working period. Fur-
thermore, our method has the potential to decreases
the workload associated with the manual identifying
of working cycles and anomalies while improving the
accuracy of the evaluation.
The proposed method is promising and further in-
vestigation should be made. Improvements can be
made, namely: (1) the size of the SSM can cause
memory errors for signals with a large number of
samples, increasing the memory by a quadratic func-
tion, and this should be optimized; (2) having to per-
form the extraction of a significant number of fea-
tures turns the process slower, so features should be
targeted for the type of signal being analysed; (3) be-
cause of (1) and (2), it was more indicated to not use a
total window overlap, losing resolution and (4) further
research should be made in the usage of multisignals.
The methods used to extract the overall informa-
tion from the SSM can still be improved. The detec-
tion using the similarity function is prone to some er-
rors, as presented in the results, and better methods
can be developed in further research to identify the
presence/absence of diagonals. Eventually, methods
inspired in image processing could be used.
Finally, the SSM could also be used to search for
relevant transitions between blocks. For instance, In
Figure 3, we can visually identify two different blocks
of repeating cycles, therefore the SSM can be used to
detect transitions between workstations as well.
ACKNOWLEDGEMENTS
This work was partly supported by Fundac¸
˜
ao
para a Ci
ˆ
encia e Tecnologia, under projects OP-
BIOSIGNALS 2021 - 14th International Conference on Bio-inspired Systems and Signal Processing
88

ERATOR (ref. 04/SI/2019) and PREVOCU-
PAI (DSAIPA/AI/0105/2019), and Ph.D. grant
PD/BDE/142816/2018.
REFERENCES
Barandas, M., Folgado, D., Fernandes, L., Santos, S.,
Abreu, M., Bota, P., Liu, H., Schultz, T., and Gam-
boa, H. (2020). TSFEL: Time series feature extraction
library. SoftwareX, 11:100456.
Bauters, K., Cottyn, J., Claeys, D., Slembrouck, M., Vee-
laert, P., and van Landeghem, H. (2018). Auto-
mated work cycle classification and performance mea-
surement for manual work stations. Robotics and
Computer-Integrated Manufacturing, 51:139–157.
Bauters, K., Van Landeghem, H., Slembrouck, M., Van
Cauwelaert, D., and Van Haerenborgh, D. (2014). An
automated work cycle classification and disturbance
detection tool for assembly line work stations. In
ICINCO 2014 - Proceedings of the 11th International
Conference on Informatics in Control, Automation
and Robotics, volume 2, pages 685–691. SciTePress.
Bello, J. P., Grosche, P., M
¨
uller, M., and Weiss, R. J. (2018).
Content-based methods for knowledge discovery in
music. In Bader, R., editor, Springer Handbook
on Systematic Musicology, pages 823–840. Springer,
Berlin, Heidelberg.
Bota, P., Silva, J., Folgado, D., and Gamboa, H. (2019). A
semi-automatic annotation approach for human activ-
ity recognition. Sensors, 19:501.
Cutler, R. and Davis, L. (1999). Real-time periodic motion
detection, analysis, and applications. Proceedings of
the IEEE Computer Society Conference on Computer
Vision and Pattern Recognition, 2:326–332.
Cutler, R. and Davis, L. (2002). View-based detection and
analysis of periodic motion. In Proceedings. Four-
teenth International Conference on Pattern Recogni-
tion, pages 495–500. Institute of Electrical and Elec-
tronics Engineers (IEEE). Cutler, R. and Davis, L. S.
(2000). Robust real-time periodic motion detection,
analysis, and applications. IEEE Transactions on Pat-
tern Analysis and Machine Intelligence, 22(8):781–
796.
Foote, J. (2000). Automatic audio segmentation using a
measure of audio novelty. In IEEE International Con-
ference on Multi-Media and Expo, pages 452–455.
Irastorza, E. S., Xabier, and Copsey, S. (2010). OSH in
figures: Work-related musculoskeletal disorders in the
EU — Facts and figures. European Agency for Safety
and Health at Work.
Jatob
´
a, L. C., Großmann, U., Kunze, C., Ottenbacher, J.,
and Stork, W. (2008). Context-aware mobile health
monitoring: Evaluation of different pattern recogni-
tion methods for classification of physical activity. In
Proceedings of the 30th Annual International Con-
ference of the IEEE Engineering in Medicine and
Biology Society, EMBS’08 - ”Personalized Health-
care through Technology”, volume 2008, pages 5250–
5253. IEEE Computer Society.
Lara,
´
O. D. and Labrador, M. A. (2013). A survey on human
activity recognition using wearable sensors. IEEE
Communications Surveys and Tutorials, 15(3):1192–
1209.
Law, S. M. (2019). STUMPY: A Powerful and Scalable
Python Library for Time Series Data Mining. The
Journal of Open Source Software, 4(39):1504.
Lu, C. M. and Ferrier, N. J. (2003). Automated Analysis of
Repetitive Joint Motion. IEEE Transactions on Infor-
mation Technology in Biomedicine, 7(4):263–273.
Lu, C. M. and Ferrier, N. J. (2004). Repetitive Motion Anal-
ysis: Segmentation and Event Classification. IEEE
Transactions on Pattern Analysis and Machine Intel-
ligence, 26(2):258–263.
Machado, I. P., Lu
´
ısa Gomes, A., Gamboa, H., Paix
˜
ao,
V., and Costa, R. M. (2015). Human activity data
discovery from triaxial accelerometer sensor: Non-
supervised learning sensitivity to feature extraction
parametrization. Information Processing & Manage-
ment, 51(2):204 – 214.
Nunes, N., Ara
´
ujo, T., and Gamboa, H. (2011). Two-modes
cyclic biosignal clustering based on time series anal-
ysis. In Proceedings of the International Conference
on Bio-inspired Systems and Signal Processing, pages
257–264.
Paulus, J., M
¨
uller, M., and Klapuri, A. (2010). Audio-based
music structure analysis. In Proceedings of the Inter-
national Conference on Music Information Retrieval
(ISMIR), pages 625–636, Utrecht, The Netherlands.
Rodrigues, J., Belo, D., and Gamboa, H. (2017). Noise de-
tection on ecg based on agglomerative clustering of
morphological features. Computers in Biology and
Medicine, 87:322 – 334.
Rodrigues, J., Gamboa, H., Mollaei, N., Os
´
orio, D.,
Assunc¸
˜
ao, A., Fuj
˜
ao, C., and Carnide, F. (2020).
A genetic algorithm to design job rotation sched-
ules with low risk exposure. In Camarinha-Matos,
L. M., Farhadi, N., Lopes, F., and Pereira, H., editors,
Technological Innovation for Life Improvement, pages
395–402, Cham. Springer International Publishing.
Romero, D., Stahre, J., Wuest, T., Noran, O., Bernus, P.,
Fasth, Fast-Berglund, A., and Gorecky, D. (2016). To-
wards an Operator 4.0 Typology: A Human-Centric
Perspective on the Fourth Industrial Revolution Tech-
nologies. In International conference on computers
and industrial engineering (CIE46) proceedings.
Santos, S., Folgado, D., Rodrigues, J., Mollaei, N., Fuj
˜
ao,
C., and Gamboa, H. (2020). Explaining the ergonomic
assessment of human movement in industrial contexts.
In Proceedings of the 13th International Joint Confer-
ence on Biomedical Engineering Systems and Tech-
nologies - Volume 4: BIOSIGNALS,, pages 79–88. IN-
STICC, SciTePress.
Varandas., R., Folgado., D., and Gamboa., H. (2019).
Evaluation of spatial-temporal anomalies in the anal-
ysis of human movement. In Proceedings of the
12th International Joint Conference on Biomedical
Engineering Systems and Technologies - Volume 4
BIOSIGNALS: BIOSIGNALS,, pages 163–170. IN-
STICC, SciTePress.
Self-Similarity Matrix of Morphological Features for Motion Data Analysis in Manufacturing Scenarios
89

Wang, Q., Kurillo, G., Ofli, F., and Bajcsy, R. (2015). Un-
supervised Temporal Segmentation of Repetitive Hu-
man Actions Based on Kinematic Modeling and Fre-
quency Analysis. In Proceedings - 2015 International
Conference on 3D Vision, 3DV 2015, pages 562–570.
Institute of Electrical and Electronics Engineers Inc.
Yeh, C. C. M., Zhu, Y., Ulanova, L., Begum, N., Ding, Y.,
Dau, H. A., Zimmerman, Z., Silva, D. F., Mueen, A.,
and Keogh, E. (2018). Time series joins, motifs, dis-
cords and shapelets: a unifying view that exploits the
matrix profile. Data Mining and Knowledge Discov-
ery, 32(1):83–123.
Zhu, C. and Sheng, W. (2009). Human daily activity recog-
nition in robot-assisted living using multi-sensor fu-
sion. In Proceedings - IEEE International Conference
on Robotics and Automation, pages 2154–2159.
BIOSIGNALS 2021 - 14th International Conference on Bio-inspired Systems and Signal Processing
90
