Multi-level Quality Assessment of Retinal Fundus Images using Deep
Convolution Neural Networks
Satya M. Muddamsetty and Thomas B. Moeslund
Visual Analysis of People Laboratory (VAP), Aalborg University,
Rendsburggade 14, 9000 Aalborg, Denmark
Keywords:
Retinal Fundus Image, Deep-learning, Quality Assessment, Generic Features, CNN, Multi-level Grading.
Abstract:
Retinal fundus image quality assessment is one of the major steps in screening for retinal diseases, since
the poor-quality retinal images do not allow an accurate medical diagnosis. In this paper, we first introduce
a large multi-level Retinal Fundus Image Quality Assessment (RFIQA) dataset. It has six levels of quality
grades, which are based on important regions to consider for diagnosing diabetic retinopathy (DR), Aged
Macular Degeneration (AMD) and Glaucoma by ophthalmologists. Second, we propose a Convolution Neural
Network (CNN) model to assess the quality of the retinal images with much fewer parameters than existing
deep CNN models and finally we propose to combine deep and generic texture features, and using Random
Forest classifier. Experiments show that combing both deep and generic features outperforms using any of the
two feature types in isolation. This is confirmed on our new dataset as well as on other public datasets.
1 INTRODUCTION
The world Health Organization (WHO) estimates that
285 million people across the world are visually im-
paired (Mariotti and Pascolini, 2012). Retinal dis-
eases are diagnosed through different imaging modal-
ities such as Fundus Photography, Optical Coherence
Tomography (OCT), Fluorescein Angiography, Scan-
ning Laser Ophthalmoscopy (SLO) and B-scan ultra-
sonography (Salz and Witkin, 2015). Among these,
fundus photography is the most common procedure
to screen for multiple eye diseases including diabetic
retinopathy (Raman et al., 2018), age related mac-
ular degeneration (AMD) (Grassmann et al., 2018),
glaucoma (Nayak et al., 2009) and other anomalies
associated with retinal diseases, and to monitor their
progression. The fundus image of the retina is cap-
tured using a specialised camera called a fundus cam-
era and the goal is to spot disease-related changes in
the retina to treat them early and save vision/prevent
blindness (Giancardo, 2011). It has been widely used
in telemedicine, natural history studies, and to per-
form research studies on new treatment for eye dis-
ease (Salz and Witkin, 2015).
Retinal fundus image degradation often occurs
during the image capturing process. Inadequate
illumination, noticeable blur, unsharp and over-
brightness are some of the artifacts responsible for
image degradation, which makes medical diagnosis
very difficult for ophthalmologists or automated sys-
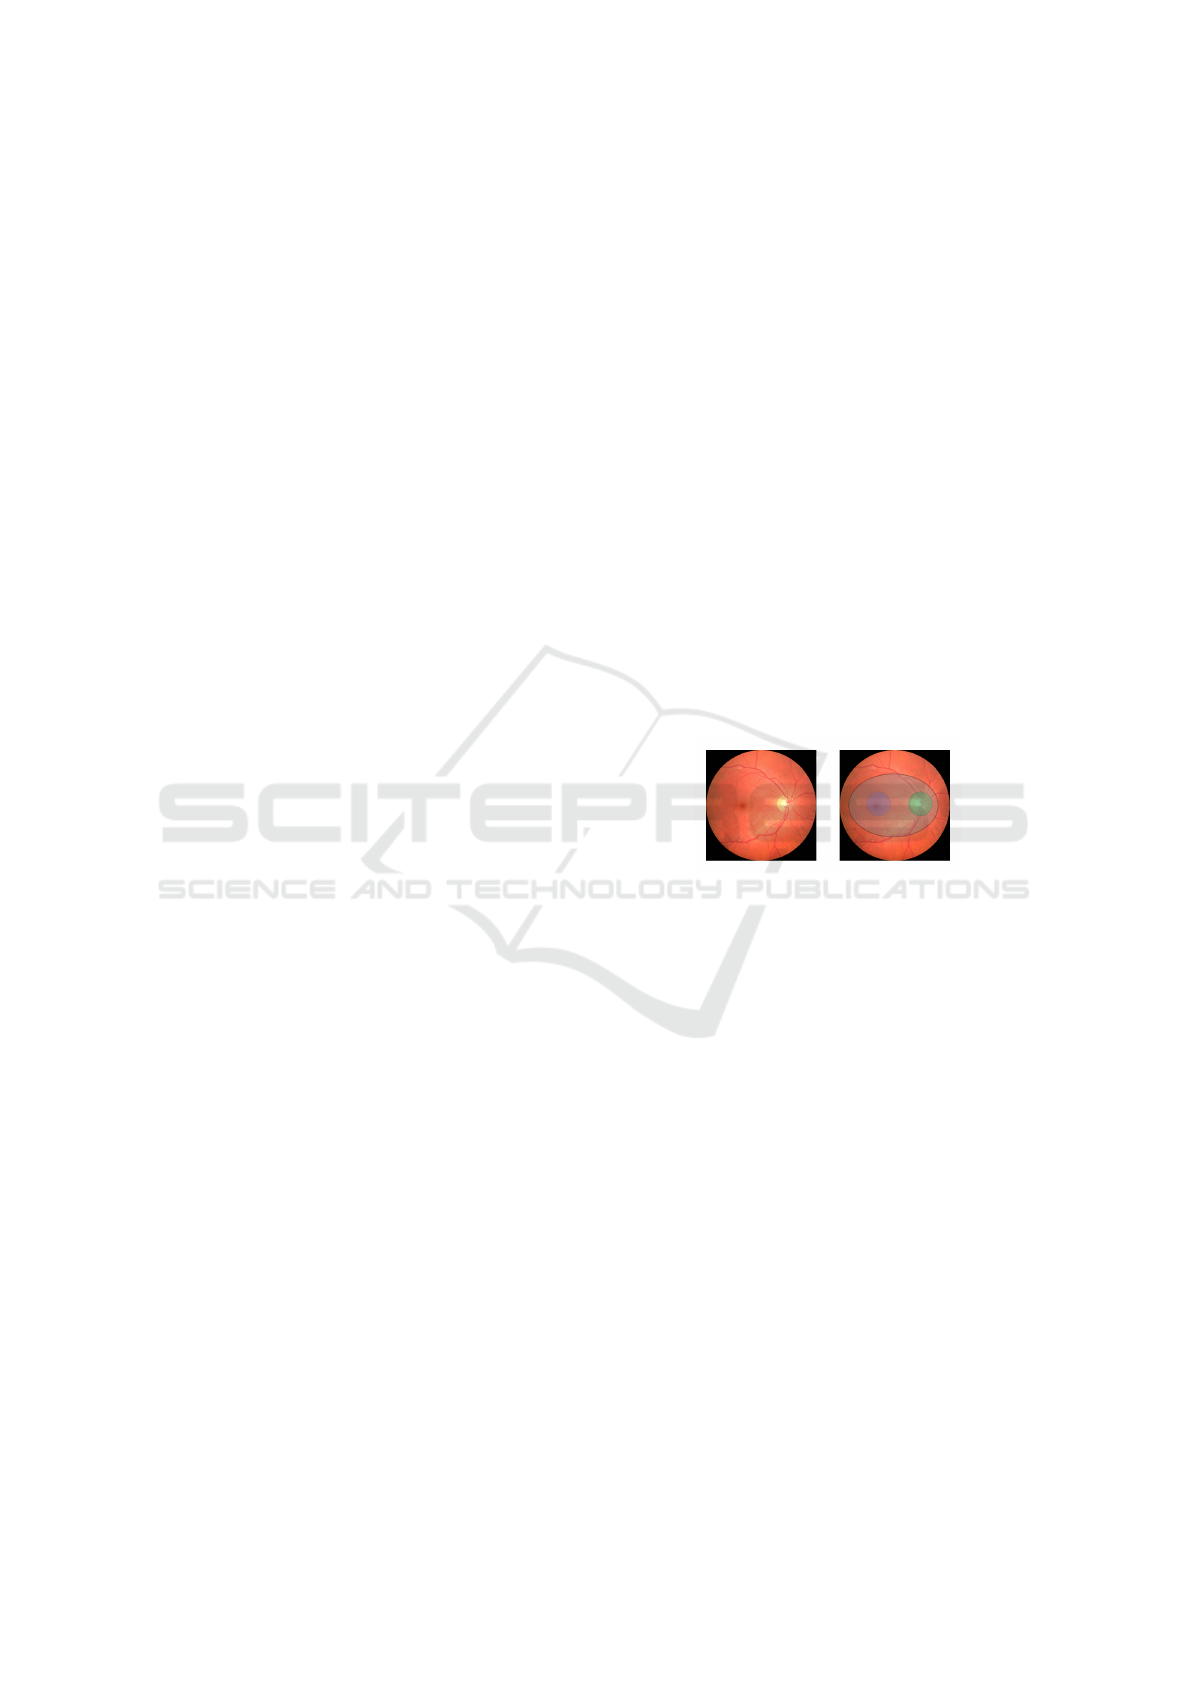
Figure 1: Retina fundus image showing the optical disk
(OD) (green), macula (blue), region surrounding to macula
(gray) and OD.
tems (Fu et al., 2019). Therefore, it is very important
to ensure a good quality of a fundus images. Tra-
ditionally the quality assessment is preformed man-
ually by ophthalmologists and it is very time consum-
ing. Therefore, automated assessment techniques are
needed to assist the experts or an automatic system.
Several methods have been proposed for auto-
mated retinal fundus image quality assessment. They
are broadly classified into three categories: structural,
generic and combine feature based methods. Struc-
tural feature based methods segment the blood vessel
structures to assess the quality of retinal images. In
generic methods simple image features are extracted
without segmenting the structures to asses the reti-
nal image quality and in combination based meth-
ods, both generic and structural features are combined
together for the quality assessment. An example is
Paulus et al. (Paulus et al., 2010) who proposed a
method which performs structural analysis by apply-
ing k-mean clustering on pixel intensities. Sharpness
image contrast is computed and finally combined with
Muddamsetty, S. and Moeslund, T.
Multi-level Quality Assessment of Retinal Fundus Images using Deep Convolution Neural Networks.
DOI: 10.5220/0010250506610668
In Proceedings of the 16th International Joint Conference on Computer Vision, Imaging and Computer Graphics Theory and Applications (VISIGRAPP 2021) - Volume 4: VISAPP, pages
661-668
ISBN: 978-989-758-488-6
Copyright
c
2021 by SCITEPRESS – Science and Technology Publications, Lda. All rights reserved
661

Haarlick features to achieve quality assessment. A re-
cent survey of the above discussed categories can be
found in (Lin et al., 2019).
The recent advancements in deep learning tech-
niques, which integrates multi-level feature represen-
tations, have shown significant performances in dif-
ferent medical imaging applications. In (Saha et al.,
2018; ZAG, 2018), the authors use the pre-trained
models and fine-tune on publicly available datasets to
deal with the quality assessment task. Deep neural
network based methods have solved the feature engi-
neering problems of conventional methods. However,
they need large datasets for training. There are sev-
eral publicly available retinal fundus image quality
assesement (RFIQA) datasets like DR2 (Pires et al.,
2012), DRIMBD (Sevik et al., 2014), HRF (K
¨
ohler
et al., 2013) and ELSA (Aquino et al., 2012), which
consists of 920, 216, 18 and 842 fundus images, re-
spectively, with two levels of grades ’Accept’ and
’Reject’. Huazhu et al. (Fu et al., 2019) presented a
general Multiple Color-space Fusion Network (MCF-
Net) by integrating different color spaces at feature
level and prediction for retinal image quality classifi-
cation and created an Eye Quality (EyeQ) dataset by
re-annotating from the EyePACS dataset (EyePACS,
2015), with three levels of grading ’Good’, ’Usable’
and ’Reject’. However, two or even three levels of
grading are not sufficient to assess the quality. Instead
of disregarding the entire image for grading, a retinal
image can still be assessed for e.g. glaucoma if the op-
tic nerve head is free of artefacts/shadows, while the
macula area can be deemed inassessable due to arte-
facts on the same image. Moreover existing RFIQA
datasets are limited in size and hence not sufficient to
train deep learning methods. The research commu-
nity therefore needs a fine grained multi-level graded
and comprehensive dataset.
Our contributions in this paper are threefold. First,
we create a large multi-level grades RFIQA dataset,
which is annotated by experts (ophthalmologists).
This detailed level of grading benefits fundus cam-
era operator when an image should be retaken and
provides an explanation as to why it should be re-
taken to improve grading possibility. Second, we pro-
pose a baseline CNN model to assess the quality of
multi-level grades retina fundus images and finally
we propose to combine generic and deep features to-
gether and trained with random forest learning meth-
ods. The rest of the paper is organized as follows.
In Section 3 we describe the new RFIQA dataset.
Section 4 describes the proposed deep learning based
RFIQA methodology and combination of generic and
deep features. Section 5 shows performance evalua-
tion of our methods and comparisons of different deep
models and finally, Section 6 provides concluding re-
marks.
2 RELATED WORK
In this section we introduce some of recent state of
art methods of Retinal Fundus Image Quality Assess-
ment. In (Costa et al., ), the authors proposed a Deep
Learning based quality assessment method EyeQual
by learning the patch classifier from a given set of eye
fundus images and corresponding quality labels. This
method classifies the quality of input image and also
returns a heatmap which highlights the location of the
high/low quality patches. The authors formalized the
method by a graphical model view and they illustrated
how to apply it to the image quality assessment prob-
lem. They also proposed a pooling function that suits
the specific task of retinal image quality assessment
better than the existing Max or Average Pooling.
(Jim
´
enez-Garc
´
ıa et al., 2019) proposed an Retinal
Image Quality Assessment (RIQA) method by com-
bining novel generic quality features. Several features
derived from the spatial and spectral entropy-based
quality (SSEQ) and the natural images quality eval-
uator(NIQE) methods were extracted and combined
with novel sharpness and luminosity measures based
on the continuous wavelet transform (CWT) and the
hue saturation value (HSV) color model, respectively.
In addition to that a subset of non-redundant fea-
tures was selected using the fast correlation-based fil-
ter (FCBF) method. Finally, a multilayer perceptron
(MLP) neural network was trained to obtain the qual-
ity of images from the selected features.
In (Lamiaa Abdel-Hamid and Hornegger, 2016),
the authors proposed a transform-based RIQA algo-
rithm to assesses images based on five clarity and
content quality issues namely sharpness, illumina-
tion, homogeneity, field definition, and content. The
sharpness and overall illumination of the images were
evaluated using wavelet-based features. A retinal
saturation channel were used along with wavelet-
based features for homogeneity assessment. The
presented sharpness and illumination features were
used to guarantee adequate field definition and finally
color information was used to exclude non retinal im-
ages. (Lamiaa Abdel-Hamid and Hornegger, 2016)
claim that transform-based RIQA algorithms have the
advantage of considering retinal structures while be-
ing computationally very low.
The authors in (Fu et al., 2019) proposed a Multi-
ple Color-space Fusion Network (MCF-NET) which
combines the different color-spaces representations
at a feature-level and prediction-level to predict im-
VISAPP 2021 - 16th International Conference on Computer Vision Theory and Applications
662
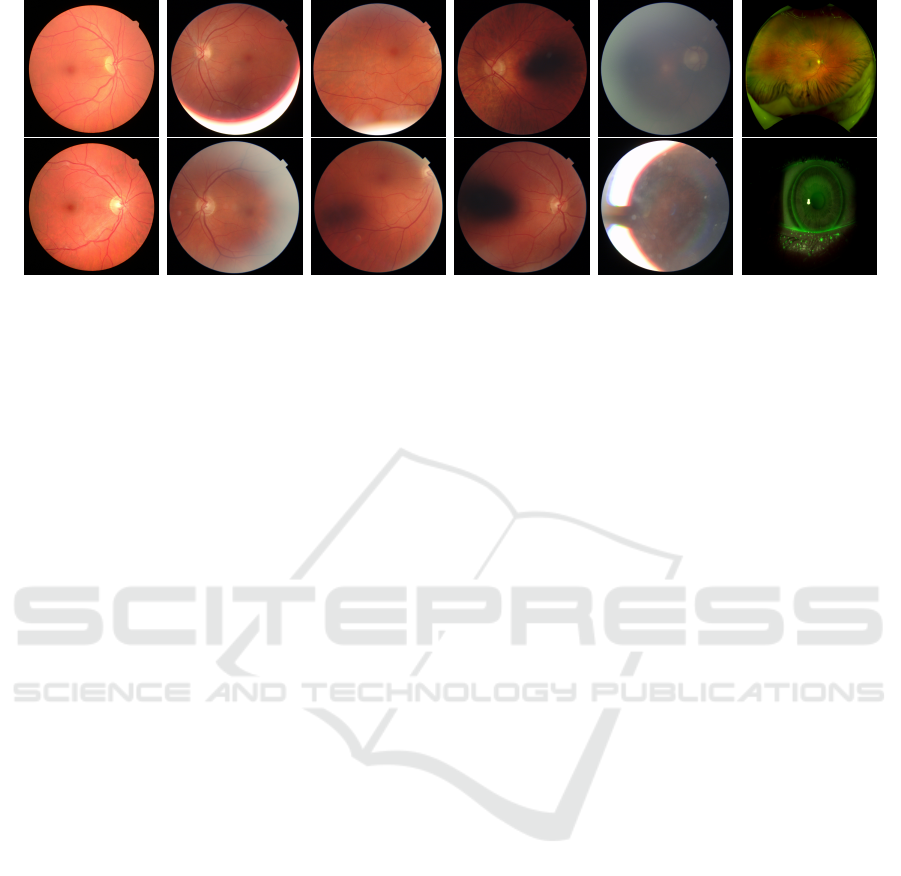
(a) (b) (c) (d) (e) (f)
Figure 2: Examples of different quality grades of RFIQA dataset.(a) Grade0, (b) Grade1, (c) Grade2, (d) Grade3, (e) Grade4
(f) Grade5.
age quality for RIQA and discussed about the influ-
ences of different color-spaces in deep networks on
RIQA. They also re-annotated an Eye-Quality (EyeQ)
dataset with 28,792 retinal images selected from the
EyePACS dataset (EyePACS, 2015), with three-level
quality grading system (i.e., ‘Good’, ‘Usable’ and
‘Reject’). EyeQ dataset has the advantages of a large-
scale size, multi-level grading, and multi-modality.
In (Saha et al., 2018) an automated method was de-
veloped to determine the image quality during ac-
quisition in the context of diabetic retinopathy (DR).
The method explicitly applied machine learning tech-
niques to access the image and to determine ‘accept’
and ‘reject’ categories. ‘Reject’ category image re-
quires a recapture. A deep convolution neural net-
work was trained to grade the images automatically.
A large set of 7000 colour fundus images was ob-
tained from the EyePACS dataset (EyePACS, 2015).
It is annotated by three retinal image experts to cate-
gorise these images into ‘accept’ and ‘reject’ classes
based on the definition of image quality in the con-
text of DR. (Fasih et al., 2014) proposed an algorithm
for retinal image quality assessment based on generic
features independent from segmentation methods. It
computes the local sharpness and texture features by
applying the cumulative probability of blur detection
metric and run-length encoding algorithm, respec-
tively. The quality features are combined to evalu-
ate the image’s quality for diagnosis purposes. Based
on the recommendations of medical experts and expe-
rience. To classify images to ’gradable’ and ’ungrad-
able’ classes, support vector machine with radial basis
functions was used as a nonlinear classifier.
Most of the current existing approaches are based
exclusively on generic features or structural features
or a combination. These methods are designed and
can work better for limited and specific set of reti-
nal image dataset. Deep learning based methods have
shown significant performance to overcome the prob-
lem. In this study we present an ensemble approach
that combines CNN features and generic features such
as texture and sharpness. The proposed method bene-
fited by utilizing the domain knowledge of CNN and
generic features and shown significant performance
than using individual features as will be shown in the
experimental results in Section 5
3 RETINAL FUNDUS IMAGE
QUALITY ASSESSMENT
(RFIQA) DATASET
The existing state-of-the-art datasets DRIMBD (Se-
vik et al., 2014), DR2 (Pires et al., 2012),
ELSA (Aquino et al., 2012), HRF (K
¨
ohler et al.,
2013) and EyeQ (Fu et al., 2019) has only 2 or 3 cate-
gories of quality grades, which is not how opthomolo-
gist do when they assess whether or not the quality of
an image is sufficient. Instead they use six categories
of quality grades, which are rooted in the visibility of
the major anatomic features in the fundus, namely the
optical disk, the macula and the region surrounding to
macula which is shown in Fig 1. Moreover when an
image is found to have too low quality, it is important
to understand why, so the appropriate action can be
taken by the doctor and/or equipment when a new im-
age is captured. To address these issues we introduce
our new RFIQA dataset with six categories. The six
categories are defined as follows, see Figure 2:
Grade 0 (Good): if all major areas such as the op-
tical disc, the macula and the periphery are properly
visible. It can be acceptable for medical analysis.
Grade 1 (Good; Periphery Not Visible): if the pe-
riphery (border regions of the retina) is not clearly
visible. Such images are still accepted for diagnos-
Multi-level Quality Assessment of Retinal Fundus Images using Deep Convolution Neural Networks
663
Table 1: Summary of our RFIQA dataset.
Classes No of Images
Grade0 5444
Grade1 1817
Grade2 158
Grade3 1058
Grade4 1449
Grade5 19
ing diseases as the main structures such as the optical
disc, the macula, and the regions near the macula are
clear enough to be identified by ophthalmologist.
Grade 2 (Bad; Optical Disc Not Clearly Visible):
if the optical disc of the retina is not clearly visible
then the retinal image has a serious quality issue and
cannot be used to provide a full and reliable diagnosis,
even by ophthalmologists.
Grade 3 (Bad; Macula Area Not Clearly Visible):
if the macula region of the retina is not clearly visible
due to shadow on this region, it cannot be used for
analysis as the macula region is considered as one of
the important regions.
Grade 4 (Bad; Unsharp, Blinking, Big Reflections,
Over Exposure): if the image is overexposed which
is characterized by the milky-white layer from the pe-
riphery and towards the center. Apart from this if the
image is unsharp and has reflections then it is also
considered as bad quality grade 4.
Grade 5 (Bad; Miscellaneous): if it is not containing
the actual retina or if it is a different image modality
such as SLO, OCT, etc.
For the new multi-grading dataset, we collected
a large and diverse retinal image dataset with 9,945
fundus images captured by different types of fundus
cameras and under a variety of imaging conditions
from various patients with different retinal diseases.
A summary of this RFIQA dataset is listed in Table 1
and sample images of the six levels of quality grading
are shown in Fig 2.
4 METHODOLOGY
In this section, we introduce a baseline retinal fun-
dus image quality assessment methodology based on
a deep CNN model and generic features. The pro-
posed CNN model is described in Section 4.1 and
the proposed combined models is described in Sec-
tion 4.3.
4.1 Deep CNN Model
CNN has been very successful in visual object recog-
nition (Russakovsky et al., 2015). Training deep
existing CNN models from scratch requires huge
amount of labeled data, which is often difficult to ob-
tain for medical applications due to limited resources
(experts) for annotating the data and patient privacy
issues. Therefore, we propose a CNN model in-
spired by VGG16 (Simonyan and Zisserman, 2014)
with about 29.3 million parameters - much fewer than
complicated standard CNNs models (Szegedy et al.,
2015; Szegedy et al., 2016). Our CNN model con-
sists of totally 25 layers. Among these eighteen are
convolution layers and five are max-pooling layers.
A RELU non-linearity activation function is used for
every convolution layer. A global average pooling
layer(GAP) is added after the high level feature ex-
traction convolution layer followed by Fully Con-
nected (FC) soft-max layer. The input layer size for
this network is 587 ×587. The number of filters used
in our network are 32, 64, 128, 256, 512 and 1024,
respectively. The convolution kernel sizes used in the
model are 4 ×4 and 3 ×3 and Max-Pooling layers
have kernel size of 3 ×3. A global average pooling
is applied to last convolution layer. The final features
are flattened before passing through the FC softmax
layer. The architecture of the proposed baseline CNN
is listed in Table 2. The training procedures are de-
scribed in section 4.2.
4.2 Training
The proposed methodology is trained on our RFIQA
dataset described in Section 3. The dataset is split
into 80% training, 10% validation and 10% testing.
Data augmentation is performed on the training sam-
ples. We apply image transformations such as random
rotation, width shift, height shift, zooming, horizon-
tal flipping and scaling to the RFIQA training sub-
set to enlarge the dataset. The CNN model is trained
over 120 epochs with batch size of 3. We use cate-
gorical cross entropy as a loss function and SGD as
optimizer with learning rate 10
−4
and momentum as
0.9. The proposed CNN model is initialized with ran-
dom weights and trained on the RFIQA dataset. The
framework is implemented on Tensorflow keras with
GPU memory of 11GB, Nvidia, RTX 2080Ti.
4.3 Combined Model with CNN and
Generic Features
In this section we describe our combined method
which is illustrated in Fig 3. The proposed method
retinal quality assessment method consists of three
steps. In the first step we do pre-possessing for the
input image. The features are extracted then concate-
nated in the second step and finally the concatenated
VISAPP 2021 - 16th International Conference on Computer Vision Theory and Applications
664
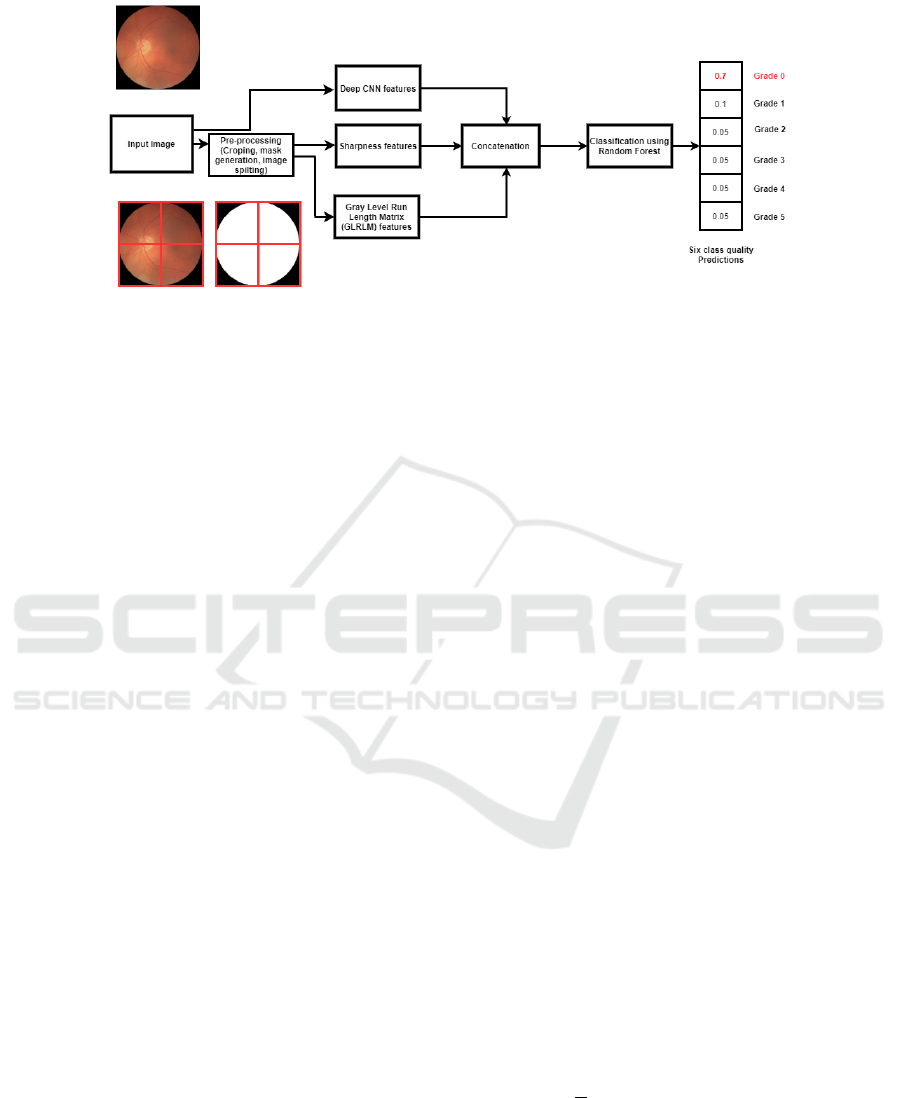
Figure 3: Proposed Combined Model with CNN and generic features.
features are given to a Random Forest classification
algorithm in order to classify them.
4.3.1 Pre-processing
The prepossessing step can be further divided into re-
gions of interest (ROI) detection and generating the
mask for the retina. The ROI detection filters the
background black region and the retinal mask is gen-
erated using Hough Circle Transform (Fu et al., 2019)
and finally the cropped image and generated mask is
divided into four patches shown in Fig 3. The features
are then extracted on each image patch described in
section 4.3.2.
4.3.2 Feature Extractions
In this step, we first extract features from CNN model
described in 4.1. For the given input image, the pre-
dictions are computed using trained CNN model and
these predictions are used as CNN features. Generic
features such as sharpness and textural features are
extracted since these two features very important for
retinal fundus image quality assessment. We extract
the sharpness feature based on Cumulative Probabil-
ity of Blur Detection (CPCD) (Narvekar, 2009). The
steps involved in this method are edge detection fol-
lowed by estimating the probability of detecting blur
at the detected edges. A probability density function
for the obtained probabilities is calculated from which
the final cumulative probability of blur detection is
obtained. The obtained CPCD values given the sharp-
ness’s of the image. We choose to use Gray Level
Run Length Matrix (GLRLM) texture features in our
method as they performed very well in medical image
application (Florez et al., 2018). A Gray Level Run
Length Matrix (GLRLM) measure gray level runs,
which are defined as the length in number of pixels, of
consecutive pixels that have the same gray level value.
In a gray level run length matrix P(i, j|θ), the (i, j)
th
element describes the number of runs with gray level
i and length j occur in the image (ROI) along angle θ.
The value of a feature is calculated on the GLRLM for
each angle individually and finally the mean of these
values is returned. The extracted sixteen GLRLM fea-
tures are short run emphasis, long run emphasis, gray
level non-uniformity, gray level non-uniformity nor-
malized, run length non-uniformity, run length non-
uniformity normalized, run percentage, gray level
variance, run variance, run entropy, low gray level run
emphasis, high gray level run emphasis, short run low
gray level emphasis, short run high gray level empha-
sis, long run low gray level emphasis, long run high
gray level emphasis. The GLRLM features are ex-
tracted after the dot product of original image patch
and corresponding mask.
4.3.3 Classification
We choose Random Forest classifier to ensemble
CNN and generic features. A Random Forest (RF)
is an ensemble classifier that is widely used in the lit-
erature due to its capability to perform both classifi-
cation and feature selection simultaneously (Breiman,
2001). It can be suitable for dealing with noisy,
high dimensional and imbalanced data. It is robust
against over-fitting, which is relevant when having
small training sets. We train this classifier using our
concatenated feature vector. RF is a ensemble of T
decision trees which are learned from T examples
that are randomly sampled with replacement from our
training set S. Each node in a tree corresponds to a
split made using the best of a randomly selected sub-
set of m =
√
p features, where p is the dimensionality
of the feature vector. The quality of the split depends
on the decrease in the Gini index that the split pro-
duces (Breiman, 2001).
Multi-level Quality Assessment of Retinal Fundus Images using Deep Convolution Neural Networks
665
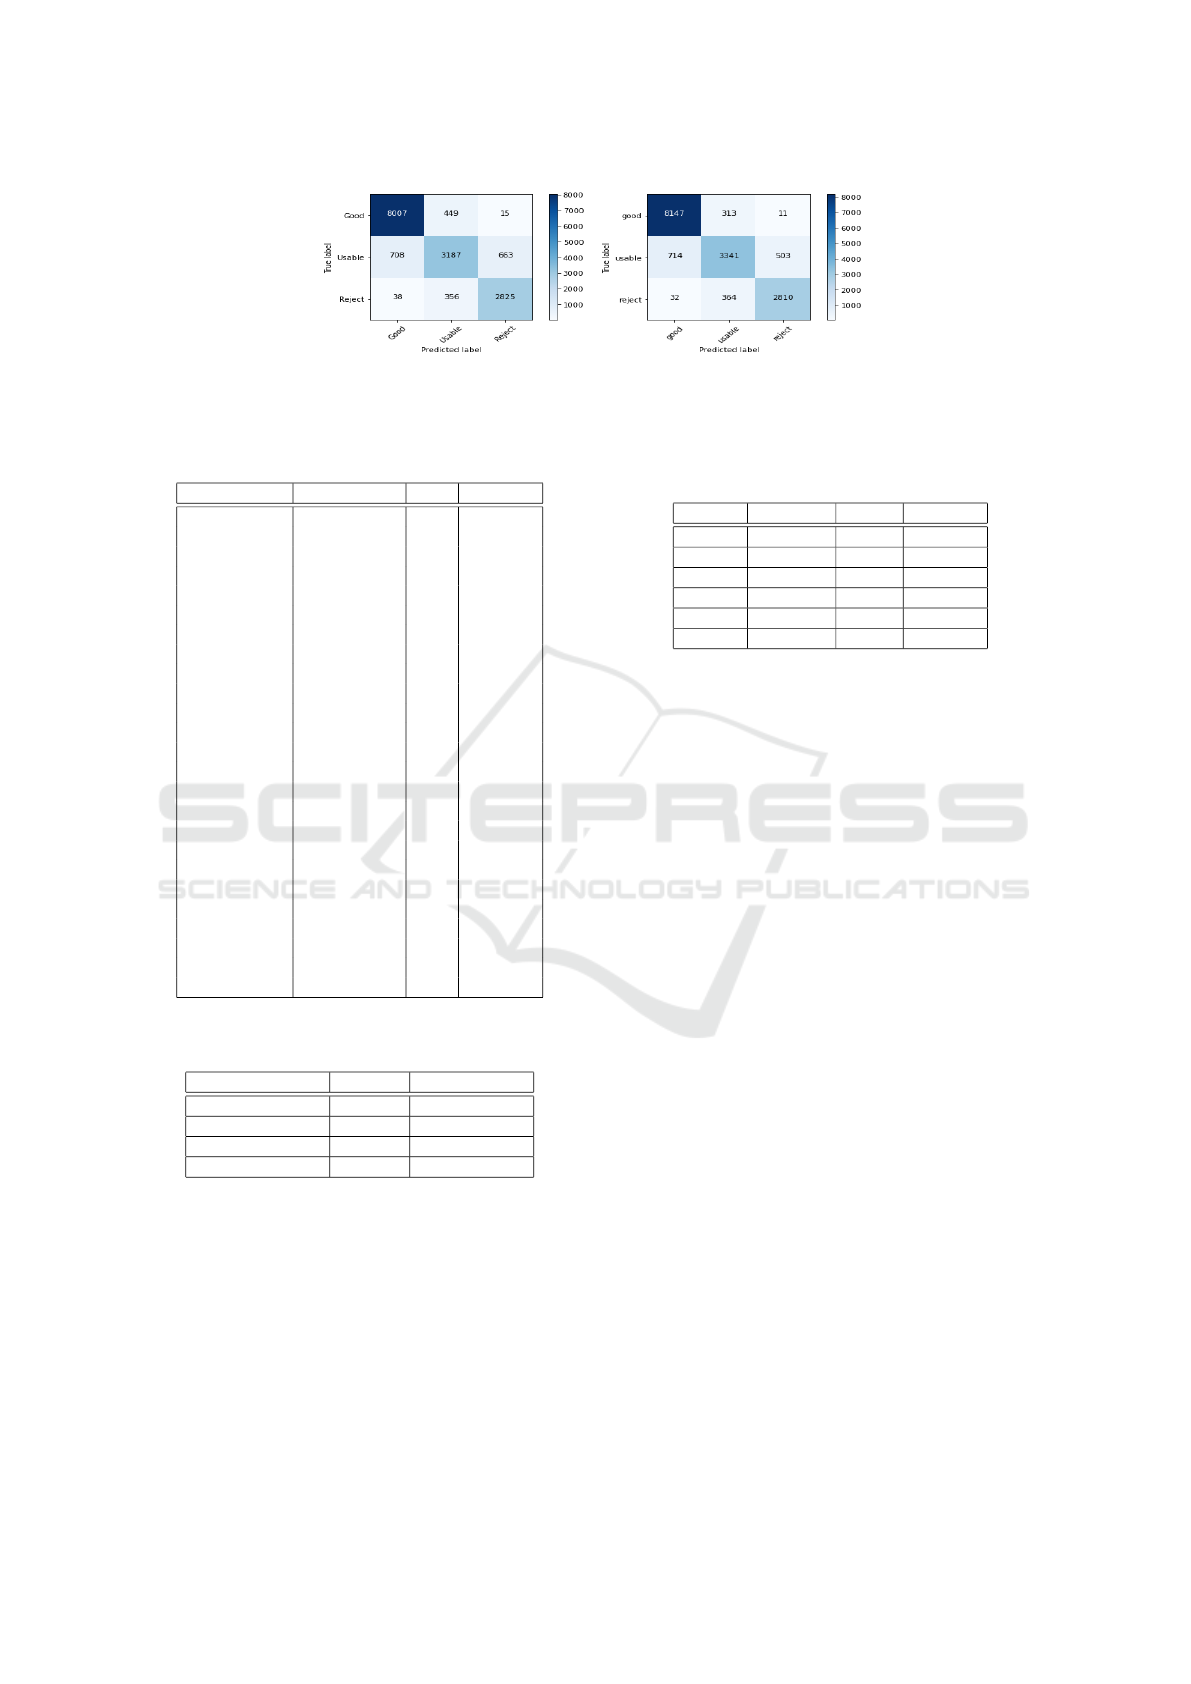
(a) (b)
Figure 4: Confusion Matrix of CNN and Combine model (CNN+GLRLM+SHARP) features on EyeQ dataset with three
classes ’Good’, ’Usable’ and ’Reject’.(a) CNN Model, (b) Combined Model.
Table 2: Proposed CNN model architecture.
Layers No of Filters Size 0utput
Conv1 32 4 294x294
Conv1 32 4 147x147
Conv1 32 3 147x147
Maxpool2 32 3 73x73
Conv2 64 4 73x73
Conv2 64 4 73x73
Conv2 64 3 73x73
Maxpool2 64 3 36x36
Conv3 128 4 36x36
Conv3 128 4 36x36
Conv3 128 3 36x36
Maxpool3 128 3 17x17
Conv4 256 4 17x17
Conv4 256 4 17x17
Conv4 256 3 17x17
Maxpool4 256 3 15x15
Conv5 512 4 15x15
Conv5 512 4 15x15
Conv5 512 3 15x15
Maxpool5 512 3 7x7
Conv5 1024 4 7x7
Conv5 1024 4 7x7
Conv5 1024 3 7x7
GAP 1024 1x1024
FC-Soft-max 6 1x6
Table 3: Evaluation of Deep learning models on RFIQA
dataset.
Model Val Acc Test Accuracy
Resenet-50 0.82604 0.79
Inception-V3 0.84512 0.80
Inception-Resnet 0.83502 0.79
Proposed CNN 0.84848 0.80
5 EXPERIMENTAL RESULTS
In this section we evaluate the performance of the
proposed CNN model and Combined model.The pro-
posed CNN model is evaluated on our novel RFIQA
dataset described in Section 2 and the publicly avail-
able EyeQ dataset (Fu et al., 2019) which has three
classes ’Good’,’Usable’ and ’Reject’. The retinal im-
ages in the two datasets have different characteristics
Table 4: Evaluation of different classes of RFIQA test
dataset.
Class Precision Recall F1-score
Grade0 0.87 0.92 0.90
Grade1 0.77 0.61 0.68
Grade2 0.50 0.06 0.11
Grade3 0.66 0.66 0.66
Grade4 0.69 0.80 0.74
Grade5 0.00 0.00 0.00
collected from large number of patients with retinal
diseases. Four measures recall, precision, accuracy
and F1-score are used to evaluate the performance.
we first compare the performance of the proposed
CNN with three standard CNN models.
To perform the experimental evaluation, we con-
duct two experiments. First, we train the proposed
CNN model described in Section 4 on RFIQA dataset
which has six levels. Since this is the first work
where a truly multi-level grading method is sug-
gested, we cannot directly compare with the work of
others. We therefore train the following more com-
plicated standard CNN models ResNet-50(He et al.,
2015), Inception-v3 (Szegedy et al., 2015), Inception-
ResNet-v2 (Szegedy et al., 2016) and compare the re-
sults with the proposed CNN. For the standard CNN
models we remove the fully connected layer and add
additional layers such as GAP Layer and softmax
layer. During the training of the models we initial-
ize with ImageNet weights and train the whole model
on our RFIQA dataset.
Table 3 summarizes the results obtained by dif-
ferent CNN models on our RFIQA dataset. We can
observe that the best performances obtained are by
the proposed CNN model and Inception-V3 (Szegedy
et al., 2015).even though our model contains far
fewer parameters compared to other models. Ta-
ble 4. summarizes the results obtained on each
class of the best performed model. Analyzing the
classes individually ’Grade0’ has high precision, re-
call, F1-score of 0.87, 0.92 and 0.90, respectively fol-
lowed by ’Grade1’,’Grade4’ and ’Grade3’. Whereas
’Grade5’ and ’Grade2’ achieve low precision, recall,
F1-score values. This can be explained by the fact
VISAPP 2021 - 16th International Conference on Computer Vision Theory and Applications
666
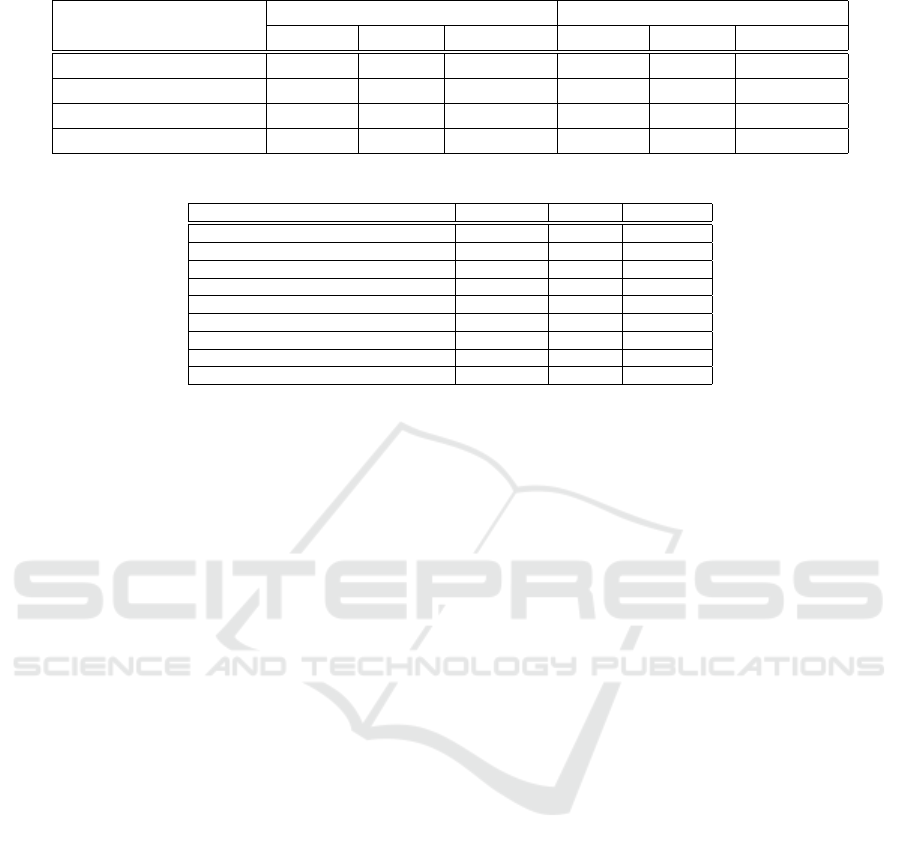
Table 5: Evaluation of Features on RFIQA datset.
Features
Multilevel grades Binary grades
Precision Recall F1-score Precision Recall F1-score
GLRLM (Florez et al., 2018) 0.38968 0.55041 0.41944 0.60281 0.73459 0.64321
Sharpnesss (Narvekar, 2009) 0.55246 0.61728 0.57198 0.74102 0.76541 0.74512
CNN 0.74193 0.76358 0.74839 0.86927 0.86581 0.86725
Combined 0.76150 0.78189 0.77084 0.90238 0.90358 0.90284
Table 6: Evaluation of different methods on the EyeQ dataset.
Model Precision Recall F1-score
Baseline (Wang et al., 2015) 0.740 0.694 0.699
ResNet-18-RGB (Fu et al., 2019) 0.804 0.816 0.808
ResNet-18-HSVB (Fu et al., 2019) 0.801 0.816 0.808
ResNet-50-RGBB (Fu et al., 2019) 0.812 0.807 0.810
Resenet-50-HSVB (Fu et al., 2019) 0.770 0.777 0.773
DenseNet121-RGBB (Fu et al., 2019) 0.819 0.811 0.815
DenseNet121-HSVB (Fu et al., 2019) 0.819 0.811 0.815
Proposed CNN-RGB 0.860 0.862 0.860
Proposed combined model 0.878 0.880 0.878
that ’Grade2’ and ’Grade5’ have insufficient data to
train which is illustrated in Table 1 and it is not suf-
ficient for the model to learn the features for that cat-
egory/grade to classify. Therefore, when the training
dataset is very small of any class of the dataset, test
accuracy will penalize that class and it also shows im-
pact on the overall accuracy of the model.
We conducted a second experiment to show the
importance of combining CNN and generic features.
The experiments are conducted on multi-level and bi-
nary grades. We created a binary grade dataset from
the RFIQA dataset with two classes ’Good’ and ’Bad’
quality. We considered ’Grade0’, ’Grade1’ as ’Good’
and the rest of the grades as ’Bad’. We initialize the
model with the best weights of the first experiment
and train the whole model. Table 5 summarizes the re-
sults obtained by proposed method for the single fea-
ture and multiple feature combining GLRLM (Florez
et al., 2018), Sharpness (Narvekar, 2009) and CNN
features on the multi-level and binary classification.
Analyzing the results with a single feature, we can
see that deep features gives better performance than
GLRLM and Sharpness. From this table we can also
observe that the proposed method using multiple fea-
tures achieves higher performance than using any of
the individual features alone.Thus the combination of
generic features GLRLM, Sharpness and CNN fea-
tures, provides a robust feature extraction for retinal
image quality assessment.
In order to compare the proposed method against
state-of-art quality assessment methods. We train our
model on a public dataset (EyeQ) (Fu et al., 2019).
Table 6 summarizes the results obtained by the pro-
posed models and color space models from (Fu et al.,
2019) and Fig 4 shows the confusion matrix plots of
the proposed models. We can clearly observe the pro-
posed combined model outperforms other methods in
terms of precision, recall and F1-score. It should be
noted that using multiple color spaces is likely to in-
crease the performance further as seen in (Fu et al.,
2019).
6 CONCLUDING REMARKS
In this paper, we proposed an novel retinal fundus
image quality assessment (RFIQA) dataset with a
six-level quality grading annotated by experts. It is
based on important regions to consider for diagnosing
DR, AMD and Glaucoma by ophthalmologist. Our
RFIQA is the first of its kind with multi-level grading
defined by experts and a large-scale size. We also pro-
posed a CNN model with much fewer parameters for
the purpose of RFIQA and a method which combines
both deep features and generic features such as Gray
Level Run Length Matrix (GLRLM) and sharpness.
Experimental results using two different datasets with
different characteristics shows that the combination of
both generic and CNN features performs significantly
better than using only one of them.
ACKNOWLEDGEMENTS
We gratefully acknowledge RetinaLyze System A/S,
Denmark for their support in collecting the dataset.
This work is part of ’Innovative use of Big Data: Deep
Learning-based image analysis’ project, funded by
The European Regional Development Fund (ERDF)
and Central Denmark Region.
Multi-level Quality Assessment of Retinal Fundus Images using Deep Convolution Neural Networks
667

REFERENCES
(2018). Retinal image quality assessment using deep learn-
ing. Computers in Biology and Medicine, 103:64 –
70.
Aquino, E. M., Barreto, S. M., Bensenor, I. M., Car-
valho, M. S., Chor, D., Duncan, B. B., Lotufo, P. A.,
Mill, J. G., Molina, M. D. C., Mota, E. L., et al.
(2012). Brazilian longitudinal study of adult health
(elsa-brasil): objectives and design. American journal
of epidemiology, 175(4):315–324.
Breiman, L. (2001). Random forests. Machine learning,
45(1):5–32.
Costa, P., Campilho, A. J. C., Hooi, B., Smailagic, A., Ki-
tani, K., Liu, S., Faloutsos, C., and Galdran, A. In
ICMLA.
EyePACS (2015). Diabetic retinopathy detection of kaggle.
Available in: https://www. kaggle. com/c/diabetic-
retinopathy-detection/data.
Fasih, M., Langlois, J. P., Tahar, H. B., and Cheriet,
F. (2014). Retinal image quality assessment us-
ing generic features. In Medical Imaging 2014:
Computer-Aided Diagnosis, volume 9035, page
90352Z. International Society for Optics and Photon-
ics.
Florez, E., Nichols, T., Parker, E. E., Lirette, S. T., Howard,
C. M., and Fatemi, A. (2018). Multiparametric-mri
in the assessment of primary brain tumors through ra-
diomic features: a metric for guided radiation treat-
ment planning. Cureus, 10(10).
Fu, H., Wang, B., Shen, J., Cui, S., Xu, Y., Liu, J., and
Shao, L. (2019). Evaluation of retinal image quality
assessment networks in different color-spaces. CoRR,
abs/1907.05345.
Giancardo, L. (2011). Automated fundus images analysis
techniques to screen retinal diseases in diabetic pa-
tients. Theses, Universit
´
e de Bourgogne.
Grassmann, F., Mengelkamp, J., Brandl, C., Harsch, S.,
Zimmermann, M. E., Linkohr, B., Peters, A., Heid,
I. M., Palm, C., and Weber, B. H. (2018). A deep
learning algorithm for prediction of age-related eye
disease study severity scale for age-related macular
degeneration from color fundus photography. Oph-
thalmology, 125(9):1410–1420.
He, K., Zhang, X., Ren, S., and Sun, J. (2015). Deep
residual learning for image recognition. CoRR,
abs/1512.03385.
Jim
´
enez-Garc
´
ıa, J., Romero-Ora
´
a, R., Garc
´
ıa, M., L
´
opez-
G
´
alvez, M. I., and Hornero, R. (2019). Combination
of global features for the automatic quality assessment
of retinal images. Entropy, 21(3):311.
K
¨
ohler, T., Budai, A., Kraus, M. F., Odstr
ˇ
cilik, J., Michel-
son, G., and Hornegger, J. (2013). Automatic no-
reference quality assessment for retinal fundus images
using vessel segmentation. In Proc of the 26th IEEE
international symposium on computer-based medical
systems, pages 95–100. IEEE.
Lamiaa Abdel-Hamid, Ahmed El-Rafei, S. E.-R. G. M. and
Hornegger, J. (2016). Retinal image quality assess-
ment based on image clarity and content. Journal of
Biomedical Optics, 21(9):1 – 17 – 17.
Lin, J., Yu, L., Weng, Q., and Zheng, X. (2019). Reti-
nal image quality assessment for diabetic retinopathy
screening: A survey. Multimedia Tools and Applica-
tions.
Mariotti, A. and Pascolini, D. (2012). Global estimates of
visual impairment. Br J Ophthalmol, 96(5):614–8.
Narvekar, Niranjan D, K. L. J. (2009). A no-reference per-
ceptual image sharpness metric based on a cumulative
probability of blur detection. In International Work-
shop on Quality of Multimedia Experience, pages 87–
91. IEEE.
Nayak, J., Acharya, R., Bhat, P. S., S., N., and Lim,
T. (2009). Automated diagnosis of glaucoma using
digital fundus images. Journal of medical systems,
33(5):337.
Paulus, J., Meier, J., Bock, R., Hornegger, J., and Michel-
son, G. (2010). Automated quality assessment of reti-
nal fundus photos. International Journal of Computer
Assisted Radiology and Surgery, 5(6):557–564.
Pires, R., Jelinek, H. F., Wainer, J., and Rocha, A. (2012).
Retinal image quality analysis for automatic diabetic
retinopathy detection. In SIBGRAPI Conference on
Graphics, Patterns and Images, pages 229–236.
Raman, R., Srinivasan, S., Virmani, S., Sivaprasad, S., Rao,
C., and Rajalakshmi, R. (2018). Fundus photograph-
based deep learning algorithms in detecting diabetic
retinopathy. Eye.
Russakovsky, O., Deng, J., Su, H., Krause, J., Satheesh, S.,
Ma, S., Huang, Z., Karpathy, A., Khosla, A., Bern-
stein, M., Alexander, Berg, C., and Fei-Fei, L. (2015).
ImageNet Large Scale Visual Recognition Challenge.
IJCV, 115(3):211–252.
Saha, S., Fernando, B., Cuadros, J., Xiao, D., and Kana-
gasingam, Y. (2018). Automated quality assess-
ment of colour fundus images for diabetic retinopathy
screening in telemedicine. Journal of Digital Imaging,
31:869–878.
Salz, D. A. and Witkin, A. J. (2015). Imaging in diabetic
retinopathy. Middle East African journal of ophthal-
mology, 22(2):145.
Sevik, U., Kose, C., Berber, T., and Erdol, H. (2014). Iden-
tification of suitable fundus images using automated
quality assessment methods. Journal of Biomedical
Optics, 19(4):1 – 11.
Simonyan, K. and Zisserman, A. (2014). Very deep con-
volutional networks for large-scale image recognition.
arXiv preprint arXiv:1409.1556.
Szegedy, C., Ioffe, S., and Vanhoucke, V. (2016). Inception-
v4, inception-resnet and the impact of residual con-
nections on learning. CoRR, abs/1602.07261.
Szegedy, C., Vanhoucke, V., Ioffe, S., Shlens, J., and Wojna,
Z. (2015). Rethinking the inception architecture for
computer vision. CoRR, abs/1512.00567.
Wang, S., Jin, K., Lu, H., Cheng, C., Ye, J., and Qian, D.
(2015). Human visual system-based fundus image
quality assessment of portable fundus camera pho-
tographs. IEEE transactions on medical imaging,
35(4):1046–1055.
VISAPP 2021 - 16th International Conference on Computer Vision Theory and Applications
668
