
Convolution Filter based Efficient Multispectral Image Demosaicking for
Compact MSFAs
Vishwas Rathi
a
and Puneet Goyal
b
Department of Computer Science and Engineering, Indian Institute of Technology Ropar, Rupnagar, Punjab, India
Keywords:
Demosaicking, Multispectral Filter Array, Interpolation, Multispectral Image, Convolution Filter.
Abstract:
Using the multispectral filter arrays (MSFA) and demosaicking, the low-cost multispectral imaging systems
can be developed that are useful in many applications. However, multispectral image demosaicking is a chal-
lenging task because of the very sparse sampling of each spectral band present in the MSFA. The selection
of MSFA is very crucial for the applicability and for the better performance of demosaicking methods. Here,
we consider widely accepted and preferred MSFAs that are compact and designed using binary tree based
approach and for these compact MSFAs, we propose a new efficient demosaicking method that relies on per-
forming filtering operations and can be used for different bands size multispectral images. We also present new
filters for demosaicking based on the probability of appearance of spectral bands in binary-tree based MSFAs.
Detailed experiments are performed on multispectral images of two different benchmark datasets. Experimen-
tal results reveal that the proposed method has wider applicability and is efficient; it consistently outperforms
the existing state-of-the-art generic multispectral image demosaicking methods in terms of different image
quality metrics considered.
1 INTRODUCTION
Standard color image cameras capture the scene’s
information in only three bands (Red, Green, and
Blue) of electromagnetic spectrum. However, a mul-
tispectral image has more than three spectral bands,
which makes the multispectral image more informa-
tive about the scene than the standard color image.
Therefore, multispectral imaging is discovered valu-
able in many research areas, for example, remote
sensing, medical imaging, food industry, and com-
puter vision (MacLachlan et al., 2017; Pichette et al.,
2016; Qin et al., 2013; Liu et al., 2014; Zia et al.,
2015; Chen and Lin, 2020; Vayssade et al., 2020;
Zenteno et al., 2019; Junior et al., 2019). Contingent
upon the application, there is an alternate prerequi-
site of data to be caught. These numerous prerequi-
sites in various space inspired the manufacturer to de-
velop multispectral imaging (MSI) systems (Fukuda
et al., 2005; Thomas et al., 2016; Geelen et al., 2014;
Martinez et al., 2014; Shrestha et al., 2011; Tsuchida
et al., 2012; Pichette et al., 2016; Ohsawa et al.,
2004; Monno et al., 2015) of varying spectral bands.
a
https://orcid.org/0000-0002-6770-6142
b
https://orcid.org/0000-0002-6196-9347
In the last few years, different MSI systems have
been proposed with different techniques to capture the
multispectral image. These systems can be divided
into three distinctive categories (Monno et al., 2011):
(i) Multi-Camera-One-Shot systems (Ohsawa et al.,
2004; Shrestha et al., 2011), which capture images
utilizing a few cameras with various spectral bands
in a single shot, bringing about a framework that is
very confounded as it requires proper arrangement of
different cameras, and these systems are expensive
as they utilize various cameras. (ii) Single-Camera-
Multi-Shot systems (Fukuda et al., 2005; Chi et al.,
2010), which are used by changing the color filter ar-
ray in front of the imaging sensor or by changing the
lighting source. These requirements restrict the video
capturing using these systems. (iii) Single-Camera-
One-Shot systems (Thomas et al., 2016; Geelen et al.,
2014; Martinez et al., 2014; Monno et al., 2015), sim-
ilar to standard RGB cameras, which overcome the
issues of the first two categories of systems in terms
of cost, size, and video capturing.
The standard RGB camera uses a single sensor to
capture three bands’ information with a color filter ar-
ray (CFA), where only one-pixel value among RGB
values is captured at each pixel location. This cap-
tured mosaic data is called the CFA image, and the
112
Rathi, V. and Goyal, P.
Convolution Filter based Efficient Multispectral Image Demosaicking for Compact MSFAs.
DOI: 10.5220/0010249601120121
In Proceedings of the 16th International Joint Conference on Computer Vision, Imaging and Computer Graphics Theory and Applications (VISIGRAPP 2021) - Volume 4: VISAPP, pages
112-121
ISBN: 978-989-758-488-6
Copyright
c
2021 by SCITEPRESS – Science and Technology Publications, Lda. All rights reserved
1 5 2 5 1 5
4 3 4 3 4 3
5
5
1
4
2
3
4 3
5
5
4 3
5
3
1
2
4
51
43
3
2
4
2 3 1 3 2 3
3 5 3 4 3 5
3
3
2
3
1
5
3 5
3
3
3 4
3
5
2
1
3
32
34
4
1
3
1 2 3 4 5 1
2 3 4 5 1 2
3
4
4
1
2
2
3 1
5
1
3 4
1
2
5
2
1
35
54
5
3
4
2 1
4 3 5 3 4
2
2
1
3
1
7
3 4
2
2
3 6
2
4
1
1
3
21
35
6
1
3
1
3
2 1 2 5 2 3 5 2 4
1 3 1 4 1 2
2
4
4
2
5
3
4 2
1
3
3 1
1
2
3
1
4
35
51
3
2
2
1 2 3 1 2 3
4 5 6 4 5 6
1
2
2
6
3
4
6 6
3
1
5 6
2
5
1
2
4
33
54
5
1
4
(a) (b) (c)
(h)(e) (f)
1 2 3 1 2 3
4 5 6 4 5 6
4
8
5
3
6
1
9 9
6
7
2 3
5
8
4
8
7
99
87
2
7
1
7 8 6 5 7 8
15 16 14 13 15 16
5
12
7
2
6
1
14 16
8
9
3 4
8
16
7
11
15
1210
1513
4
11
3
(d)
(g)
Figure 1: MSFA designs. (a) BTES (Miao and Qi, 2006),
(b) Monno (Monno et al., 2015), (c) Uniform (Aggarwal
and Majumdar, 2014b), (d) Square(Non-redundant) (Mi-
houbi et al., 2015), (e) GAP (Yasuma et al., 2010), (f)
Random (Aggarwal and Majumdar, 2014a), (g) Brauers
(Brauers and Aach, 2006), (h) IMEC (Geelen et al., 2014).
process of forming full color-image from the CFA im-
age by estimating missing band information is called
image demosaicking (Li et al., 2008). One approach
for low cost multispectral imaging system is the ex-
tension of CFA to MSFA. In the MSFA pattern more
than three spectral bands are arranged and complete
multispectral image is generated from an MSFA im-
age using an interpolation method called multispec-
tral image demosaicking (MSID). However, image
demosaicking in multispectral domain is more diffi-
cult and challenging than for RGB images because
of the highly sparse sampling of each spectral band.
Further, the quality of the constructed multispectral
images not only relies upon the demosaicking tech-
nique as well as on the MSFA design used to capture
the MSFA image.
Many color image demosaicking methods have
been proposed (Li et al., 2008; Menon and Menon,
2011), but all of these are restrained to RGB images
only. The existing generic multispectral image de-
mosaicking methods (Miao et al., 2006; Brauers and
Aach, 2006; Aggarwal and Majumdar, 2014b) fail
to generate good quality multispectral images, espe-
cially for higher band multispectral images. The other
multispectral demosaicking methods (Mihoubi et al.,
2017; Monno et al., 2015; Monno et al., 2012; Monno
et al., 2011; Jaiswal et al., 2017) are restricted to a
fixed number of spectral bands multispectral images.
The inspiration of this work is to propose an ef-
ficient and generic MSID approach as the require-
ment of the number of spectral bands is application-
specific. This paper proposes an MSID method uti-
lizing both the spatial and spectral correlation in the
MSFA image. The proposed method uses the pre-
ferred binary-tree based MSFA patterns (Miao and
Qi, 2006), which are considered most compact and
designable for any number of bands in comparison to
non-redundant MSFAs (Brauers and Aach, 2006) and
uniform MSFAs (Aggarwal and Majumdar, 2014b).
We design the filters based on the probability of ap-
pearance (PoA) of spectral bands in the MSFA im-
age and use these PoA based filters to interpolate the
subsampled bands of MSFA image to generate the
complete multispectral image. To further improve
the generated image’s quality, we apply the spectral
difference-based method using filters designed. Ex-
perimental results on multiple datasets show the ef-
ficacy of the proposed MSID method over the other
state-of-the-art generic MSID methods, both quanti-
tatively and visually.
The remainder of this paper is organized as fol-
lows. In section 2, the authors describe the related
works on different MSFA patterns and correspond-
ing MSID methods. In Section 3, the authors present
the proposed method. Section 4 represents the exper-
imental results. Finally, Section 5 presents conclu-
sions and future work.
2 RELATED WORK
In this section, we discuss different MSFA patterns
present in the literature and associated multispectral
demosaicking methods. We divide the basic MSFA
patterns into two categories based on the PoA of
bands in MSFA: (i) Bands with equal PoA; and (ii)
Bands with the different PoA.
2.1 MSFA with Equal PoA of Bands
and Related MSID Methods
Many MSFA designs (Brauers and Aach, 2006; Mi-
houbi et al., 2015; Aggarwal and Majumdar, 2014b)
with equal PoA of bands have been proposed for
MSID. The work (Brauers and Aach, 2006) pro-
posed a six-band non-redundant MSFA pattern as
shown in Figure 1(g) which stores bands in 3 × 2 pat-
tern. Brauers and Aach extended the color-difference-
interpolation of CFA demosaicking to the multispec-
tral domain. But it failed to generate quality multi-
spectral images. Further, (Mizutani et al., 2014) im-
proved Brauers and Aach method by iterating demo-
saicking method multiple times. The number of iter-
ations depended on the correlation between two spec-
tral bands. Later, (Brauers and Aach, 2006) is gen-
eralized for any K-band multispectral images (Gupta
and Ram, 2019).
In (Mihoubi et al., 2015) authors proposed square-
shaped non-redundant MSFA design patterns for 4, 9,
and 16 bands multispectral images as shown in Figure
Convolution Filter based Efficient Multispectral Image Demosaicking for Compact MSFAs
113

1(d). Here, the authors used the concept of panchro-
matic image (intensity image), which is strongly cor-
related with each band than bands considered pair-
wise. Further, Mihoubi et al. in (Mihoubi et al., 2017)
had improved their previous work by proposing a new
estimation of panchromatic image.
Aggarwal and Majumdar proposed two generic
MSFA designs (Aggarwal and Majumdar, 2014b): (i)
Uniform MSFA ( Figure 1(c)) (ii) Random MSFA (
Figure 1(f)). But on higher bands MSID, these de-
signs are not practical because of their non-compact
shape. In (Aggarwal and Majumdar, 2014b), authors
used uniform MSFA for MSID and proposed a lin-
ear demosaicking method that requires the prior com-
putation of parameters using original images. This
limits the efficiency of the method as original images
are not available in real-time. Wang et al. (Wang
et al., 2014) proposed an MSID algorithm that was the
combination of the linear minimum mean square error
method and the residual interpolation algorithm (Kiku
et al., 2013). Linear minimum mean square error is
estimated between the reconstructed and original im-
age using Wiener estimation. Later in the second step,
residual interpolation is used to reduce the artifact of
the reconstructed image. They used uniform MSFA
in the demosaicking process, but their method is not
MSFA design dependent.
2.2 MSFA with Different PoA of Bands
and Related MSID Methods
In work (Miao and Qi, 2006), authors proposed a
generic way to generate MSFA patterns using a binary
tree for any number of bands multispectral images, as
shown in Figure 1(a). Miao et al. in (Miao et al.,
2006) introduced a binary tree-based edge sensing
(BTES) generic method for MSID that used MSFA
patterns formed using (Miao and Qi, 2006). BTES
method uses the same binary tree for interpolation,
which is used to create MSFA. It performs edge sens-
ing interpolation to generate a complete multispectral
image. In spite of the fact that BTES is generic, it
doesn’t perform well on a higher band multispectral
images as it utilizes only spatial connection.
Binary-tree based MSFA patters are effectively
utilized by several other methods (Monno et al., 2015;
Monno et al., 2012; Monno et al., 2011; Monno et al.,
2014; Wang et al., 2013a; Wang et al., 2013b). The
methods (Monno et al., 2015; Monno et al., 2012;
Monno et al., 2011; Monno et al., 2014) used a five-
band MSFA pattern and kept PoA of G-band 0.5,
as shown in Figure 1(b). Monno et. al. (Monno
et al., 2015; Monno et al., 2012; Monno et al., 2011;
Monno et al., 2014) proposed several MSID meth-
ods based on proposed MSFA patterns. In (Monno
et al., 2011), (Monno et al., 2012), and (Monno et al.,
2014), authors adopted the idea of guide image (gen-
erated from under sampled G-band), and later they
applied guide image as a reference image to inter-
polate remaining under-sampled bands based on (He
et al., 2013). (Monno et al., 2011) extended existing
upsampling methods to adaptive kernel upsampling
methods applying an adaptive kernel to reconstruct
each band and later improved in (Monno et al., 2012)
using the guided filter. To further enhance (Monno
et al., 2012), in (Monno et al., 2015), the authors
used multiple guide images for interpolation. This
approach is not practical for a higher band multi-
spectral image. It is restricted to the MSFA pat-
tern where G-band has PoA 0.5, making other bands
severely undersampled in higher band multispectral
image. (Jaiswal et al., 2017) also utilized the MSFA
generated using (Monno et al., 2015) and proposed an
adaptive spectral correlation based MSID method for
five-band multispectral images. The proposed method
uses high-frequency components of the G band to
interpolate other bands using inter-band correlation
analysis.
Few supervised learning-based MSID meth-
ods (Aggarwal and Majumdar, 2014b; Shopovska
et al., 2018; Habtegebrial et al., 2019; Shoeiby et al.,
2020) also had been introduced. However, these
methods demanded the complete multispectral im-
ages for their models’ learning/training parameters,
which are not accessible in the real capturing situ-
ation. In (Aggarwal and Majumdar, 2014b), under-
sample bands are interpolated using linear filtering
with the help of kernel. The parameters of the ker-
nel are computed by applying the Winner estimation.
In work (Shopovska et al., 2018), authors proposed
4-band MSID method based on residual U-Net (Ron-
neberger et al., 2015). In (Habtegebrial et al., 2019),
a convolution neural network-based solution is pro-
posed for image demosaicking. These algorithms are
trained and tested on a similar dataset. This testing
technique does not confirm the efficacy of introduced
deep learning methods in the multispectral domain.
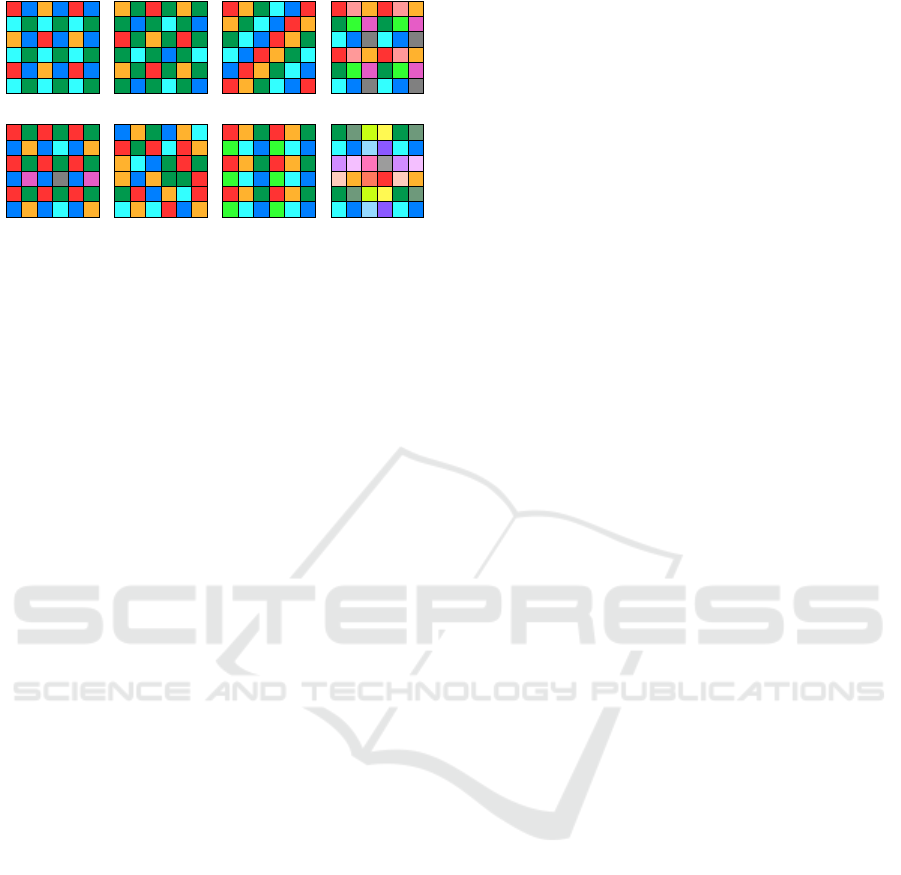
2.3 Our Considered MSFA Patterns
As the effectiveness of MSID methods also depends
on the MSFA patterns, we use binary-tree based
MSFA patters proposed by (Miao and Qi, 2006).
The reason to use them is their compact design,
which makes them suitable for MSID. There are many
MSID methods (Monno et al., 2015; Monno et al.,
2012; Monno et al., 2011; Monno et al., 2014; Wang
et al., 2013a; Pearce et al., 2016; Jaiswal et al., 2017)
VISAPP 2021 - 16th International Conference on Computer Vision Theory and Applications
114

that have proven the efficacy of binary-tree based
methods. We have shown our considered binary-tree
based MSFA patterns in Figure 2.
1
6 3
15
6
52
4
525
3646
1
5 3
17
6
72
4
727
3546
1
5 3
18
6
72
4
827
3546
1
6 4
29
7
83
5
938
4657
1
4 3
15
4
52
3
525
3434
1
8 5
211
9
103
7
11410
6879
1
7 5
210
8
93
6
1049
5768
1
9 5
212
10
113
7
12411
69810
1
9 5
213
11
123
7
13412
610811
1
9 5
214
11
133
7
14413
610812
1
9 5
215
11
143
7
15413
610812
1
9 5
216
11
143
7
15413
610812
MSFA5 MSFA6
MSFA11 MSFA12 MSFA13 MSFA14 MSFA15 MSFA16
MSFA10MSFA9MSFA8MSFA7
Figure 2: Binary-tree based MSFA design used for 5-16
band multispectral image demosaicking.
3 PROPOSED ALGORITHM
In this paper, we propose an MSID method, which
utilizes both spatial and spectral correlation present
in the MSFA image captured by a single camera. The
proposed method can be extended to any K-band mul-
tispectral image. It uses binary-tree based MSFA
pattern (Miao and Qi, 2006) to capture the initial
mosaic image (MSFA image) which is later demo-
saicked using the proposed method to generate com-
plete K-band multispectral image. Binary-tree based
MSFA has the most compact shape as compared
to non-redundant (Gupta and Ram, 2019) and uni-
form MSFA (Aggarwal and Majumdar, 2014a) pat-
tern which makes it more efficient for the demosaick-
ing process. The complete proposed demosaicking
process includes two steps (as shown in Figure 3 (a)):
(i) interpolate missing pixel values using a weighted
bilinear approach and new filters proposed. This step
utilizes only spatial correlation present in MSFA im-
age and it is based on the PoA of each band in MSFA
image; (ii) utilize spectral correlation present in the
image using bilinear spectral difference to further im-
prove the quality of image.
3.1 PoA based Convolution Filter based
Weighted Bilinear
Brauers and Aach gave a filter which is used for
weighted bilinear interpolation to interpolate 6-band
MSFA image generated using non-redundant MSFA
pattern. This technique is generalized by (Gupta and
Ram, 2019) for non-redundant MSFA pattern. How-
ever, they also reported the weak performance of their
generalized weighted bilinear method as these filters
cannot be used to interpolate subsampled MSFA im-
ages generated using the compact MSFAs that are
more preferred. Here, we propose filters based on
PCBSD
EstimatedImage
MSFA Image
PCWB
(a)
(b)
(mosaic image for K bands)
Perform convolution
using the
appropriate filter F
(selected based on
PoA of the band)
Segregate K bands
Combine K bands
Figure 3: (a) Our proposed multispectral demosaicking
method, (b) PoA based Convolution filter based Weighted
Bilinear (PCWB).
PoA of bands in MSFA image and which are used to
interpolate missing pixel values.
3.1.1 Filter Design based on PoA
Each spectral band in the MSFA image has a fixed
PoA and it is pre-decided as per the MSFA design. To
find the missing pixel values of any spectral band, we
design a filter that depends on the PoA of that spec-
tral band in the subsampled MSFA image. Later, we
use these designed filters to generate a complete mul-
tispectral image. Let B
M
= {b
1
,...b
K
} is a set of K
binary masks, each of size M × N, derived from the
basic mosaic pattern; the binary mask b
k
has value 1
only at locations where k
th
band’s original values are
there in the input mosaic image, I
k
MSFA
of size M × N.
To design a filter F that can be used to interpolate
the missing pixel values of a band k in our convolu-
tion based weighted bilinear interpolation approach,
the following properties shall be supported.
1. As the basic mosaic pattern is repeatedly tiled,
horizontally and vertically, and accordingly the
input mosaic images are generated by the image
acquisition system, the convolution filter F must
be symmetric. Considering the center pixel loca-
tion of the filter to be (0,0) and the filter F to be
of size (2p + 1) × (2p + 1),
F(i, j) = F(−i, − j) ∀i, j ∈ (−p, p) (1)
2. To interpolate band k at unknown location (x,y), it
requires at least two known pixels values of band
k in the neighborhood of location (x, y). As the
band’s PoA decreases, the filter size correspond-
ing to that band must increase to accommodate
the minimum required known pixel values for in-
terpolation. For any spectral band with PoA =
1
2
d
,
p = max(1,d − 1) (2)
Convolution Filter based Efficient Multispectral Image Demosaicking for Compact MSFAs
115

3. The insight for this property is that - farther the
known pixel value in the neighborhood of the un-
known value, lesser shall be its weightage in es-
timating the unknown at center. Let (ix,iy) and
( jx, jy) are two locations in the filter F,
i f (dist(ix,iy) > dist( jx, jy)),
F(ix, iy) 6 F( jx, jy) (3)
where, dist() calculates spatial distance from the
center (0,0).
4. We shall not interpolate or say, modify the (orig-
inal) pixel values that have already been sensed.
So, F(0,0) = 1 in order to retain the original value
and to avoid the modification by any known pixel
values that can be possibly present in the neigh-
borhood of the center pixel considered, we shall
have this filter property.
F(i, j) = 0 ∀(i, j) ∈ Ω
1
(4)
where, Ω
1
is the set of those locations within the
neighborhood of and in reference to the central
pixel location (x,y) where b
k
(x,y) = 1 and
Ω
1
= {(u,v) | − p 6 u,v 6 p,(u, v)! = (0,0)
and b
k
(x − u,y − v) = 1}
(5)
5. Consider now any specific location (x,y) where
the pixel value is unknown. This missing value
is aimed to be estimated using the weighted con-
tributions from all the known pixel values in the
neighborhood considered and the weights must be
normalized. In reference to this location (x, y)
where b
k
(x,y) = 0, let us define set Ω
0
to be
the set of those few locations within (2p + 1) ×
(2p + 1) neighborhood around center location
(x,y) where the pixel values of that spectral band
would be known, so
Ω
0
= {(u,v) | − p 6 u,v 6 p
and b
k
(x − u,y − v) = 1}
(6)
For every such location (x,y) where b
k
(x,y) = 0
and the corresponding Ω
0
, the following proper-
ties are to be considered:
F(i, j)! = 0 ∀(i, j) ∈ Ω
0
(7)
and
∑
(i, j)∈Ω
0
F(i, j) = 1 (8)
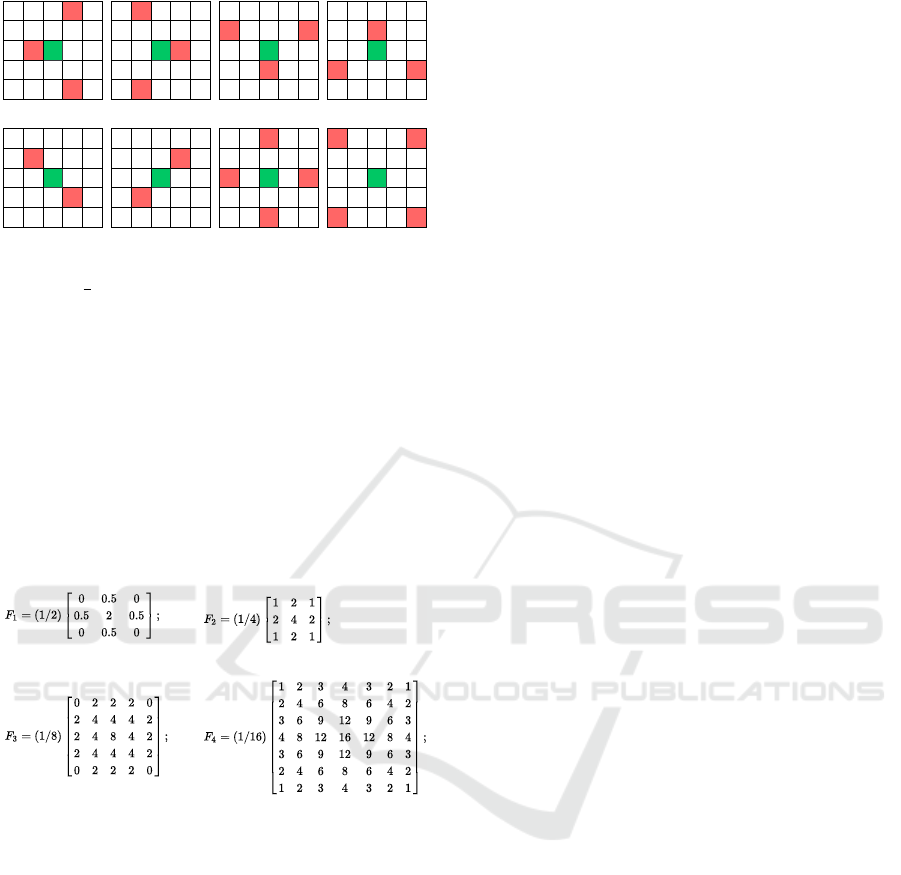
It may appear that we have to explore all possible lo-
cations of the M × N size binary mask for each band
for designing the filters; however, as the binary mask
is prepared using the basic mosaic pattern that is tiled
repeatedly, both horizontally and vertically, and the
mosaic pattern is designed using binary tree based
method, the number of possible configurations to be
explored is 1/PoA. For example, let us consider band
k whose PoA is
1
8
. In Figure 4, we show all possi-
ble pixel arrangements for band k w.r.t. the central
pixel, where band k value has to be estimated in the
image I
k
MSFA
. Figure 4((a) - (g)) show the seven ar-
rangements in which the band k value at center pixel
location is unknown and Figure 4(h) shows the ar-
rangement in which the band k value is already known
at the center. Considering these all possible arrange-
ments and the above mentioned properties, we con-
struct convolution filter F
3
, as shown in Figure 5, and
we use this filter F
3
to interpolate the bands having
PoA
1
8
, in our new approach as described in the next
section. Similarly, by considering all pixels arrange-
ment for bands having PoA
1
2
,
1
4
, and
1
16
, we design
new filters F
1
, F
2
, and filter F
4
, as shown in Figure 5,
to interpolate bands having PoA
1
2
,
1
4
, and
1
16
, respec-
tively.
3.1.2 Interpolation Algorithm
Here, we present PoA based convolution filter based
weighted bilinear (PCWB) algorithm, where appro-
priate filter is selected for a band considering its PoA
in the MSFA image. Presently, we consider upto 16-
band multispectral images and the minimum PoA to
be
1
16
. Accordingly, the algorithm is presented be-
low. Also, the illustration of the interpolation process
is shown in the Figure 3 (b).
Algorithm 1: PCWB.
Input: I
MSFA
, F1, F2, F3, F4, B
M
1 For each band k repeat :
2 I
k
MSFA
= I
MSFA
b
k
3 if (PoA(k) == 1/2)
4
ˆ
I
k
PCW B
= I
k
MSFA
∗ (F1)
5 else if (PoA(k) == 1/4)
6
ˆ
I
k
PCW B
= I
k
MSFA
∗ (F2)
7 else if (PoA(k) == 1/8)
8
ˆ
I
k
PCW B
= I
k
MSFA
∗ (F3)
9 else
10
ˆ
I
k
PCW B
= I
k
MSFA
∗ (F4)
where, I
MSFA
is M × N size input mosaic image for K
bands; B
M
= {b
1
,...b
K
} is a set of K binary masks,
each of size M × N, derived from the basic mosaic
pattern; { F
1
,F
2
,F
3
,F
4
} is a set of filters used for in-
terpolation;
0
∗
0
is Convolution operator; and ’’ is el-
ement wise multiplication operator. The binary mask
b
k
has value 1 only at locations where k
th
band’s orig-
VISAPP 2021 - 16th International Conference on Computer Vision Theory and Applications
116
k
k
?k
k
k?
k
k
?
kk
k
?
k
k
k
k
?
k
?
k
k
k
k?k
k
k
k
k
k
(a)
(b) (c) (d)
(e) (f) (g) (h)
Figure 4: All possible pixel arrangements for k
th
band hav-
ing PoA =
1
8
w.r.t. the central pixel in the binary tree based
MSFAs. (a) - (g) The seven arrangements where k
th
band
value is not known at center (h) The arrangement where k
th
band value is at center.
inal values are there.
ˆ
I
k
PCW B
is interpolated k
th
band.
Image
ˆ
I
PCW B
is generated by combining all interpo-
lated K-bands.
This algorithm is currently presented for upto 16-
band multispectral images but the appropriate filters
can be designed as per the properties discussed earlier
and the algorithm can then be easily extended further
for large number of bands size multispectral images.
Figure 5: Convolution Filters designed for PCWB.
3.2 PoA based Convolution Filter based
Bilinear Spectral Difference
To further improve the quality of image generated us-
ing PCWB, we present PoA based convolution filter
based bilinear spectral difference (PCBSD) method.
The PCBSD method is applicable for binary-tree
based MSFAs and thus generalized to interpolate any
K-band images. It is motivated from color difference
based approach (Brauers and Aach, 2006). Using
ˆ
I
PCW B
as the initial multispectral image, the follow-
ing steps are performed to generate a final interpo-
lated multispectral image
ˆ
I.
1. For each ordered pair (p,q) of bands, determine
the sparse band difference
˜
D
pq
at q
th
band’s loca-
tions.
I
q
MSFA
= I
MSFA
b
q
(9)
˜
D
pq
=
ˆ
I
p
PCW B
b
q
− I
q
MSFA
(10)
2. Now compute the fully-defined band difference
ˆ
D
pq
using PCWB interpolation of
˜
D
pq
.
3. For each band q, estimate
ˆ
I
q
at pixel locations
where b
p
(x,y) = 1 as:
ˆ
I
q
=
K
∑
p=1
I
p
MSFA
−
ˆ
D
pq
b
p
(11)
Now, all K bands are fully-defined and together form
the complete multispectral image
ˆ
I.
4 EXPERIMENTAL RESULTS
4.1 Datasets
We examine the performance of the proposed method
(PCBSD) on different datasets and compare it with
different state-of-the-art methods. To evaluate dif-
ferent multispectral image demosaicking methods,
we use two publicly available multispectral image
datasets, the Cave dataset (Yasuma et al., 2010) and
the TokyoTech dataset (Monno et al., 2015). The
Cave dataset contains 31-band images of 31 scenes
and these bands range from 400nm to 700nm with
a spectral gap of 10nm. The TokyoTech dataset in-
cludes 30 images. Each image has 31-bands, and the
spectral range of these 31-bands is from 420nm to
720nm with a spectral gap of 10nm. Each image is
of size 512 × 512 in the Cave dataset and 500 × 500
in the TokyoTech dataset.
4.2 Quantitative Comparison
We compare different MSID methods on multispec-
tral images with band size (K) varying from 5 to
16. To simulate the K-band ground truth multispec-
tral images, we select K-bands at equal spectral gaps
starting from the first band of the 31-band multispec-
tral images. Then, we perform the mosaicking and
demosaicking process to generate the K-band multi-
spectral image. The demosaicked K-band image is
compared with the ground truth multispectral image
for quality assessment. We compare the proposed
method with other existing generic MSID methods:
WB (Gupta and Ram, 2019), SD (Brauers and Aach,
2006), LMSD (Aggarwal and Majumdar, 2014b),
ISD (Mizutani et al., 2014) and BTES (Miao et al.,
2006). To compare the estimated image’s quality with
Convolution Filter based Efficient Multispectral Image Demosaicking for Compact MSFAs
117

Table 1: Comparison of different MSID methods based on PSNR on the different datasets (K denotes number of bands).
There are a few other MSID methods (Monno et al., 2015; Mihoubi et al., 2017; Jaiswal et al., 2017) as well, but these are
specific to one band only and therefore not considered for comparison.
TokyoTech Cave
K WB SD BTES LMSD ISD PCWB PCBSD WB SD BTES LMSD ISD PCWB PCBSD
5 32.27 33.29 36.79 35.61 33.13 36.92 37.25 34.45 35.36 39.23 40.10 35.23 39.18 39.21
6 35.56 36.37 35.68 33.30 35.55 35.70 36.54 37.26 38.16 38.22 38.65 37.65 38.00 38.57
7 29.79 29.21 34.96 32.72 30.85 34.92 36.01 32.31 32.62 37.68 38.35 33.50 37.39 38.33
8 33.49 34.69 34.58 31.43 34.19 34.51 35.78 35.31 36.71 37.17 37.30 36.59 36.85 38.22
9 34.12 35.35 33.99 25.11 34.58 34.01 35.44 36.00 37.51 36.67 29.58 37.20 36.41 37.99
10 31.91 33.26 33.24 30.36 33.14 33.29 34.74 33.95 35.54 35.87 36.26 35.67 35.70 37.42
11 27.19 28.20 32.56 24.40 28.28 32.64 34.12 29.70 31.05 35.23 28.86 31.36 35.13 36.81
12 32.76 34.35 32.30 25.21 33.92 32.70 34.45 34.66 36.48 34.68 28.95 36.61 34.88 36.91
13 26.69 27.63 31.61 24.58 27.95 32.24 33.99 29.03 30.50 34.16 28.67 31.10 34.50 36.49
14 29.78 31.22 31.67 24.32 31.46 31.81 33.67 32.04 33.80 34.17 28.38 34.30 34.15 36.17
15 31.15 32.64 31.28 24.02 32.63 31.42 33.21 33.38 35.08 33.88 28.26 35.43 33.89 35.76
16 31.06 32.65 30.92 23.85 32.37 31.06 32.96 33.71 35.45 33.67 28.13 35.57 33.70 35.60
Avg 31.31 32.41 33.30 27.91 32.34 33.43 34.85 33.48 34.85 35.89 32.62 35.02 35.82 37.29
Table 2: Comparison of different MSID methods based on SSIM on the different datasets. (K denotes number of bands).
TokyoTech Cave
K WB SD BTES LMSD ISD PCWB PCBSD WB SD BTES LMSD ISD PCWB PCBSD
5 0.9276 0.9367 0.9739 0.9623 0.9361 0.9793 0.9788 0.9620 0.9647 0.9869 0.9864 0.9634 0.9880 0.9845
6 0.9682 0.9737 0.9645 0.9474 0.9734 0.9713 0.9756 0.9816 0.9833 0.9826 0.9809 0.9829 0.9837 0.9828
7 0.8848 0.8821 0.9584 0.9314 0.9018 0.9661 0.9731 0.9380 0.9379 0.9799 0.9778 0.9440 0.9810 0.9826
8 0.9471 0.9601 0.9538 0.9123 0.9621 0.9624 0.9718 0.9690 0.9776 0.9777 0.9716 0.9791 0.9789 0.9832
9 0.9570 0.9653 0.9465 0.7876 0.9642 0.9557 0.9687 0.9752 0.9809 0.9745 0.9044 0.9809 0.9761 0.9816
10 0.9253 0.9464 0.9373 0.8880 0.9525 0.9478 0.9643 0.9583 0.9707 0.9695 0.9611 0.9737 0.9714 0.9791
11 0.8189 0.8435 0.9286 0.7549 0.8441 0.9402 0.9596 0.8987 0.9103 0.9648 0.8837 0.9080 0.9670 0.9763
12 0.9372 0.9555 0.9250 0.7668 0.9572 0.9367 0.9625 0.9645 0.9762 0.9631 0.8788 0.9778 0.9655 0.9788
13 0.7982 0.8294 0.9186 0.7422 0.8345 0.9315 0.9591 0.8864 0.9015 0.9597 0.8738 0.8980 0.9624 0.9767
14 0.8852 0.9208 0.9141 0.7258 0.9338 0.9269 0.9569 0.9362 0.9567 0.9568 0.8615 0.9615 0.9596 0.9755
15 0.9149 0.9394 0.9091 0.7151 0.9454 0.9226 0.9540 0.9521 0.9673 0.9541 0.8595 0.9707 0.9571 0.9737
16 0.9184 0.9349 0.9041 0.7107 0.9340 0.9182 0.9514 0.9547 0.9668 0.9515 0.8503 0.9677 0.9547 0.9725
Avg 0.9069 0.9240 0.9362 0.8204 0.9283 0.9466 0.9647 0.9480 0.9578 0.9684 0.9158 0.9590 0.9704 0.9789
Table 3: PSNR values of sRGB images generated by different MSID methods on the TokyoTech and Cave datasets.
TokyoTech Cave
K WB SD BTES LMSD ISD PCWB PCBSD WB SD BTES LMSD ISD PCWB PCBSD
5 32.48 33.56 37.83 35.77 33.52 38.05 38.52 33.56 34.77 38.32 39.31 34.84 38.15 40.04
6 35.51 36.41 34.90 32.87 35.67 34.80 36.39 38.00 39.71 38.57 39.47 39.33 38.28 40.18
7 30.72 29.30 35.87 33.60 31.79 35.92 37.14 32.93 32.76 38.22 38.97 34.35 37.97 39.85
8 35.14 36.35 36.48 32.46 35.79 36.64 37.76 36.74 38.53 38.76 38.31 38.47 38.56 40.33
9 36.09 37.41 35.83 26.15 36.33 36.15 37.65 37.61 39.76 38.29 30.46 39.14 38.16 40.86
10 33.88 35.25 35.32 31.36 34.95 35.72 36.90 35.83 37.74 37.92 37.38 37.74 37.98 39.99
11 28.64 29.56 34.41 25.76 29.66 34.87 36.06 30.47 31.95 36.81 29.88 32.26 37.01 39.34
12 35.05 36.84 34.81 26.47 35.77 35.57 37.29 37.27 39.72 37.33 30.50 39.25 38.03 40.86
13 27.93 28.91 33.87 25.66 29.15 34.74 36.72 30.06 31.67 36.37 29.78 32.20 37.28 40.07
14 31.92 33.52 33.49 25.41 33.38 34.19 36.40 33.88 36.03 36.12 29.42 36.11 36.62 39.55
15 33.80 35.39 33.38 25.21 34.74 34.09 36.12 35.66 37.94 35.85 29.33 37.65 36.40 39.09
16 33.31 34.82 33.37 25.07 34.28 34.08 36.05 35.70 37.97 35.82 29.29 37.66 36.38 39.03
Avg 32.87 33.94 34.96 28.82 33.75 35.40 36.92 34.81 36.55 37.37 33.51 36.58 37.57 39.93
the original image, we evaluate these methods based
on the PSNR and SSIM image quality metrics.
Tables 1 and 2 show the quantitative performance
of our proposed method on different band’s multi-
spectral images taken from the TokyoTech and Cave
datasets under CIE D65 illumination. WB and BTES
methods have given poor performance, especially on
higher band images, because they only utilize spatial
correlation presents in the image. SD and ISD meth-
ods perform better than the BTES method on 6, 8, 9,
12, 15, and 16 bands multispectral images. However,
the BTES method, using compact (binary-tree based)
MSFAs, performs better for some bands such as 5,
7, 11, and 13. The sharp drop in the performance
for the 5, 7, 11, and 13 band images in WB, SD,
and ISD methods is because of the non-compact as-
pect of the non-redundant MSFAs used in these meth-
ods. This observation was the motivation for the pro-
posed method. The proposed method PCBSD per-
forms better than the other methods on the Cave and
VISAPP 2021 - 16th International Conference on Computer Vision Theory and Applications
118
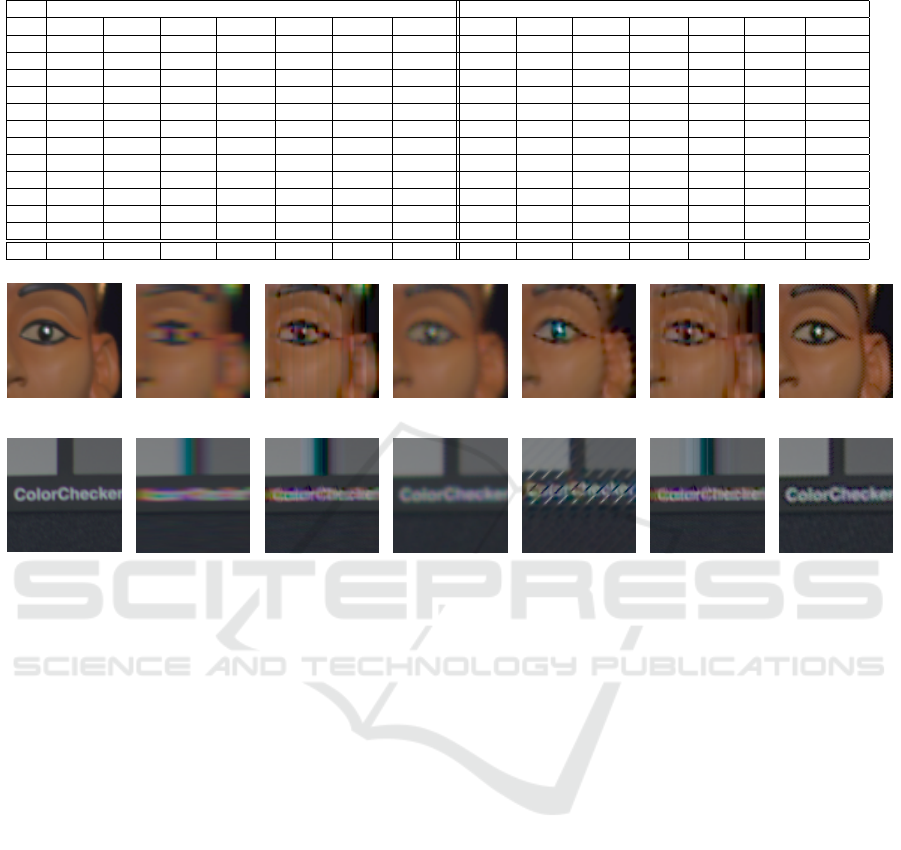
Table 4: SSIM values of sRGB images generated by different MSID methods on the TokyoTech and Cave datasets.
TokyoTech Cave
K WB SD BTES LMSD ISD PCWB PCBSD WB SD BTES LMSD ISD PCWB PCBSD
5 0.9275 0.9380 0.9770 0.9557 0.9377 0.9822 0.9809 0.9527 0.9615 0.9827 0.9813 0.9609 0.9830 0.9876
6 0.9673 0.9735 0.9562 0.9376 0.9733 0.9636 0.9717 0.9802 0.9863 0.9793 0.9769 0.9861 0.9799 0.9856
7 0.8866 0.8674 0.9595 0.9213 0.9034 0.9673 0.9727 0.9364 0.9334 0.9792 0.9748 0.9467 0.9803 0.9864
8 0.9537 0.9660 0.9631 0.9092 0.9667 0.9716 0.9776 0.9731 0.9824 0.9814 0.9707 0.9834 0.9828 0.9880
9 0.9682 0.9741 0.9569 0.7931 0.9701 0.9674 0.9766 0.9795 0.9869 0.9800 0.9005 0.9852 0.9821 0.9897
10 0.9392 0.9569 0.9506 0.8880 0.9599 0.9625 0.9716 0.9660 0.9783 0.9762 0.9608 0.9793 0.9791 0.9861
11 0.8326 0.8545 0.9394 0.7632 0.8547 0.9531 0.9650 0.8997 0.9136 0.9714 0.8844 0.9105 0.9752 0.9839
12 0.9564 0.9689 0.9453 0.7763 0.9636 0.9597 0.9750 0.9742 0.9852 0.9752 0.8814 0.9828 0.9795 0.9894
13 0.8126 0.8421 0.9359 0.8583 0.8454 0.9530 0.9719 0.8880 0.9059 0.9705 0.8735 0.9014 0.9761 0.9875
14 0.9096 0.9384 0.9297 0.7360 0.9443 0.9482 0.9701 0.9470 0.9668 0.9662 0.8611 0.9667 0.9724 0.9862
15 0.9409 0.9569 0.9285 0.7263 0.9558 0.9473 0.9689 0.9657 0.9789 0.9644 0.8603 0.9774 0.9710 0.9848
16 0.9396 0.9491 0.9284 0.7202 0.9437 0.9471 0.9680 0.9660 0.9771 0.9642 0.8536 0.9745 0.9709 0.9845
Avg 0.9195 0.9322 0.9475 0.8321 0.9349 0.9603 0.9725 0.9524 0.9630 0.9742 0.9149 0.9629 0.9777 0.9866
(a
1
) Cropped
(a
2
) WB (a
3
) SD (a
4
) BTES (a
5
) LMSD (a
6
) ISD (a
7
) PCBSD
(b
1
) Cropped
(b
2
) WB (b
3
) SD (b
4
) BTES (b
5
) LMSD (b
6
) ISD (b
7
) PCBSD
Figure 6: Visual comparison of demosaicked images (sRGB) generated from the 7 and 11 bands multispectral images.
the TokyoTech datasets for both the metrics PSNR
and SSIM. Although LMSD performs better on a few
band multispectral images, it uses the same dataset’s
original images for parameter computations but in
real world situation, the original completed images
won’t be available for the MSFA based multispectral
camera and the parameters cannot be therefore com-
puted for that device. Some of the recent methods are
not considered in comparison as unlike the proposed
method, they were not applicable to several different
band-size multispectral images. Overall, the proposed
method provides the improvement by 1.55dB and 1.4
dB in PSNR over the second best performing generic
method - BTES, for the TokyoTech and Cave datasets,
respectively. In terms of SSIM also, an improvement
of around 3% and 1% is observed in comparison to
BTES.
Table 2 presents the SSIM performance compari-
son of the different MSID methods for both datasets.
The SSIM model is consistent with our visual per-
ception. SSIM value close to 1 indicates that the de-
mosaicked image is similar to the ground truth im-
age. The proposed method produces a higher SSIM
in almost all K-band multispectral images for both
datasets.
To estimate colorimetric correctness, we convert
the K-band multispectral images into the sRGB do-
main. To convert into the sRGB domain, we calculate
spectral reflectance images from the demosaicked K-
band multispectral images and convert the reflectance
images to sRGB images using xyz color matching
functions (Monno et al., 2015). Table 3 and Table
4 show the PSNR and SSIM values of sRGB im-
ages generated by different MSID methods on both
datasets. Clearly, the sRGB images generated from
the proposed method have the highest PSNR and
SSIM values among all methods.
4.3 Visual Comparison
Figure 6 shows the visual comparison of the sRGB
images generated by the different MSID methods for
7-band and 11-band multispectral images. We select
smaller portions from multiple sRGB images so that
artifacts should be visible. We can observe that other
existing MSID methods generate significant artifacts,
whereas our proposed method reproduces the sRGB
images more accurately than the other MSID meth-
ods.
Convolution Filter based Efficient Multispectral Image Demosaicking for Compact MSFAs
119

5 CONCLUSIONS
Non-redundant MSFAs are generally non-compact,
which reduce the potency of MSID methods. The
binary-tree based MSFAs are compact and can be
designed for any-band multispectral images. How-
ever, for these compact MSFAs, the existing demo-
saicking methods are either limited in performance
or in generalizability. In this work, we have de-
signed new convolution filters based on PoA of the
bands in the binary-tree based MSFAs, and based on
these filters, we proposed a novel PoA based con-
volution filter based weighted bilinear interpolation
(PCWB) approach. By generalizing the color dif-
ference technique, we finally presented the new ap-
proach, PoA based convolution filter based spectral
difference method (PCBSD) that relies on PCWB for
providing the first estimate and also for estimating the
spectral differences, and thus PCWB is further im-
provised. The new method, PCBSD, is efficient and
can be effectively used for any K-band multispectral
image. Experimental results showed that proposed
MSID methods outperform the exiting generic MSID
methods based on quantitative (PSNR and SSIM) and
visual comparison both on two publically available
datasets. In the future, we plan to extend this convolu-
tion filter approach to extend other image demosaick-
ing methods, and we plan to explore the performance
of the proposed method in the context of applications
of multispectral imaging.
ACKNOWLEDGEMENTS
This research is supported by the DST Science
and Engineering Research Board, India under grant
ECR/2017/003478.
REFERENCES
Aggarwal, H. K. and Majumdar, A. (2014a). Compressive
sensing multi-spectral demosaicing from single sensor
architecture. In Proceedings of IEEE China Summit
International Conference on Signal and Information
Processing, pages 334–338.
Aggarwal, H. K. and Majumdar, A. (2014b). Single-
sensor multi-spectral image demosaicing algorithm
using learned interpolation weights. In Proceedings
of the International Geoscience and Remote Sensing
Symposium, pages 2011–2014.
Brauers, J. and Aach, T. (2006). A color filter array based
multispectral camera. In 12. Workshop Farbbildverar-
beitung, pages 55–64.
Chen, I. and Lin, H. (2020). Detection, counting and
maturity assessment of cherry tomatoes using multi-
spectral images and machine learning techniques.
In Proceedings of International Joint Conference on
Computer Vision, Imaging and Computer Graphics
Theory and Applications( VISIGRAPP), pages 759–
766.
Chi, C., Yoo, H., and Ben-Ezra, M. (2010). Multi-
spectral imaging by optimized wide band illumina-
tion. International Journal of Computer Vision, 86(2-
3):. 140–151.
Fukuda, H., Uchiyama, T., Haneishi, H.and Yamaguchi, M.,
and Ohyama, N. (2005). Development of 16-band
multispectral image archiving system. In Proceedings
of SPIE, pages 136–145.
Geelen, B., Tack, N., and Lambrechts, A. (2014). A com-
pact snapshot multispectral imager with a monolithi-
cally integrated per-pixel filter mosaic. In Proceedings
of SPIE, volume 8974, page 89740L.
Gupta, M. and Ram, M. (2019). Weighted bilinear in-
terpolation based generic multispectral image demo-
saicking method. Journal of Graphic Era University,
7(2):108–118.
Habtegebrial, T. A., Reis, G., and Stricker, D. (2019).
Deep convolutional networks for snapshot hypercpec-
tral demosaicking. In 10th Workshop on Hyperspec-
tral Imaging and Signal Processing: Evolution in Re-
mote Sensing, pages 1–5.
He, K., Sun, J., and Tang, X. (2013). Guided image filtering.
IEEE Transactions on Pattern Analysis and Machine
Intelligence, 35(6):1397–1409.
Jaiswal, S. P., Fang, L., Jakhetiya, V., Pang, J., Mueller, K.,
and Au, O. C. (2017). Adaptive multispectral demo-
saicking based on frequency-domain analysis of spec-
tral correlation. IEEE Transactions on Image Process-
ing, 26(2):953–968.
Junior, J. D., Backes, A. R., and Escarpinati, M. C. (2019).
Detection of control points for uav-multispectral
sensed data registration through the combining of
feature descriptors. In Proceedings of International
Joint Conference on Computer Vision, Imaging and
Computer Graphics Theory and Applications( VISI-
GRAPP), pages 444–451.
Kiku, D., Monno, Y., Tanaka, M., and Okutomi, M. (2013).
Residual interpolation for color image demosaicking.
In Proceedings of IEEE International Conference on
Image Processing, page 2304–2308.
Li, X., Gunturk, B., and Zhang, L. (2008). Image demo-
saicing: A systematic survey. Proceedings of SPIE,
6822:1–15.
Liu, C., Liu, W., Lu, X., Ma, F., Chen, W.and Yang, J.,
and Zheng, L. (2014). Application of multispectral
imaging to determine quality attributes and ripeness
stage in strawberry fruit. PLoS ONE, 9(2):1–8.
MacLachlan, A., Roberts, G., Biggs, E., and Boruff, B.
(2017). Subpixel land-cover classification for im-
proved urban area estimates using landsat. Interna-
tional Journal of Remote Sensing, 38(20):5763–5792.
Martinez, M. A., Valero, E. M., Hern
´
andez-Andr
´
es, J.,
Romero, J., and Langfelder, G. (2014). Combining
transverse field detectors and color filter arrays to im-
VISAPP 2021 - 16th International Conference on Computer Vision Theory and Applications
120

prove multispectral imaging systems. Applied Optics,
53(13):C14–C24.
Menon, D. and Menon, G. (2011). Color image demosaick-
ing: An overview. Signal Processing: Image Commu-
nication, 26(8-9):518–533.
Miao, L. and Qi, H. (2006). The design and evaluation of a
generic method for generating mosaicked multispec-
tral filter arrays. IEEE Transactions on Image Pro-
cessing, 15(9):2780–2791.
Miao, L., Ramanath, R., and Snyder, W. E. (2006). Binary
tree-based generic demosaicking algorithm for mul-
tispectral filter arrays. IEEE Transactions on Image
Processing, 15(11):3550–3558.
Mihoubi, S., Losson, O., Mathon, B., and Macaire, L.
(2015). Multispectral demosaicking using intensity-
based spectral correlation. In Proceedings of the 5th
International Conference on Image Processing The-
ory, Tools and Applications, pages 461–466.
Mihoubi, S., Losson, O., Mathon, B., and Macaire, L.
(2017). Multispectral demosaicing using pseudo-
panchromatic image. IEEE Transactions on Compu-
tational Imaging, 3(4):982–995.
Mizutani, J., Ogawa, S., Shinoda, K., Hasegawa, M., and
Kato, S. (2014). Multispectral demosaicking algo-
rithm based on inter-channel correlation. In Proceed-
ings of the IEEE Visual Communications and Image
Processing Conference, pages 474–477.
Monno, Y., Kiku, D., Kikuchi, S., Tanaka, M., and Oku-
tomi, M. (2014). Multispectral demosaicking with
novel guide image generation and residual interpola-
tion. In Proceedings of IEEE International Confer-
ence on Image Processing, pages 645–649.
Monno, Y., Kikuchi, S., Tanaka, M., and Okutomi, M.
(2015). A practical one-shot multispectral imaging
system using a single image sensor. IEEE Transac-
tions on Image Processing, 24(10):3048–3059.
Monno, Y., Tanaka, M., and Okutomi, M. (2011). Multi-
spectral demosaicking using adaptive kernel upsam-
pling. In Proceedings of IEEE International Confer-
ence on Image Processing, pages 3157–3160.
Monno, Y., Tanaka, M., and Okutomi, M. (2012). Multi-
spectral demosaicking using guided filter. In Proceed-
ings of the SPIE Electronic Imaging Annual Sympo-
sium, pages 82990O–1–82990O–7.
Ohsawa, K., Ajito, T., Komiya, Y.and Fukuda, H., Haneishi,
H., Yamaguchi, M., and Ohyama, N. (2004). Six band
hdtv camera system for spectrum-based color repro-
duction. Journal of Imaging Science and Technology,
48(2):85–92.
Pearce, A. K., Fuchs, A., Fletcher, N., and Thurecht, K.
(2016). Targeting nanomedicines to prostate can-
cer: evaluation of specificity of ligands to two dif-
ferent receptors in vivo. Pharmaceutical Research,
33(10):2388–2399.
Pichette, J., Laurence, A., Angulo, L., Lesage, F.,
Bouthillier, A., Nguyen, D., and Leblond, F. (2016).
Intraoperative video-rate hemodynamic response as-
sessment in human cortex using snapshot hyperspec-
tral optical imaging. Neurophotonics, 3(4):045003.
Qin, J., Chao, K., Kim, M. S., Lu, R., and Burks, T. F.
(2013). Hyperspectral and multi spectral imaging for
evaluating food safety and quality. Journal of Food
Engineering, 118(2):157–171.
Ronneberger, O., Fischer, P., and Brox, T. (2015). U-
net: Convolutional networks for biomedical image
segmentation. In International Conference on Med-
ical Image Computing and Computer-Assisted Inter-
vention (MICCAI), page 234–241.
Shoeiby, M., Armin, M. A., Aliakbarian, S., Anwar, S., and
Petersson, L. (2020). Mosaic super-resolution via se-
quential feature pyramid networks. In Proceedings of
Computer Vision and Pattern Recognition Workshops
(CVPRW), pages 378– 387.
Shopovska, I., Jovanov, L., and Philips, W. (2018). Rgb-
nir demosaicing using deep residual u-net. In 26th
Telecommunications Forum, pages 1–4.
Shrestha, R., Hardeberg, Y., and Mansouri, A. (2011). One-
shot multispectral color imaging with a stereo camera.
In Proceedings of SPIE, volume 7876, page 787609.
Thomas, J.-B., Lapray, P.-J., Gouton, P., and Clerc, C.
(2016). Spectral characterization of a prototype sfa
camera for joint visible and nir acquisition. Sensor,
16:993.
Tsuchida, M., Kawanishi, T., Kashino, K., and Yamato, J.
(2012). A stereo nine-band camera for accurate color
and spectrum reproduction. In ACM SIGGRAPH 2012
Posters, page 18.
Vayssade, J., Jones, G., Paoli, J., and Gee, C. (2020). Two-
step multi-spectral registration via key-point detec-
tor and gradient similarity: Application to agronomic
scenes for proxy-sensing. In Proceedings of Interna-
tional Joint Conference on Computer Vision, Imag-
ing and Computer Graphics Theory and Applications(
VISIGRAPP), pages 103–110.
Wang, C., Wang, X., and Hardeberg, J. (2014). A linear
interpolation algorithm for spectral filter array demo-
saicking. In Proceedings of International Conference
on Image and Signal Processing, volume 8509, pages
151–160.
Wang, X., Thomas, J. B., Hardeberg, J. Y., and Gouton, P.
(2013a). Discrete wavelet transform based multispec-
tral filter array demosaicking. In Proceedings of the
Colour and Visual Computing Symposium, pages 1–6.
Wang, X., Thomas, J.-B., Hardeberg, J. Y., and Gouton, P.
(2013b). Median filtering in multispectral filter array
demosaicking. In Proceedings of SPIE, volume 8660,
page 86600E.
Yasuma, F., Mitsunaga, T., Iso, D., and Nayar, S. (2010).
Generalized assorted pixel camera: Postcapture con-
trol of resolution, dynamic range, and spectrum. IEEE
Transactions on Image Processing, 19(9):2241–2253.
Zenteno, O., Treuillet, S., and Lucas, Y. (2019). 3d cylin-
der pose estimation by maximization of binary masks
similarity: A simulation study for multispectral en-
doscopy image registration. In Proceedings of Inter-
national Joint Conference on Computer Vision, Imag-
ing and Computer Graphics Theory and Applications(
VISIGRAPP), pages 857–864.
Zia, A., Liang, J., and Zhou, J.and Gao, Y. (2015). 3d recon-
struction from hyperspectral images. In Proceedings
of IEEE Winter Conference on Applications of Com-
puter Vision (WACV), page 318–325.
Convolution Filter based Efficient Multispectral Image Demosaicking for Compact MSFAs
121
