
Image Synthesisation and Data Augmentation for Safe Object Detection
in Aircraft Auto-landing System
Najda Vidimlic, Alexandra Levin, Mohammad Loni and Masoud Daneshtalab
School of Innovation, Design and Engineering, Mälardalen University, Västerås, Sweden
Keywords:
Object Detection, Data Augmentation, Synthesised Image, Safety, Situational Awareness.
Abstract:
The feasibility of deploying object detection to interpret the environment is questioned in several mission-
critical applications leading to raised concerns about the ability of object detectors in providing reliable and
safe predictions of the operational environment, regardless of weather and light conditions. The lack of a
comprehensive dataset, which causes class imbalance and detection difficulties of hard examples, is one of
the main reasons of accuracy loss in attitude safe object detection. Data augmentation, as an implicit regular-
isation technique, has been shown to significantly improve object detection by increasing both the diversity
and the size of the training dataset. Despite the success of data augmentation in various computer vision
tasks, applying data augmentation techniques to improve safety has not been sufficiently addressed in the
literature. In this paper, we leverage a set of data augmentation techniques to improve the safety of object
detection. The aircraft in-flight image data is used to evaluate the feasibility of our proposed solution in real-
world safety-required scenarios. To achieve our goal, we first generate a training dataset by synthesising the
images collected from in-flight recordings. Next, we augment the generated dataset to cover real weather and
lighting changes. Introduction of artificially produced distortions is also known as corruptions and has since
recently been an approach to enrich the dataset. The introduction of corruptions, as augmentations of weather
and luminance in combination with the introduction of artificial artefacts, is done as an approach to achieve a
comprehensive representation of an aircraft’s operational environment. Finally, we evaluate the impact of data
augmentation on the studied dataset. Faster R-CNN with ResNet-50-FPN was used as an object detector for
the experiments. An AP@[IoU=.5:.95] score of 50.327% was achieved with the initial setup, while exposure
to altered weather and lighting conditions yielded an 18.1% decrease. The introduction of the conditions into
the training set led to a 15.6% increase in comparison to the score achieved from exposure to the conditions.
1 INTRODUCTION
Object detection is a versatile technology which is
used to solve complex vision tasks, such as face detec-
tion in smartphones (Dave et al., 2010), path planning
and obstacle avoidance for robots (Engelcke et al.,
2017; Ball et al., 2016), surveillance applications in
cities (Alam et al., 2020; Geng et al., 2018), and vi-
sual auto-landing of an aircraft (Zhang et al., 2019).
The performance of the object detector is not
only dependent on the usage of appropriate hardware
and the available computing capabilities to efficiently
solve the task. Knowledge of the applications’ oper-
ational environment and the objects-in-context deter-
mines the performance of the object detector. The fea-
sibility of deploying object detection to interpret the
environment is questioned in several industries and
concerns are raised about the object detector applica-
tions’ ability to provide reliable and safe predictions
of the operational environment, regardless of environ-
mental conditions. In the automotive industry, object
detection has been deployed as a mean to detect and
locate pedestrians, traffic signs, and obstacles to en-
able autonomous driving (Badue et al., 2019). How-
ever, challenges persist in the object detection domain
and were further questioned when a Tesla car operat-
ing in autonomous mode crashed into a truck due to
inability of the object detection system to distinguish
between a white truck and the sky (J.Steward, 2018).
Deploying vision-based object detection in avia-
tion imposes rigorous challenges since it is one of
the most stringent industries, and thus, development
is strictly regulated to ensure system safety. In situa-
tions of reduced visibility or cluttered environments,
enhanced vision through object detection could aid a
pilot in environment interpretation and improve de-
tection of hazardous objects. The operational envi-
ronment of an aircraft during the landing phase has
Vidimlic, N., Levin, A., Loni, M. and Daneshtalab, M.
Image Synthesisation and Data Augmentation for Safe Object Detection in Aircraft Auto-landing System.
DOI: 10.5220/0010248801230135
In Proceedings of the 16th International Joint Conference on Computer Vision, Imaging and Computer Graphics Theory and Applications (VISIGRAPP 2021) - Volume 5: VISAPP, pages
123-135
ISBN: 978-989-758-488-6
Copyright
c
2021 by SCITEPRESS – Science and Technology Publications, Lda. All rights reserved
123
several, both dynamic and static, objects to consider,
and a particular challenge is to assess if a certain ob-
ject could impose a hazardous situation.
The International civil aviation organization
(ICAO) identifies the runway safety-related events
(such as bird strike, ground collision, collision with
an obstacle(s), runway incursion, runway excursion,
etc.) as the majority of flight accidents in 2018 with
contributing 48% of all accidents and 70% of acci-
dents with aircraft substantially damaged or destroyed
(ICAO, 2019). Besides, according to the statistics
on aviation accidents report provided by the Interna-
tional Air Transport Association (IATA) in 2019 (As-
sociation et al., 2019), the low visibility, meteorol-
ogy, and visual misperception are accounted for 16%,
56%, and 6% of runway safety threats, respectively.
Thus, the importance of safe object detection during
the aircraft landing phase is evident (Skybrary, 2017).
Through vision-based object detection, accidents
could possibly be avoided. Proving safe detection
of hazardous objects in aviation is heavily reliant on
broad and diverse data about the operational envi-
ronment to ensure consistent and accurate detection.
To ensure the environment is correctly represented, a
comprehensive and robust data representation which
includes various objects, both dynamic and static, as
well as weather and lighting variations, is highly es-
sential. However, collecting large-scale comprehen-
sive image samples to provide the model with more
information about the learning pattern is extraordi-
narily laborious and resource-demanding. Thus, con-
structing a diverse and robust representation of the
environment of aircraft landing operation using data
augmentation techniques is the goal of this paper. Our
contributions can be summarised as follows:
• Construction of a robust runway detection dataset
to ensure continuous environment interpretation
during aircraft landing operation, regardless of
weather and lighting changes.
• Manual image synthesis to ensure diverse object
representation of the operational environment in
the dataset.
• Applying common data augmentation techniques
including geometric/photometric transformations,
random erasing, sample pairing, etc., to increase
the size of dataset.
• Applying weather and lighting augmentations to
enrich dataset and ensure robust object detection,
regardless of environmental changes.
• Measuring the number of artificial artefacts with
respect to un-distorted images to ensure context-
awareness throughout the dataset.
• Defining an experimental method to compare de-
tection results by considering three scenarios.
In our experiments, we utilised Faster R-CNN
with three different backbones (ResNeXt-101-
FPN, ResNet-101-FPN, and ResNet-50-FPN) as
the object detector due to providing high localisa-
tion accuracy of small objects (Levin and Vidim-
lic, 2020; ?) (Section 5.1)
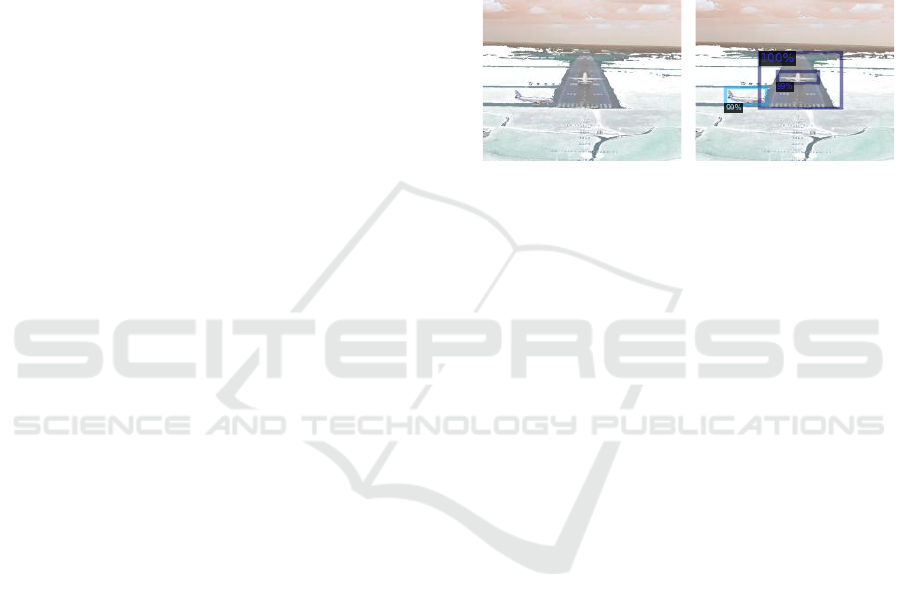
• As illustrated in Fig. 1, the proposed safety
method improves the accuracy of object detection
in situations with bad weather.
(a) (b)
Figure 1: Comparison of object detection capabilities be-
tween one output result without weather and lighting aug-
mentations in training dataset and one with. The input im-
age shows a snowy landscape. (a) Output results trained
without weather and lighting augmentations. (b) Output re-
sults of successful detection trained with data augmentation.
2 BACKGROUND
The interpretation of the operational environment dur-
ing all stages of flight is the pilot’s outermost task.
The correct interpretation is crucial for airborne safety
and part of situational awareness. To visualize the
environment, two primary information sources are
available. The first is provided by visual interpre-
tation, and the second is provided by navigation-
, safety-, and decision support systems. Support
systems such as Automatic Dependent Surveillance-
Broadcast (ADS-B), Traffic Collision Avoidance Sys-
tem (TCAS) and Terrain Avoidance and Warning Sys-
tem (TAWS) that provide knowledge of terrain height,
as well as the position of ground-based and airborne
objects that are in close proximity, could highly re-
duce the risk of collision (Federal Aviation Adminis-
tration, 2017; ?). Applying object detection to inter-
pret, detect and track potentially hazardous objects in
the aircraft’s proximity could provide the necessary
means further to reduce the risk of hazardous situa-
tions within aircraft operations and enhance the situa-
tional awareness for the pilot or perform auto-landing
functions.
Recently, deep learning became a very popular
tool for performing computer vision tasks due to
VISAPP 2021 - 16th International Conference on Computer Vision Theory and Applications
124

yielding higher accuracy, training on any desired in-
put space, and the ease of usability in comparison
with conventional methods (O’Mahony et al., 2019;
Loni et al., 2020).
2.1 Importance of the Dataset
The object detector’s performance is highly depen-
dent on the training data, which is a fundamental part
of the ability to perform meaningful feature extrac-
tion in neural networks (NNs). The model could only
be as good as the data it is trained on. The required
amount of data to build a sufficient prediction model
is dependent on the prediction task complexity. In
general, a comprehensive dataset provides the model
with more information about the learning pattern and
could yield predictions with higher correctness and
accuracy (Shorten and Khoshgoftaar, 2019). A com-
prehensive dataset would need to be both qualitative
and quantitative, including a large amount of data as
well as varying data over the prediction classes. How-
ever, acquiring a comprehensive dataset is an exten-
sive task, or sometimes impossible, which includes
the collection, pre-processing, and annotation steps.
To speed up the development, open-source bench-
mark dataset are publicly available to use for object
detection tasks (Mitsa, 2019), such as MS-COCO
(Lin et al., 2014), Pascal VOC (Everingham et al.,
2010), and ImageNet (Deng et al., 2009). In this pa-
per, we construct a robust runway detection dataset
by combining in-flight recordings and further extend
the dataset by using royalty-free images with relevant
motifs (Section 4).
2.2 Deep Learning Safety Issues
Faria (Faria, 2017) states that the system property de-
terminism is of great importance for the certification
of safety-critical software. Safety-related activities
require indirect evidence of determinism, providing
predictability and in-depth understanding of the soft-
ware. S. Burton et al. (Burton et al., 2017) discuss
the challenges of providing evidence for the safety
case and identified measurable performance criterion;
transparency, environment adaption and dataset com-
prehension to be the critical building blocks affecting
the safety case. Producing test cases for validation of
the applications ability to provide a safe trajectory in
the case of exposure of harmful objects on a runway
could be challenging since the test cases need to cover
a wide range of scenarios to provide evidence to sup-
port claims of acceptably safe. Moreover, the trans-
parent nature of deep learning algorithms affects the
safety and predictability throughout execution needs
to be ensured. Furthermore, S. Burton et al. (Bur-
ton et al., 2017) discusses the importance of the con-
structed dataset of the operational environment and
the impact of details to ensure safety. The context
is of extreme importance to provide safe interpreta-
tion. For example, given a dataset constructed with a
camera lens in a titling-angle, the application in oper-
ation would need to be utilised with the correspond-
ing setup. Also, the constructed dataset needs to be
comprehensive and cover scenarios that describe the
operational environment to a vast extent, without im-
posing hazardous situation while building the repre-
sentation by placing hazardous objects on the airport
runway in during the real flight operations. Accord-
ingly, each of the mentioned parameters need to be
considered, and the outcome of each input needs to be
known to deploy deep learning applications in safety-
critical systems safely.
3 RELATED WORK
To the best our knowledge, this paper presents the
first attempt toward safety enhancement of visual de-
tection system via data augmentation. To guarantee
safety, hazards must be mitigated until an acceptable
level of risk is achieved. By utilising artificial intel-
ligence, new hazards are introduced, and thus higher
demands are placed upon the performance of the in-
troduced parts. NNs are evaluated by their general-
isation performance, how well the models are able
to adapt to new unseen data. Techniques enhanc-
ing generalisation performances of NNs are incorpo-
rated into various architectures with the aim to pro-
duce the most optimal model. In addition to the ar-
chitecture, the scope and diversity of a dataset greatly
inflict upon the generated model’s generalisation ca-
pability. To vary structure, objects, and depiction, as
well as to increase the size and scope of the dataset,
multiple data augmentation techniques have been pro-
posed over the years. Data augmentation techniques
include all modifications of images, including light
manipulations such as flipping, cropping, and contrast
alterations.
3.1 Common Data Augmentation
Techniques
C. Shorten and T.M. Khoshgoftaar (Shorten and
Khoshgoftaar, 2019) describes common used aug-
mentation techniques. The different techniques can
be divided into five categories; geometric transforma-
tion, photometric transformation, kernel filters, ran-
dom erasing, and sample-pairing, where geometric
Image Synthesisation and Data Augmentation for Safe Object Detection in Aircraft Auto-landing System
125

transformation, photometric transformation, and ker-
nel filters acts as umbrella terms as seen in Fig. 2.
Basal augmentations techniques, such as axis flip-
ping, cropping, rotation, and RGB colour space al-
terations are covered by the first umbrella term, geo-
metric transformation. The term also covers transla-
tions, shifting an object’s position within an image up,
down, left or right, and noise injection, alteration of
pixel values by random values. The second umbrella
term, photometric transformation, covers techniques
focusing on alteration of specific pixels, including jit-
tering, edge enhancement, and Principal Component
Analysis (PCA). The first method induces fixed or
random values to the pixel values which temporary
distorts the image, while the second method targets
and characterises the pixel edges of interesting ob-
jects (Taylor and Nitschke, 2017). PCA Color Aug-
mentation is a method introduced in conjunction with
the creation of AlexNet in 2012; the method aims to
identify which RGB colour is most prominent in the
image and thereafter adjust the pixel values accord-
ing to the intensity. Kernel filters, the third umbrella
term, includes Gaussian blur, vertical edge, and hori-
zontal edge filters. Vertical and horizontal edge filters
increase the sharpness of an image, while Gaussian
blur reduces the sharpness (Shorten and Khoshgof-
taar, 2019).
3.2 Data Augmentation to Improve
Accuracy
As a supplement to the well-known augmentation
techniques, several other data augmentation tech-
niques have been proposed to increase the accuracy
and enhance the generalisation performance. The
method Random erasing was presented in 2017 by
(Zhong et al., 2017), followed by SamplePairing in
2018 by (Inoue, 2018). The first method randomly
selects a rectangular area within the image, where a
new randomly generated value modifies each pixel.
By removing fractions of information from images of
the dataset, the model may achieve higher robustness
towards loss of information. SamplePairing, on the
other hand, creates a new image by using two images,
A and B, with two labels, A and B. Each pixel of the
new image is created by taking the average pixel value
of the corresponding pixel values of images A and B.
The new image is labelled according to label A, re-
gardless of image results. (Inoue, 2018) reported a
varied reduction of training and validation error de-
pending on how image B was collected. Collecting
image B without any constraints from the training set
achieved the most superior results.
L.A. Gatys et al. (Gatys et al., 2015) introduced a
Data
Augmentation
of Input Space
Kernel Filters
Sample Pairing
Photometric
Transformation
Random Erasing
Geometric
Transformation
Horizontal Edge
Vertical Edge
Gaussian Blur
Principal Component
Analysis (PCA)
Edge Enhancement
Jittering
Noise Injection
Translation
Rotation
Cropping
Color Space
Flipping
Figure 2: A visualisation of augmentation technique
classes.
more artistic inspired technique, known as style trans-
fer. The method utilises two images, an input image
and a style image, to create a new image with features
of the input image yet influenced by the shapes and
colours of the style image. Style transfer was then
used by R. Geirhos et al. (Geirhos et al., 2018) to in-
vestigate the importance of texture and shape for ob-
ject recognition. Results were unexpected and con-
tradicted what had previously been assumed; object
detectors tended to learn based on textures of objects
rather than the object shape (Geirhos et al., 2018).
Distortion within data augmentation received in-
creased attention, not only distortion of texture by
style augmentation but also by including natural dis-
tortions such as snow, rain, fog, and clouds within the
images. Introduction of artificially produced distor-
tions is also known as corruptions and has since re-
cently been an approach to enrich the dataset in addi-
tion to the earlier discussed augmentation techniques.
Hendrycks and Dietterich (Hendrycks and Dietterich,
2018) performed an experiment to evaluate the im-
pact of introducing corruptions to the test set; 15 cor-
ruption methods were applied in total to conduct the
experiment. Each corruption method had five inten-
sity levels, which resulted in 75 different scenarios.
For the experiment, various NN models were trained
on data from ImageNet. Their results revealed the ro-
bustness capabilities of each trained model, indicating
DenseNet and ResNeXt to be the best models.
Three additional corruption datasets were created
by Michaelis et al. (Michaelis et al., 2019) by imitat-
ing the experiment of Hendrycks and Dietterich, cre-
ating Pascal-C, Coco-C, and Cityscape-C. Further, as
the second test in addition to the reconstructed exper-
iment, style augmented images were introduced dur-
ing training. The results pointed towards increased
robustness capabilities without compromising the ob-
ject detection capability of corruption-free images.
VISAPP 2021 - 16th International Conference on Computer Vision Theory and Applications
126

TRAINING
SET
(EXTENDED40%)
Initialsession Secondsession Thirdsession
TRAINING
SET
(BASE85%)
TESTSET
(BASE15%)
TESTSET
(EXTENDED100%)
TRAINING
SET
(BASE85%)
TESTSET
(BASE15%)
TESTSET
(EXTENDED100%)
TRAINING
SET
(BASE85%)
TESTSET
(BASE15%)
RDT-s
RDTr-s
RDRT-s
RDRTr-s
Figure 3: A visualisation of the experimental setup and the
dataset split for each test session. Where the original per-
centage represents the initial split of the dataset, while the
extended percentage illustrates the percentual increase of
the test set and training set, respectively. The test is divided
in three sessions, where the first provides the base accuracy,
the second the robustness after exposure to variations and
the third will yield result of robustness after inducing varia-
tion in the training data.
4 EXPERIMENTAL SETUP
Three test sessions were performed to establish a base
accuracy, a robustness accuracy, and an enhanced ac-
curacy. The setup of the three tests can be viewed
in Fig. 3. Each test was executed under equal condi-
tions to be able to compare the result from one session
to another. All variables, such as architecture, back-
bone, batch size, computational power, iterations, and
learning rate had to be consequent for the three test
sessions.
Weather augmentations as well as synthesised im-
ages both contains artificial artefacts, which could
be interpreted differently by the object detector com-
pared to actual weather conditions or presence of ob-
jects. Furthermore, synthesised images suffers from
another dilemma with respect to artificial elements
- artificially induced objects are most likely to lack
in context-awareness. One or more parameters, such
as scale, position, rotation, and reflections of light, is
likely to be inaccurate with respect to the background
image. Therefore the amount of artificial artefacts in-
duced to the images were measured using Natural Im-
age Quality Evaluator (NIQE) (Mittal et al., 2012), a
quality index measuring tool.
4.1 Experiment
The experiments are divided into three stages, a
preparation phase, followed by a training phase, and
an evaluation phase constructed in three test sessions.
Faster R-CNN was used as the architecture frame-
work during the entire experiment. ResNeXt-101-
FPN, Resnet-101-FPN, and ResNet-50-FPN were
evaluated as a backbone during the initial test session.
Based on the results, ResNet-50-FPN was applied as
a backbone during the second and third test sessions.
4.1.1 Preparation Phase
The images were extracted from in-flight videos over
an airport. To supplement these, royalty-free im-
ages with relevant motifs were gathered. Environ-
ment, object scale, resolution, climate, and colour
of images were disregarded during collection. Key-
words applied during search and collection of royalty-
free images: Aerial view of airport, Aircraft, Airfield,
Airport, Airport from above, Airport ground vehicle,
Airstrip, Car, Flight, Helicopter, Runway, Truck, and
Truck at airport.
The Initial Session. Altogether, 2318 distinct images
were at hand. The base dataset with no data augmen-
tation is used for the initial test session, determining
the base accuracy. Therefore, a subset of the base
dataset was augmented to extend the number of im-
ages available for training and test resulting in 3318
images for the base dataset. The Python library Im-
gaug
1
provided the augmentation techniques neces-
sary for the base dataset as well as for the second and
third test session; each category applied can be seen
in Table 1. The first six categories were applied to
extend the base dataset. Python’s pseudo-random li-
brary Random was used to single out which images
to augment, to avoid inflicting any bias. Likewise, the
same method was used to determine the number of
augmentation techniques to be applied for each single
image, as well as which technique(s). At most three
different techniques were applied to a single image,
at minimum one technique. Every 3318 images of the
base dataset were arranged into one of two sets, re-
ferred to as Runway Detection Training set (RDTr-s)
and Runway Detection Test set (RDT-s). The images
were split into folders of similar size, each folder was
then pseudo-randomly classified as either training or
test close to the percentage 85/15. RDTr-s consisted
of 2795 images, RDT-s of 523.
The Second Session. For the second test session, a
second test set was utilised - Runway Detection Ro-
bust Test set (RDRT-s). To create the second test set,
all images of the first test set RDT-s were augmented
using the augmentation techniques of the last four cat-
egories in Table 1. The augmentation was performed
in the same manner as the augmentation of the base
set to avoid inflicting any bias. A second approach,
synthesising, was included in addition to augmenta-
1
https://github.com/aleju/imgaug
Image Synthesisation and Data Augmentation for Safe Object Detection in Aircraft Auto-landing System
127

Table 1: Categorising augmentation methods used to produce the augmented images. First six categories were allocated to
create RDTr-s and RDT-s, while the remaining categories where used to create RDRTr-s and RDRT-s.
Category Augmentation Setting Unit
Colour
Grayscale alpha=(0.0, 1.0) Percent
Remove saturation - Percent
Change colour temperature (2000, 16000) Kelvin
Contrast
Gamma contrast (0.5, 2.0) Pixel value per channel
All channels CLAHE
(Contrast Limited Adaptive - Channel by channel
Histogram Equalisation) normalisation
Convolutional Edge detect alpha=(0.0, 1.0) Percent
Flip
Fliplr - Percent to flip
Flipud - Percent to flip
Geometric
Perspective transform scale=(0.01, 0.15) Distance to image corner points
Rotate (-45, 45) Degree(s)
Size Crop px=(1, 16) Pixel(s)
Arithmetic
Add (-40, 40) Pixel value addition term
Multiply (0.5, 1.5), per_channel=0.5
Pixel value multiplication factor,
percent channel-wise
Cutout nb_iterations=(1, 3) Quantity of rectangular(s)
Blur
Gaussian blur sigma=(0.0, 3.0) Variance
Motion blur k=15 Kernel size
Corruption
Snow severity=random.randint(1, 5) Severity level
Motion blur severity=random.randint(1, 5) Severity level
brightness severity=random.randint(1, 5) Severity level
Weather
Fog - -
Clouds - -
Rain - -
FastSnowyLandscape
lightness_threshold=(130, 200)/
lightness_threshold=[100, 120],
lightness_multiplier=(2.3, 2.7)
Pixel value threshold
tion to enrich the dataset with relevant objects. Ob-
jects covered by the classes were masked out from
the royalty-free images with approval for modifica-
tion, 30 objects were extracted in total. Images from
the base dataset were used as background. Each ob-
ject was manually added as the foreground layer to
one of the background images. This generated 24 syn-
thesised images, all of whom were also augmented to
generate 144 synthesised images in total. Plus, 72 im-
ages were added to the second test set RDRT-s.
The Third Session. A second training set was to be
utilised for the third test session - Runway Detection
Robust Training set (RDRTr-s). The remaining syn-
thesised images, 72 images, were added to the sec-
ond training set together with another 1000 images
generated by augmentation. Approximately 36% of
the first training set RDTr-s was pseudo-randomly se-
lected and augmented using the same augmentation
techniques as for the second test set RDRT-s. Half of
the synthesised images, the first training set, and the
1000 augmented images, made up the second training
set. An example of the synthesised images is illus-
trated in Fig. 4, weather and lighting augmentations
in Fig. 5.
Table 2: The created datasets, divided by name and number
of images in each set. Last column represents which test
session the corresponding datasets where utilised, S1 for the
initial session, S2 for the second session, and S3 for the
third session.
Dataset Size Applied
Runway Detection Training
set (RDTr-s)
2795
images
S1, S2
Runway Detection Test set
(RDT-s)
523
images
S1
Runway Detection Robust
Training set (RDRTr-s)
3866
images
S3
Runway Detection Robust
Test set (RDRT-s)
1088
images
S2, S3
In Table 2 all four sets are presented with their re-
spective size. Amount of annotations for each set and
class can be seen in Table 3, average annotations per
image for each set and class can be seen in Table 4.
LabelImg (Tzutalin, 2015) was used to annotate the
images of the four datasets. All objects which fell
under the classes ’Aircraft’, ’Car’, ’Helicopter’, ’Hu-
man’, ’Runway’, and ’Truck’ were annotated. How-
ever, ’Car’ and ’Truck’ was at a later stage merged to
one class ’Vehicle’. Prior to annotation, the images’
resolution was not considered, but due to graphical
VISAPP 2021 - 16th International Conference on Computer Vision Theory and Applications
128
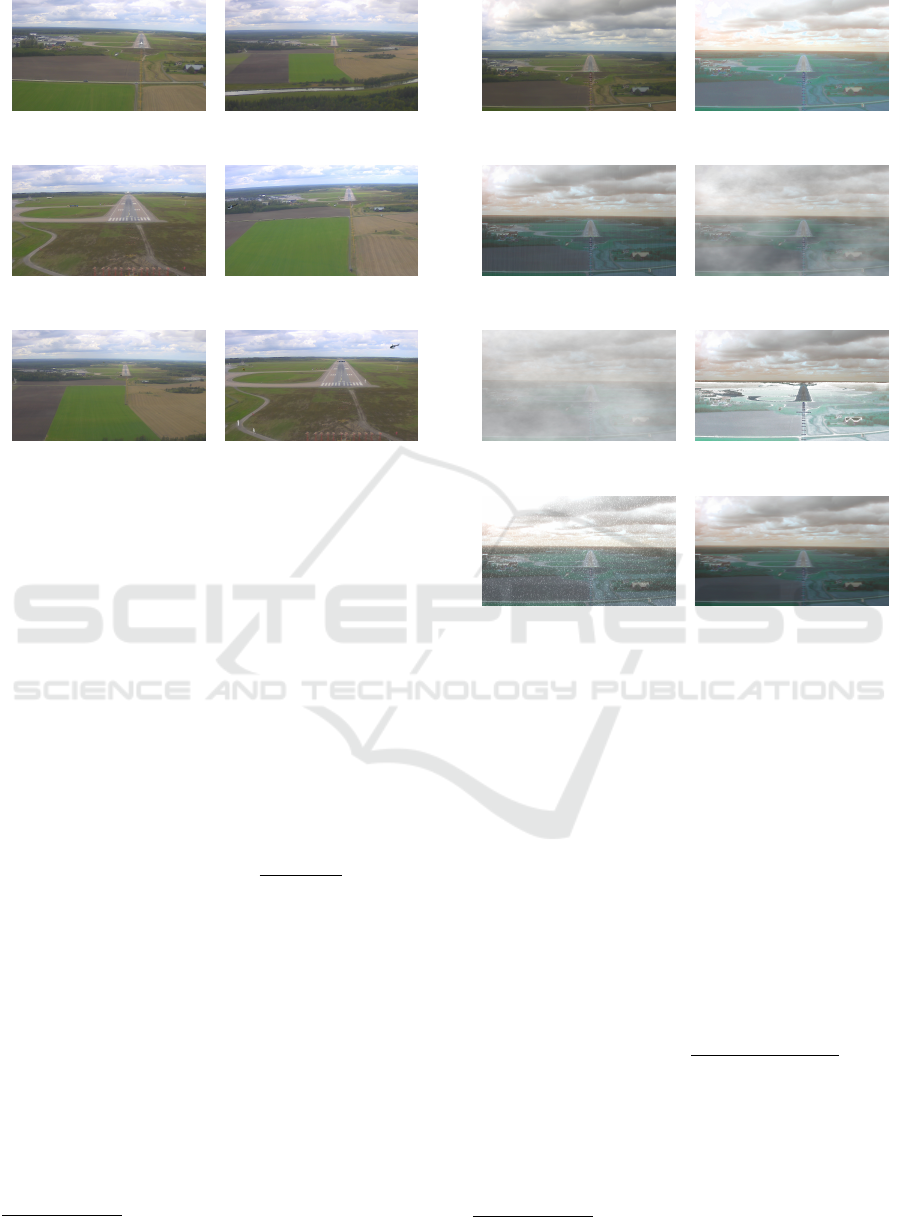
(a) (b)
(c) (d)
(e) ( f )
Figure 4: Example of created synthesised images used
within RDRTr-s and RDRT-s. (a) Aircraft(1) and Heli-
copter(1) synthesised (b) Aircraft(2) synthesised (c) Air-
craft(1) and Vehicle(2) synthesised (d) Aircraft(1), Heli-
copter(1), and Vehicle(1) synthesised (e) Helicopter(1) and
Vehicle(2) synthesised (f) Aircraft(1), Helicopter(2), Hu-
man(3), and Vehicle(1) synthesised.
memory restrictions, a generic resolution of all im-
ages was required. Therefore, all images were resized
to the highest generic resolution possible without trig-
gering a CUDA out of memory alert, 600 × 400 pix-
els. Since this was conducted after completing the
annotations, all annotation coordinates were re-scaled
by the same factor, as presented by Equation 1.
newCord
x/y/min/max
=
orgCord
x/y/min/max
×
newRes
x/y
oldRes
x/y
(1)
4.1.2 Training Phase
For the experiment, two training sessions were exe-
cuted, to complete the initial test session and the third
test session. The Detectron2 (Wu et al., 2019) de-
velopment framework was used to achieve a *.pth-file
with weights, training parameters, scheduler dictio-
nary, and optimiser dictionary. Basically the develop-
ment framework is intended for development within
a Linux environment, to allow the training to run
in a Windows environment variables in the Pytorch
build
2
had to be made. To enable accelerated train-
2
https://github.com/conansherry/detectron2
(a) (b)
(c) (d)
(e) ( f )
(g) (h)
Figure 5: Examples of augmentation applied on original im-
ages for the robust training and test sets, with setting spec-
ified in Table 1. (a) Original image (b) Brightness (c) Rain
(d) Clouds (e) Fog (f) Fast Snowy Landscape (g) Snow (h)
Motion Blur, Blur.
ing, the framework was compiled with CUDA
3
. Hy-
perparameters which control the training characteris-
tics in Detectron2 are epochs, batch size per image,
number of classes, and learning rate. The number of
epochs completed is determined by the number of it-
erations. Amount of images present in the training
set and batch size determines the number of iterations
equal to completing one epoch, in accordance with
Equation (2). All settings modified during the experi-
ment can be viewed in Table 5.
Iterations per epoch =
Number of images
Images per batch
(2)
At the beginning of a training session the learning
rate can either be fixed, start at high value and there-
after decline, or gradually increase until reaching a
ceiling (the base learning rate). If applying the lat-
ter, the warm-up iterations determine at which point
3
https://www.nvidia.com/object/io_69526.html
Image Synthesisation and Data Augmentation for Safe Object Detection in Aircraft Auto-landing System
129

Table 3: Compilation of the total number of annotated instances, total and class wise, for each dataset.
Dataset
Total
annotation
instances
Class
Aircra f t
annotation
instances
Class
Runway
annotation
instances
Class
Vehicle
annotation
instances
Class
Helicopter
annotation
instances
Class
Human
annotation
instances
RDTr-s 17453 4451 1247 8979 301 2475
RDT-s 3670 1098 121 1815 37 599
RDRTr-s 23306 5858 1708 11938 507 3295
RDRT-s 7062 2102 300 3468 89 1103
Table 4: Average number of annotation instances per image, total and class wise, for each dataset.
Dataset
Average
annotation
instances
per image
Class
Aircra f t
Average
annotation
instances
per image
Class
Runway
Average
annotation
instances
per image
Class
Vehicle
Average
annotation
instances
per image
Class
Helicopter
Average
annotation
instances
per image
Class
Human
Average
annotation
instances
per image
RDTr-s 6.2 1.6 0.4 3.2 0.1 0.9
RDT-s 7.0 2.1 0.2 3.5 0.07 1.1
RDRTr-s 6.0 1.5 0.4 3.1 0.1 0.9
RDRT-s 6.5 1.9 0.3 3.2 0.08 1.0
Table 5: Overview of parameter settings during training
with RDTR-s. a) Cyclic learning rate settings. b) Expo-
nential cyclic learning rate setting. Solution b) used in final
implementation.
Parameter Value
Number of
workers
2
Images per batch 2
Batch size per
image
256
Number of
iterations
9088
Number of
classes
5
Warm-up
method
’Linear’
Warm-up
iterations
4544
Base learning
rate
a) 0.006
b) 0.006, 0.00589, 0.00555,
0.005007, 0.00424, 0.003243
Gamma, γ
a) 0.9618
b) 0.9618, 0.9614, 0.9626, 0.9648,
0.9684, 0.9742
Steps
4545, 4645, 4745, 4845, 4945,
5045, 5145, 5245, 5345, 5445,
5545, 5645, 5745, 5845, 5945,
6045, 6145, 6245, 6345, 6445,
6545, 6645, 6745, 6845, 6945,
7045, 7145, 7245, 7345, 7445,
7545, 7645, 7745, 7845, 7945,
8045, 8145, 8245, 8345, 8445,
8545, 8645, 8745, 8845, 8945,
9045,
the learning rate will cease to increase, i.e. when
the base learning rate shall be reached. For each de-
fined step after the warm-up period the learning rate
will be decreased by gamma, γ. Research of optimal
learning rates are ongoing, L. N. Smith (Smith, 2017)
presented cyclic learning rate as a method attempt-
ing to achieve higher accuracy while decreasing train-
ing time. During this experiment, the method was
mimicked, with 0.001 as the lowest and 0.006 high-
est learning rate (base learning rate). Additionally, an
exponential decrease of the learning rate was applied
after every cycle. To achieve the exponential decline,
the base learning rate and the gamma value had to
be updated regularly. The base learning rate of every
cycle was determined by interpolating an exponential
function between the initial base learning rate, 0.006,
and the minimum learning rate, 0.001, over a defined
interval of iterations. Half a cycle was set to 4544 it-
erations and 9088 iterations as full cycle length. A
graph of the exponential function is visualised in Fig.
6, where the blue points represents the base learning
rate for each cycle. As a result, the base learning rate
follows Equation (3), where x is number of iterations,
base
lr
= −1.1e
−12
x
2
+ 0.006
x ∈ 4544 ≤ i ≤ 49948
(3)
The gamma value was updated for every cycle ac-
cording to Equation (4), where min
lr
is the minimum
learning rate and base
lr
is the base learning rate.
γ =
45
r
min
lr
base
lr
, (4)
Neither a cyclic learning rate nor an exponen-
tial learning rate is currently supported by the Detec-
tron2 development framework. This is due to an in-
ternal scheduler dictionary, ’WarmupMultiStepLR’
the default scheduler of Detectron2, which holds last
recorded parameter values. The last recorded learning
rate together with iterations, γ, and steps, are loaded
prior to a new training cycle. Therefore, the scheduler
VISAPP 2021 - 16th International Conference on Computer Vision Theory and Applications
130

x
base
lr
Figure 6: A function of the base learning rate, where x-axis
corresponds to the number of iterations and y-axis is base
lr
.
dictionary was overwritten every cycle to achieve the
desired behaviour.
Implementation Details. All four custom datasets,
RDTr-s, RDT-s, RDRTr-s, and RDRT-s, were regis-
tered through the data loader of Detectron2 which
utilises Pytorch
4
to read the image and JSON files.
Training metrics, loss, class accuracy, false-negatives,
and foreground accuracy, are recorded and written to
event files during training while a .pth-file is produced
at the end of training. The .pth-file, on the other hand,
can be used to re-load the training from the last saved
checkpoint. For the third test session, the second
training session, the .pth-file from the first training
session was re-loaded to use the pre-trained model’s
weights.
5 RESULTS
All gathered results from the three test suits of the
experiment are presented within this section. All ta-
bles combined covers achieved accuracy scores and
measured average quality index for the original-,
augmented-, and synthesised images. A qualitative
detection capability comparison between second and
third session is presented in Section 5.3.
5.1 First Test Session
Faster R-CNN, as the most accurate architecture on
Pascal VOC dataset (Zhao et al., 2019), is selected
with three different backbones (ResNeXt-101-FPN,
ResNet-101-FPN, and ResNet-50-FPN) for the exper-
iments. The main reason of using Faster R-CNN, as
a two-stage detector, is that one-stage detectors, such
as YOLO (Redmon et al., 2016) and SSD (Liu et al.,
2016), have poor localisation accuracy of small ob-
jects (Levin and Vidimlic, 2020). Although one-stage
4
https://pytorch.org/docs/stable/torchvision/datasets.
html
detectors have a faster detection speed, efficient in-
ference time is not the priority of the safety-critical
auto-landing application (Forsberg et al., 2020).
Base accuracy scores with each backbone trained
on RDTr-s and tested on RDT-s can be seen in Table
6. During the larger part of all conducted training cy-
cles, the accuracy of each cycle was measured. In to-
tal six training cycles were performed for each back-
bone, and the measured accuracy can be viewed in
Table 7. Measured accuracy scores of ’Car’, ’Truck’,
and ’Vehicle’ are presented in Table 8and the class
accuracy of each backbone is shown in Table 9.
5.2 Second and Third Test Session
A quality index, NIQE (Mittal et al., 2012), was used
to measure the induced error by artificial artefacts in
the augmented and synthesised images. To allow for
any conclusions to be made, the original images were
also evaluated to achieve a reference value for the al-
tered images. An average quality index for each im-
age class is presented in Table 10. The result indicates
the augmented images to be furthest from reality, yet
not drastically deteriorated from the original images,
with a score increment of 0.9801. For the second and
third test session, Faster R-CNN was used as archi-
tecture framework and ResNet-50-FPN as backbone.
Choice of backbone was based on the achieved accu-
racy scores of the first test session (Table 6). The ob-
tained accuracy for the second and third test session
can be viewed in Table 11. According to the table
6, we improve the accuracy 2% on average. Addi-
tionally, the class accuracy scores achieved during the
second and third test session are presented in Table
12. The accuracy scores of the second test session
were gathered by reusing the object detection model
trained with RDTr-s to run a test with the RDRT-s.
While the accuracy scores of the third test session
were achieved by training an object detection model
with RDRTr-s and thereafter running a test with the
RDRT-s.
5.3 Quantitative Results
The detection capability between the second and third
test session was measured and compared, by observ-
ing the confidence output for each detected object as
well as the number of objects detected. The confi-
dence output for each identified object is given in per-
centage, representing the certainty level for an object
belonging to one of the the chosen classes (Figure 7).
Image Synthesisation and Data Augmentation for Safe Object Detection in Aircraft Auto-landing System
131

Table 6: Top accuracy score over 39 training epochs for the first test session with three different backbone networks.
Test session Object detection
RDT-s RDT-s RDT-s RDT-s RDT-s RDT-s
(AP@[IoU= (AP IoU=.5) (AP IoU=.75) (AP
small
) (AP
medium
) (AP
large
)
.5:.95])% % % % % %
1
Faster R-CNN
50.327 81.108 54.534 37.004 62.852 70.363
w. ResNet-50-FPN
1
Faster R-CNN
48.687 80.792 50.551 35.096 62.671 71.126
w. ResNet-101-FPN
1
Faster R-CNN
46.692 82.294 44.690 40.231 56.999 67.269
w. ResNeXt-101-FPN
Table 7: Accuracy results of the first test session for Faster R-CNN with the three different backbone networks. Results given
in AP@[IoU=.5:.95] % score over each training cycle with RDTr-s. The three backbone networks were trained during the
same amount of cycles, however some documented data results were lost after completed training.
Test Session
Object detection
1
st
Cycle
2
nd
Cycle 3
rd
Cycle 4
th
Cycle 5
th
Cycle 6
th
Cycle
1
Faster R-CNN
w. ResNet-50-FPN
47.794 50.327 48.530 49.225 49.678 49.668
1
Faster R-CNN
w. ResNet-101-FPN
48.687 - - - - -
1
Faster R-CNN
w. ResNeXt-101-FPN
- 46.450 45.253 46.692 - -
Table 8: The top accuracy score over 39 training epochs for the first test session from class ’Vehicle’ split in two sub-classes,
’Car’ and ’Truck’, and result from combined class ’Vehicle’ for Faster R-CNN with ResNeXt-101-FPN backbone with RDT-s.
Test session
Object detection
RDT-s
Class
Car
%
RDT-s
Class
Truck
%
RDT-s
Class
Vehicle
%
1
Faster R-CNN
w. ResNet-50-FPN
- - 38.368
1
Faster R-CNN
w. ResNet-101-FPN
- - 33.810
1
Faster R-CNN
w. ResNeXT-101-FPN
11.906 45.069 38.442
Table 9: Top accuracy score over 39 training epochs for Faster R-CNN with three different backbones with RDT-s.
Test session
Object detection
RDT-s
Class
Aircra f t
%
RDT-s
Class
Human
%
RDT-s
Class
Vehicle
%
RDT-s
Class
Runway
%
RDT-s
Class
Helicopter
%
1
Faster R-CNN
w. ResNet-50-FPN
58.802 54.854 38.368 69.019 42.549
1
Faster R-CNN
w. ResNet-101-FPN
57.172 52.593 33.810 69.616 45.120
1
Faster R-CNN
w. ResNeXt-101-FPN
57.322 30.336 38.442 76.104 31.147
Table 10: Obtained average quality index for original-,
augmented-, and synthesised images.
Image representation
Average Quality Index
NIQE
Original 2.6071
Augmented 3.5872
Artificially induced objects
2.8068
6 DISCUSSION
In this section, the key ideas and findings during the
research are discussed.
6.1 Custom Dataset
The largest part of this work, and it’s most valuable
resulted product, is the four datasets of the opera-
tional environment. Producing enough images for
each dataset required gathering, augmentation, and
synthesising of images while simultaneously min-
imising any risk of bias. Besides, the annotation pro-
cess following the collection of images was very time
consuming due to feature-rich images. For example,
the annotation of the base dataset took two weeks
for two people to complete. Despite feature-rich im-
ages the datasets had unbalanced distributions of ob-
ject classes, some classes were more represented than
VISAPP 2021 - 16th International Conference on Computer Vision Theory and Applications
132
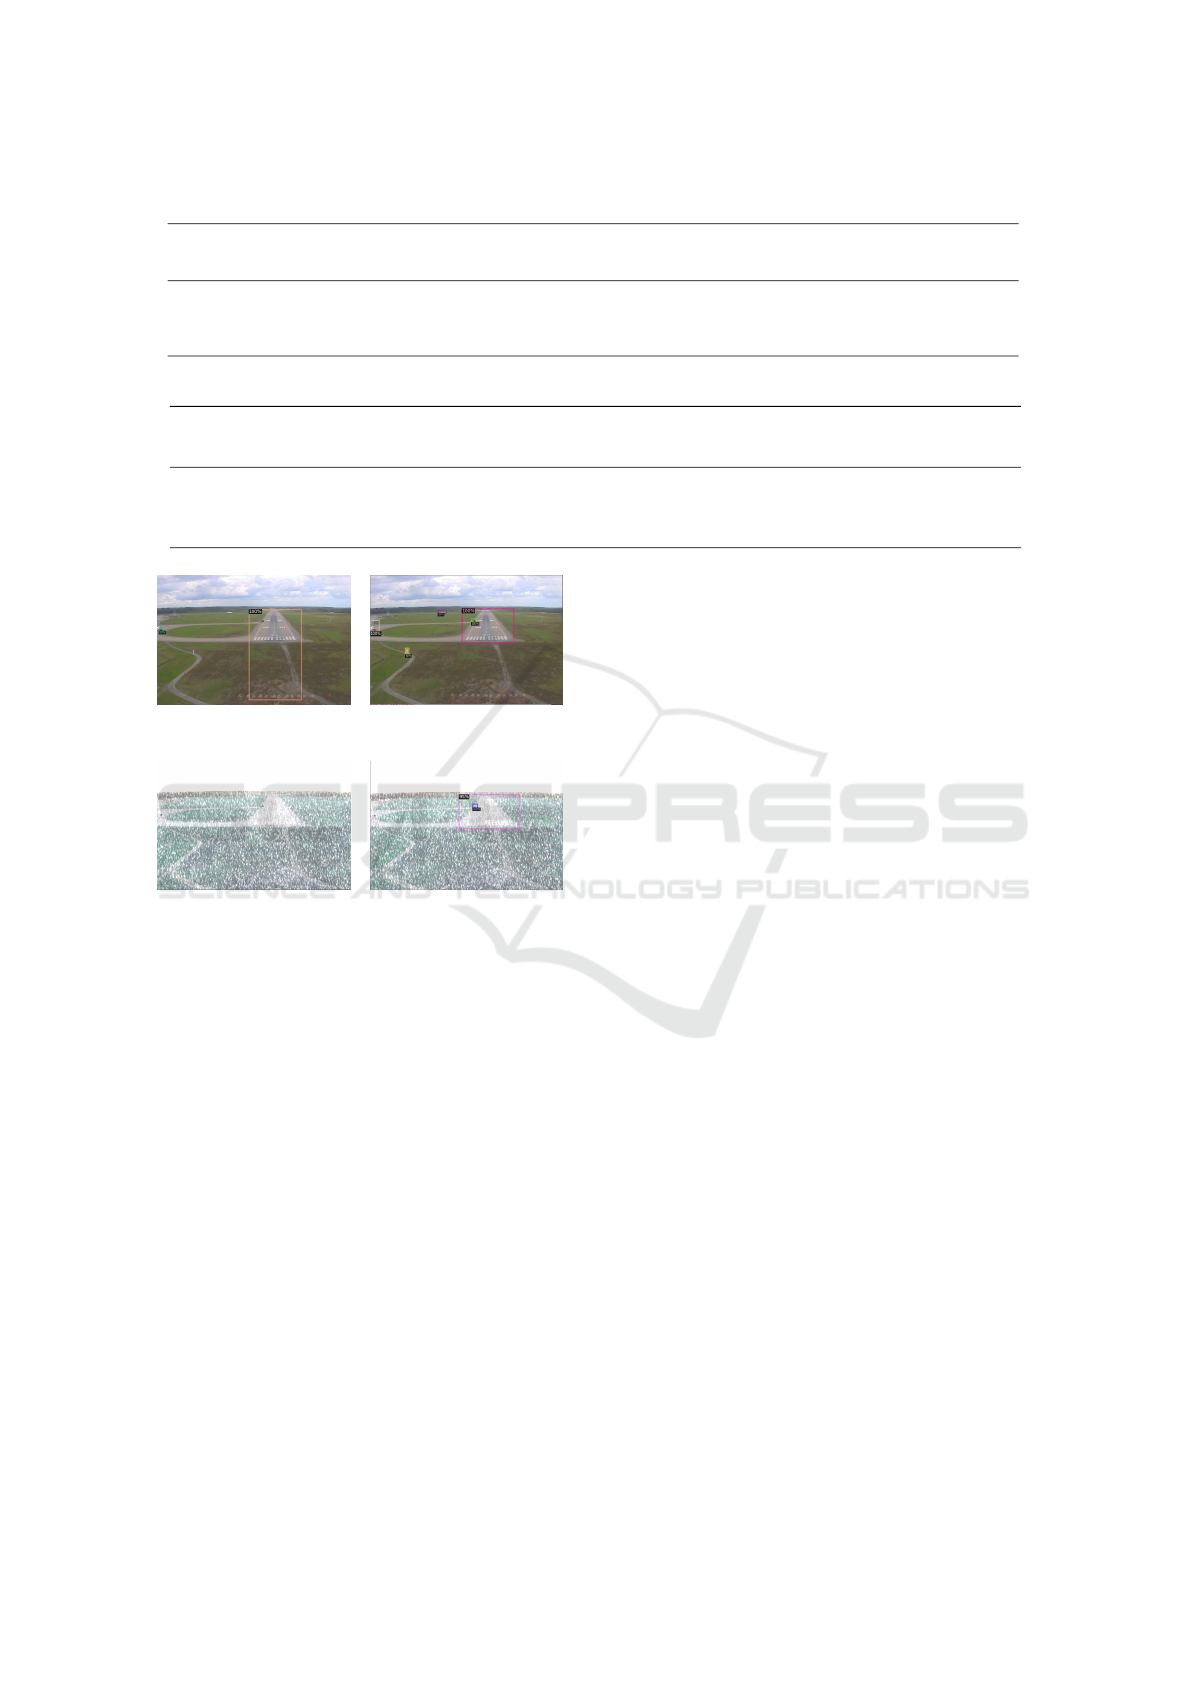
Table 11: Top accuracy score over 39 training epochs for the second and third test sessions.
Test session Object detection
RDRT-s RDRT-s RDRT-s RDRT-s RDRT-s RDRT-s
(AP@[IoU= (AP IoU=.5) (AP IoU=.75) (AP
small
) (AP
medium
) (AP
large
)
.5:.95])% % % % % %
2
Faster R-CNN
32.18 59.327 32.390 28.672 34.079 48.345
w. ResNet-50-FPN
3
Faster R-CNN
47.738 78.835 51.180 41.392 53.288 61.832
w. ResNet-50-FPN
Table 12: Top accuracy score for each class over 39 training epochs for the second and third test sessions.
Test session
Object detection
RDRT-s
Class
Aircra f t
%
RDRT-s
Class
Human
%
RDRT-s
Class
Vehicle
%
RDRT-s
Class
Runway
%
RDRT-s
Class
Helicopter
%
2
Faster R-CNN
w. ResNet-50-FPN
42.674 20.283 24.306 56.528 17.145
3
Faster R-CNN
w. ResNet-50-FPN
55.689 31.474 43.282 67.661 40.584
(a) (b)
(c) (d)
Figure 7: Comparison of object detection results with
weather and lighting augmentations in training dataset (b
and d) and without augmentation (a and c). (a) Synthesised
image: Vehicle(90 %) falsely detected and Runway(100
%) detected, one aircraft, one human, and one vehicle un-
detected, (b) Synthesised image: Aircraft(100 %, 99 %),
Runway(100 %), Human(92 %), (c) Snow augmentation:
Two aircraft, one human, and one vehicle undetected, (d)
Snow augmentation: Runway(95 %) and Vehicle(100 %)
detected, two aircraft and one human undetected.
others. Due to the number of certain objects covered
by royalty-free images, the class ’Helicopter’ was by
far underrepresented. In contrast, the class ’Vehicle’
covered both common objects, car and truck, which
led to an over representation. The uneven distribution
was reduced during augmentation, however not equal,
thus adding new images to the datasets is beneficial.
6.2 Development Framework
Custom datasets generally entail hold-ups during the
development of deep learning-based object detection
models but are a requirement for usage within safety-
critical applications since they highly affect the per-
formance of the final model. Therefore, it was neces-
sary with an efficient development framework to stay
within the schedule, for this work, the development
was performed using Detectron2. The framework al-
lowed for efficient tailoring of training and test ses-
sions; however, low-level customisation options were
limited. Yet, the exponential cyclic learning rate was
achievable by manually interfering with the sched-
uler logic. All training sessions were completed using
the architecture framework Faster R-CNN. All accu-
racy scores were logged during the first test session
to enable a comparison between the three backbones
including ResNeXt-101-FPN, ResNet-101-FPN, and
ResNet-50-FPN object CNN models.
6.3 Accuracy Score for Backbone
During research ResNeXt-101-FPN seemed to be the
most prominent backbone for this work, surprisingly
enough ResNet-50-FPN had the highest performance
out of the three and was therefore used throughout
the rest of the test sessions. The reason for a bet-
ter performance of ResNet-50-FPN and the low in-
crease of AP@[IoU=.5:.95] score between the cycles
for all three backbones was speculated to be the cause
of dying Rectified Linear Unit (ReLU), when no re-
sponse is given on input by the artificial neurons of the
NN. Another explanation for the performance of the
three models could be the exponential cycling learn-
ing rate. The motivation for using the tailored learn-
ing rate was due to higher accuracy in combination
with less required training time; this could indicate
that the maximum accuracy score achievable with the
custom dataset is just slightly above 50. Furthermore,
as previously mentioned, all images were resized to a
generic size after the annotation process. Most likely,
Image Synthesisation and Data Augmentation for Safe Object Detection in Aircraft Auto-landing System
133

this resulted in some small objects being in fact too
small for the new resolution.
6.4 Effect of Image Enhancement
By analysing the class accuracy achieved during the
first test session, it is possible to see a lower perfor-
mance of class ’Human’ and ’Helicopter’, especially
with ResNeXt-101-FPN. Overall, objects which were
more consistent with respect to appearance and size
tended to score higher. Class ’Vehicle’ had a large
variation in both appearance and size since the class
covered both cars as well as trucks. While the class
’Human’ mostly varied in appearance due to shift-
ing body positions. A significant stagnation of ac-
curacy compared to the first test was recorded dur-
ing the second test, despite slim differences measured
with NIQE between the original images and both the
augmented and synthesised images, which points to
the modified images not being too far away from re-
ality, increasing the probability of results to be rele-
vant for operation within real-world scenarios. While
introducing both the augmented as well as the syn-
thesised images into the training set yielded a signifi-
cant increase of accuracy, close to the initial accuracy
achieved with no corruptions present in the test set.
The results indicated corruptions within training data
to increase the robustness of the model towards vari-
ous variations in general.
7 CONCLUSION
The aim of this work was to evaluate if augmentation
of weather and luminance in combination with the
introduction of artificial artefacts could improve the
representation of an operational aircraft environment.
By merging the augmented and synthesised images,
a robust training dataset could be constructed. The
calculated estimation of inducted error by augmenta-
tions and artificial artefacts, NIQE score, showed an
increased error of 0.2 on average for synthesised im-
ages and 0.8 for augmented images. As evident by
the results, synthesised images display the closes re-
semblance with the original images. However, aug-
mented images are not drastically deteriorated, which
indicate that the dataset has a close resemblance to
the real operational environment. Introducing varia-
tions in the constructed dataset yielded an improve-
ment of prediction accuracy by a factor of 1.48 for
AP@[IoU=.5:.95], from 32.187 (%) to 47.738 (%)
and by a factor of 1.33, from 59.327 (%) to 78.835
(%) for IoU=.5, when comparing to the second test
session. By extending the dataset with the representa-
tion of variation in the environment, the robustness is
improved to maintain accuracy.
ACKNOWLEDGEMENT
We wish to express our gratitude towards SAAB for
providing us the experimental dataset. A sincere ap-
preciation to Per-Olof Jacobson for valuable guidance
and providing us resources throughout the work. This
Paper is supported by Knowledge Foundation (KKS)
within DPAC and DeepMaker projects.
REFERENCES
Alam, M. S., Ashwin, T., and Reddy, G. R. M. (2020). Op-
timized object detection technique in video surveil-
lance system using depth images. In Smart Computing
Paradigms: New Progresses and Challenges, pages
19–27. Springer.
Association, I. A. T. et al. (2019). Iata safety report 2019.
Montreal, Canada.
Badue, C., Guidolini, R., Carneiro, R. V., Azevedo, P., Car-
doso, V. B., Forechi, A., Jesus, L., Berriel, R., Paixão,
T., Mutz, F., et al. (2019). Self-driving cars: A survey.
arXiv preprint arXiv:1901.04407.
Ball, D., Upcroft, B., Wyeth, G., Corke, P., English, A.,
Ross, P., Patten, T., Fitch, R., Sukkarieh, S., and
Bate, A. (2016). Vision-based obstacle detection and
navigation for an agricultural robot. Journal of field
robotics, 33(8):1107–1130.
Burton, S., Gauerhof, L., and Heinzemann, C. (2017). Mak-
ing the case for safety of machine learning in highly
automated driving. In International Conference on
Computer Safety, Reliability, and Security, pages 5–
16. Springer.
Dave, G., Chao, X., and Sriadibhatla, K. (2010). Face
recognition in mobile phones. Department of Electri-
cal Engineering Stanford University, USA, pages 7–
23.
Deng, J., Dong, W., Socher, R., Li, L.-J., Li, K., and Fei-
Fei, L. (2009). Imagenet: A large-scale hierarchical
image database. In 2009 IEEE conference on com-
puter vision and pattern recognition, pages 248–255.
Ieee.
Engelcke, M., Rao, D., Wang, D. Z., Tong, C. H., and Pos-
ner, I. (2017). Vote3deep: Fast object detection in 3d
point clouds using efficient convolutional neural net-
works. In 2017 IEEE International Conference on
Robotics and Automation (ICRA), pages 1355–1361.
IEEE.
Everingham, M., Van Gool, L., Williams, C. K., Winn, J.,
and Zisserman, A. (2010). The pascal visual object
classes (voc) challenge. International journal of com-
puter vision, 88(2):303–338.
VISAPP 2021 - 16th International Conference on Computer Vision Theory and Applications
134

Faria, J. M. (2017). Non-determinism and failure modes in
machine learning. In 2017 IEEE International Sympo-
sium on Software Reliability Engineering Workshops
(ISSREW), pages 310–316. IEEE.
Federal Aviation Administration (2000). Installation of ter-
rain awareness and warning system (taws) approved
for part 23 airplanes. accessed: 1 August 2020.
Federal Aviation Administration (2017). Airworthiness ap-
proval of traffic alert and collision avoidance systems
(tcas ii), versions 7.0 & 7.1 and associated mode s
transponders. accessed: 1 August 2020.
Forsberg, H., Lindén, J., Hjorth, J., Månefjord, T., and
Daneshtalab, M. (2020). Challenges in using neu-
ral networks in safety-critical applications. In 2020
AIAA/IEEE 39th Digital Avionics Systems Conference
(DASC), pages 1–7. IEEE.
Gatys, L. A., Ecker, A. S., and Bethge, M. (2015). A
neural algorithm of artistic style. arXiv preprint
arXiv:1508.06576.
Geirhos, R., Rubisch, P., Michaelis, C., Bethge, M., Wich-
mann, F. A., and Brendel, W. (2018). Imagenet-
trained cnns are biased towards texture; increasing
shape bias improves accuracy and robustness. arXiv
preprint arXiv:1811.12231.
Geng, H., Guan, J., Pan, H., and Fu, H. (2018). Multiple ve-
hicle detection with different scales in urban surveil-
lance video. In 2018 IEEE Fourth International Con-
ference on Multimedia Big Data (BigMM), pages 1–4.
IEEE.
Hendrycks, D. and Dietterich, T. G. (2018). Benchmarking
neural network robustness to common corruptions and
surface variations. arXiv preprint arXiv:1807.01697.
ICAO, A. (2019). State of global aviation safety. Montreal,
Canada.
Inoue, H. (2018). Data augmentation by pairing sam-
ples for images classification. arXiv preprint
arXiv:1801.02929.
J.Steward (2018). Tesla’s autopilot was involved in another
deadly car crash. accessed: 1 August 2020.
Levin, A. and Vidimlic, N. (2020). Improving situational
awareness in aviation: Robust vision-based detection
of hazardous objects.
Lin, T.-Y., Maire, M., Belongie, S., Hays, J., Perona, P.,
Ramanan, D., Dollár, P., and Zitnick, C. L. (2014).
Microsoft coco: Common objects in context. In Euro-
pean conference on computer vision, pages 740–755.
Springer.
Liu, W., Anguelov, D., Erhan, D., Szegedy, C., Reed, S.,
Fu, C.-Y., and Berg, A. C. (2016). Ssd: Single shot
multibox detector. In European conference on com-
puter vision, pages 21–37. Springer.
Loni, M., Sinaei, S., Zoljodi, A., Daneshtalab, M., and
Sjödin, M. (2020). Deepmaker: A multi-objective op-
timization framework for deep neural networks in em-
bedded systems. Microprocessors and Microsystems,
73:102989.
Michaelis, C., Mitzkus, B., Geirhos, R., Rusak, E., Bring-
mann, O., Ecker, A. S., Bethge, M., and Brendel, W.
(2019). Benchmarking robustness in object detection:
Autonomous driving when winter is coming. arXiv
preprint arXiv:1907.07484.
Mitsa, T. (2019). How Do You Know You Have Enough
Training Data? accessed: 1 August 2020.
Mittal, A., Soundararajan, R., and Bovik, A. C. (2012).
Making a “completely blind” image quality analyzer.
IEEE Signal Processing Letters, 20(3):209–212.
O’Mahony, N., Campbell, S., Carvalho, A., Harapanahalli,
S., Hernandez, G. V., Krpalkova, L., Riordan, D., and
Walsh, J. (2019). Deep learning vs. traditional com-
puter vision. In Science and Information Conference,
pages 128–144. Springer.
Redmon, J., Divvala, S., Girshick, R., and Farhadi, A.
(2016). You only look once: Unified, real-time object
detection. In Proceedings of the IEEE conference on
computer vision and pattern recognition, pages 779–
788.
Shorten, C. and Khoshgoftaar, T. M. (2019). A survey on
image data augmentation for deep learning. Journal
of Big Data, 6(1):60.
Skybrary (2017). B744 / vehicle, luxembourg airport, lux-
embourg 2010. accessed: 1 August 2020.
Smith, L. N. (2017). Cyclical learning rates for training
neural networks. In 2017 IEEE Winter Conference on
Applications of Computer Vision (WACV), pages 464–
472. IEEE.
Taylor, L. and Nitschke, G. (2017). Improving deep learn-
ing using generic data augmentation. arXiv preprint
arXiv:1708.06020.
Tzutalin (2015). Labellmg. accessed: 1 August 2020.
Wu, Y., Kirillov, A., Massa, F., Lo, W.-Y., and Girshick, R.
(2019). Detectron2.
Zhang, L., Zhai, Z., He, L., Wen, P., and Niu, W. (2019).
Infrared-inertial navigation for commercial aircraft
precision landing in low visibility and gps-denied en-
vironments. Sensors, 19(2):408.
Zhao, Z.-Q., Zheng, P., Xu, S.-t., and Wu, X. (2019). Ob-
ject detection with deep learning: A review. IEEE
transactions on neural networks and learning systems,
30(11):3212–3232.
Zhong, Z., Zheng, L., Kang, G., Li, S., and Yang, Y. (2017).
Random erasing data augmentation. arXiv preprint
arXiv:1708.04896.
Image Synthesisation and Data Augmentation for Safe Object Detection in Aircraft Auto-landing System
135
