
Logical Workflow Analysis based on Multiple Criteria Decision
Analysis: Industrial Application for a Make to Order Environment
Soukaina Oujana
1a
, Lionel Amodeo
2b
and Farouk Yalaoui
2c
1
Brodart Packaging, 42 Rue de la Paix, 10000 Troyes, France
2
Laboratory of Industrial Systems Optimization (LOSI), University of Technology of Troyes, 12 Rue Marie Curie, CS42060,
10004 Troyes Cedex, France
Keywords: Multiple Criteria Decision Analysis, Workflow Analysis, Process Mapping, Production System, Scheduling.
Abstract: The aim of this study is to analyze the possible application of multiple criteria decision approach for a relevant
workflow analysis in a French printing company. An important result and contribution of this paper will be
precisely to show that MCDA could be an important decision tool to analyze and identify the main stream for
make to order environment. An overview of the logical structure of the process on how things actually operate
on the production, is presented. To summarize, this paper demonstrates and presents a new approach for using
MCDA for a workflow analysis and discusses its application in a real case study where production faces
various variations.
1 INTRODUCTION
The characterization of a production system is one of
the most important steps before any improvement or
optimization approach.
In industry, we meet a variety of different
workshops and thus of productions systems. The most
adopted in industry are: flow shop (FS), Job Shop (JS)
and Open Shop (OS); see (Metaxiotis et al., 2001),
(Komaki et al., 2019), (Mohan et al., 2019), for a
review.
Table 1: Abbreviations.
MCDA Multiple criteria decision anal
y
sis
MTO Make to order
MCABC Multiple criteria ABC classification
MCIC
Multiple criteria inventory
classification
AHP Anal
y
tic hierarch
y
process
From a scheduling perspective, the aim of a good
workflow process characterization is to identify and
determine the workshop configuration, in order to
apply suitable and appropriate scheduling rules.
a
https://orcid.org/0000-0003-0915-2388
b
https://orcid.org/0000-0003-0250-7959
c
https://orcid.org/0000-0001-7360-2932
However, for MTO environment, and due to the
constantly fluctuating stream, the analysis of the
whole workflow become very difficult. To address
this problem, we used MCDA in order to analyze the
process, step-by-step, in detail, across all the product
families. The basic idea is to identify and outline the
main production stream. Thus, minimizing the
number product families required to represent the
manufacturing process.
MTO companies are very complex, the flow of
material is highly fluctuating and flexible. This
flexibility is seen as a key characteristic of successful
organizations (Scherrer-Rathje et al., 2014). Several
factors lead to increase this flexibility, such as an
ever-changing landscape of customer demand or a
wide range of customized products. However, this
flexibility produces diversity and create variations
that makes it hard to manage from a scheduling
perspective. In contrast, Accurate scheduling plays
also an important role in the success of MTO
companies (Lödding et al., 2014). The first step
before any scheduling approach is to characterize and
determine the process configuration, this step requires
a thorough understanding of critical and strategic
product families. For MTO organizations that deals
Oujana, S., Amodeo, L. and Yalaoui, F.
Logical Workflow Analysis based on Multiple Criteria Decision Analysis: Industrial Application for a Make to Order Environment.
DOI: 10.5220/0010248604010407
In Proceedings of the 10th International Conference on Operations Research and Enterprise Systems (ICORES 2021), pages 401-407
ISBN: 978-989-758-485-5
Copyright
c
2021 by SCITEPRESS – Science and Technology Publications, Lda. All rights reserved
401

with thousands of products, it is unrealistic to provide
equal consideration to each product. That’s why
product classification is crucial in order to give more
importance to the most valuable ones and focus into
the main factors. ABC analysis utilizes hierarchical
categorization, the products are partitioned into 3
classes so that their management becomes easier.
In this work we used MCDA based on ABC
principle, in order to analyze the manufacturing
process step-by-step in detail across all its product
families. The main role of this classification in our
case study is to makes it easier to deal with and to
understand a manufacturing process that faces
variations, by breaking it down into three segments.
A successful segmentation will allow to point out the
most valuable ones, thus it becomes easier to focus,
and apply accurate priority rules.
MCABC is a well-known technique traditionally
used for inventory management. It is based on the
Pareto principle (Pareto, 2007) which denotes that
approximately 80% of the effects come from 20% of
the causes. This classification, allows to divide items
into three different classes A-B-C according to their
importance for a selected criterion. Category A is the
smallest one but account for the greatest amount of
the selected criterion. In contrast, class C items are
relatively large in number, but make up relatively
small amount the criterion. Items between classes A
and C are categorized in category B.
The main aim here is to analyze the process
workflow from a new perspective, through all its
product families allowing managers to get a clear
picture of where the greatest contribution can be
made. For the underlying problem two criteria were
selected, namely, Sales revenue (SR) and Quantity
produced (Q), these criteria are the most
representative for the studied process. The objective
here is to make a coordinated classification by
combining both SR and Q in order to point out the
main flow that represents the most relevant product
families, the strategic ones, that account for a high
sales revenue and high quantity produced.
Summarizing, this paper addresses the use of bi-
criteria ABC analysis in classifying product families.
We aim here at providing information about the
choice of the key criterion as well as the methodology
follows to manage the items in each category. The
results indicate that ABC classification could be a and
efficient tool for understanding the workflow process
it enables to pinpoint the key elements of a business
so that they can be appropriately managed.
The paper is structured as follows. In the next
section we review briefly the existing literature on
ABC analysis. Section 3 presents the methodology
followed, starting with a brief description of the scope
of the study, and then data collection, and ending with
data analysis. We then present and discuss the main
results derived from the analysis. Finally, we end up
the paper with a conclusion as well as future research
directions.
2 LITERATURE REVIEW
It is clear that there vast differences among different
configurations of production processes: job shop,
flow shop, open shop… because the differences
among them have an important implications for the
choice of the production planning and scheduling
system (Silver et al., 2016).Therefore an appropriate
characterization and identification of process
configuration is an important step in order to define
accurate scheduling rules. According to (Kurtzberg et
al., 1994), To manage highly complex manufacturing
enterprises, ABC utilizes hierarchical, dynamic
modeling with recursive control and optimization. At
each hierarchical level, the process is partitioned into
logical groups so that treatment is simplified and
manageable. Further, ABC minimizes the number of
parameters required to represent the manufacturing
process and ranks contributions of variables to the
process by significance.
The objective in this work is to use ABC principle
which is defined as a powerful decision-making tool
that identifies items that have a significant impact on
an overall criterion (Yu, 2011). The use of this
classification tool will allow to identify the major
product families -class A- that represents potentially
the largest value and provides us with an insight of
the process configuration that represents the most
important and valuable product ranges.
ABC analysis uses most of the time the dollar
usage criterion. However, several researchers have
proposed methods that consider other factors than
annual dollar usage. (Benito E. Flores et al., 1987)
were the first researchers who outlined the
importance of considering multiple criteria in the
ABC analysis. They introduced the idea of a matrix-
based approach for the multi-criteria ABC
classification. A joint criteria matrix was put forward
within the ABC framework by means of considering
two criteria, their approach was tested on an industrial
application. They highlighted that the use of the
matrix can provide managers with an explicit method
for taking a range of criteria into account. Other
various approaches for addressing the MCDA
problem have been proposed in the literature for the
purpose. (Cohen et al., 1988) and (Ernst et al., 1990)
ICORES 2021 - 10th International Conference on Operations Research and Enterprise Systems
402
have used cluster analysis to group similar items. The
analytic hierarchy process (AHP) (Saaty, 1987) has
been employed in many MCIC studies (F.Y. Partovi
et al., 1993) (Gajpal et al., 1994).Heuristic
approaches based on artificial intelligence, such as
genetic algorithms (Guvenir et al., 1998) and artificial
neural network (Fariborz Y Partovi et al., 2002), have
also been applied to address the MCIC problem.
To summarize, there have been many
contributions in the literature which have
concentrated on the application of ABC classification
for inventory control. However, and to the best of our
knowledge, it has been rarely studied for a relevant
process analysis. In this paper, we are striving to
propose a simple joint criteria matrix based on
(Benito E. Flores et al., 1987) method, in an MTO
environment, in order to categorize product families
into classes that require somewhat different strategies
for planning and scheduling. This classification
allows to reflect the main flow and provide managers
with a thorough understanding of critical and strategic
product families, allowing to focus attention, and give
more importance to them.
3 METHODOLOGY
This section provides a brief overview of the case
study and describes the use of MCABC for an
industrial company for its process analysis.
3.1 Case Study
Our study was conducted in a packaging printing
company based in France. That mainly uses make to
order policy, characterized by multiple flows that
merge. Mapping and analyzing the whole process at
the same time is not easy and usually not even
feasible. Thus, the mapping process should begin
from the main strategic flow. This company produces,
converts and prints flexible packaging. Some
examples of products manufactured are: pouches,
reels, sheets and labels. Each product P goes through
several processing operations depending on its
product family or manufacturing operating range,
such as printing, coating, perforation and lamination.
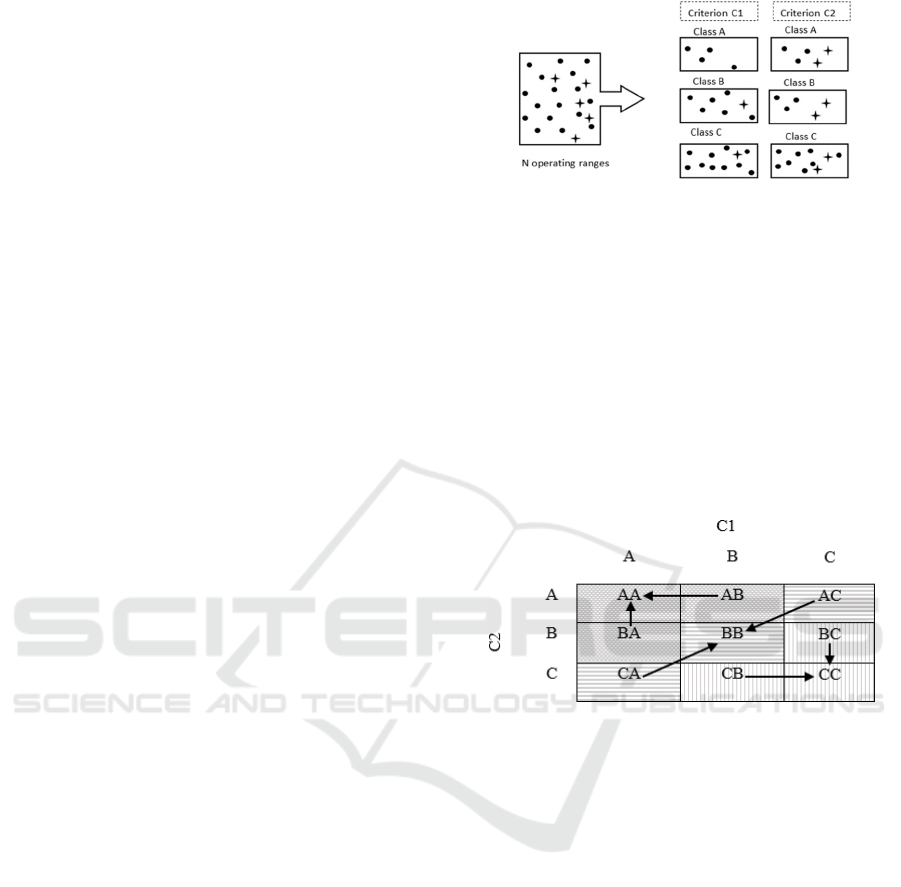
Assume that we have N ranges of manufacturing
g (g =1,…, N), that have to be classified as A, B or C,
according to 𝐶
criteria .In particular let the
performance of the 𝑛
operating range in terms of
each criteria be denoted as 𝑋
. Let us also assume
that the larger the score of an item g in terms of these
criteria is, the greater is the chance that the item be
classified as an A class item.
Figure 1: ABC classification.
Complex computational tools are needed for
multi-criteria ABC classification (Ramanathan,
2006). (B.E. Flores et al., 1986) have developed a
joint criteria matrix in the case of two criteria, the
combination of these two criteria leads to the
definition of nine distinct product classes ranging
from AA (upper grade) to CC (lower grade). The
model can be represented in a practical way in the
form of a joint matrix criteria, as shown in Figure 2.
As indicated by the arrows, the classification rule for
a AB and BA with AA, AC and CA with BB and BC
and CB with CC (Chen et al., 2008).
Figure 2: Bi-criteria joint matrix.
3.2 Multiple Criteria Analysis
For this particular study, the steps to conduct this
classification were as follows: 1) Key criteria
selection, 2) Data collection 3) Data analysis.
3.2.1 Key Criteria Selection
This work began with selecting key criteria that fulfil
and characterize the studied organization. It is
recognized that there is no universal methodology for
criteria selection. The main idea is the selection of an
optimal manufacturing process which considers the
most significant and important criteria for the
process. Thus, the problem has to be observed as a
multi‐criteria problem. These criteria depend on the
nature of the industry and may include: average
revenue, lead time, demanded volume, total delay …,
they should meet management’s objectives and be the
most representative for the process
For the underlying organization, let us consider
two criteria: annual revenue (AR) and the demand
Logical Workflow Analysis based on Multiple Criteria Decision Analysis: Industrial Application for a Make to Order Environment
403

volume (DV) per product range. These criteria are the
most relevant for the studied organization because:
- The sales revenue (SR): SR Is the yearly amount
realized by a group of products that have the same
manufacturing operations. It allows to visualize
clearly the importance of the different ranges for
the company. It makes it possible to determine
which ranges make the biggest contribution for
the overall revenue.
- Demand volume (DV): is the average yearly
quantity produced per product family. Provides
details about the products that occupies the most
the workshop. In this way, it is possible to
understand how the total quantity is distributed
among different product types.
3.2.2 Data Collection
The monthly data of all the tasks involved in the
production process were obtained from the industry
for a period of one year, using SQL query.
The data collected has been analysed using the
Excel sheet, the products were grouped into families
according to their operating ranges. A product family
is defined as a group of products that pass through
similar processing steps.
The overall data of the product families involved
in the production system were interpreted, and
summarized based on two criteria: the sales revenue
and the produced quantity.
The sales revenue associated with each product
family was obtained using (1), and the quantity
produced was calculated using (2).
- Calculation of sales revenue per operating range
SR (𝐺
):
S
R
G
= l
Q
P
∗UP
P
,∀ G = G
(1)
- Calculation of the quantity produced per
operating range Q
G
:
Q
G
= l
Q
P
,∀ G = G
(2)
According to each criterion, the operating ranges
were ranked in descending order starting with the
largest value to the smallest. The cumulative
percentage was then calculated and two distinct
Pareto distributions were performed.
For each product family 𝐺
, the percent of
quantity produced Q and the selling revenue is
mentioned in Table 2.
Table 2: MCABC using annual Euro usage, and produced
quantity based on a joint matrix.
Range % SR % Q
ABC classification
Optimal
Classification
SR Q
G1 20% 16% A A A
G2 10% 12% A A A
G3 8% 9% A A A
G4 7% 7% A A A
G5 7% 6% A A A
G6 7% 5% A A B
G7 7% 3% A A B
G8 6% 3% A A B
G9 5% 2% A A B
G10 5% 2% A A B
G11 4% 2% B B B
G12 3% 2% B B B
G13 3% 7% A B A
G14 2% 2% B B B
G15 2% 2% B B B
G16 2% 1% C B C
G17 2% 1% B B B
G18 2% 9% B B A
G19 2% 1% B B C
G20 2% 3% B B B
G21 2% 3% B B B
G22 1% 2% B C B
G23 1% 10% B C A
G24 1% 1% C C C
G25 0% 5% B C A
G26 0% 1% C C C
G27 0% 1% C C C
G28 0% 0% C C C
G29 0% 0% C C C
G30 0% 0% C C C
G31 0% 0% C C C
G32 0% 0% C C C
G33 0% 0% C C C
G34 0% 0% C C C
G35 0% 0% C C C
G36 0% 0% C C C
G37 0% 0% C C C
G38 0% 1% C C C
G39 0% 2% C C B
ICORES 2021 - 10th International Conference on Operations Research and Enterprise Systems
404
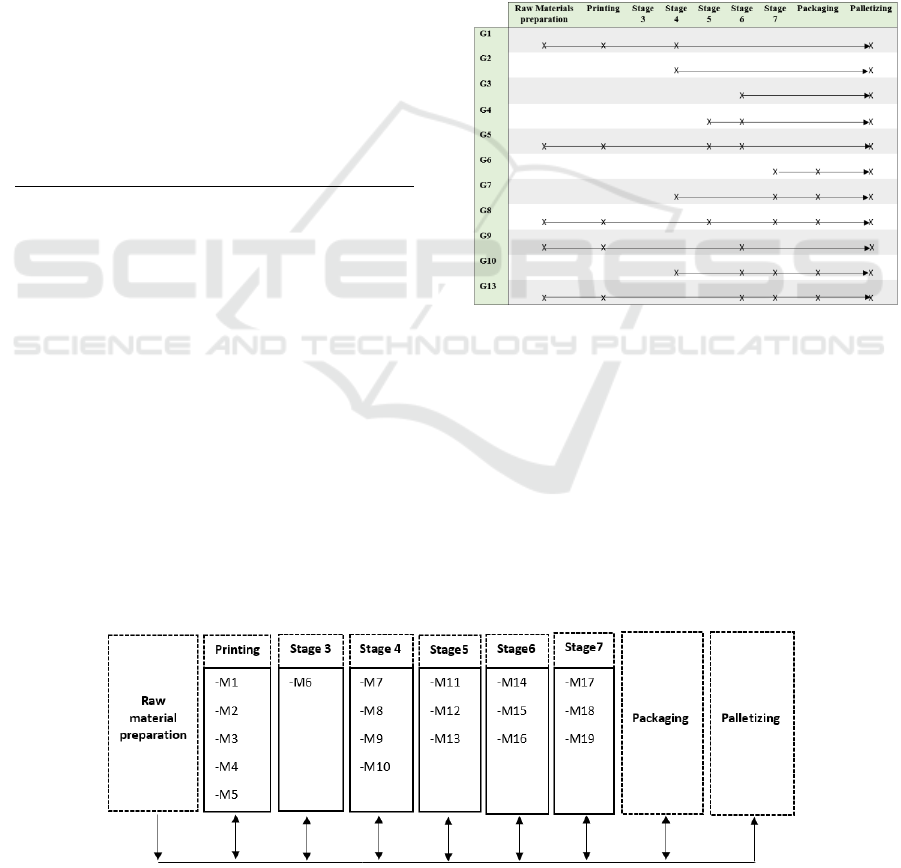
Table 2: MCABC using annual Euro usage, and produced
quantity based on a joint matrix (cont.).
G40 0% 1% C C C
G41 0% 4% B C A
G42 0% 0% C C C
G34 0% 0% C C C
G44 0% 0% C C C
G45 0% 2% C C B
G55 0% 0% C C C
G56 0% 0% C C C
G57 0% 0% C C C
G58 0% 2% C C B
G59 0% 2% C C B
G60 0% 2% C C B
G61 0% 3% B C A
G62 0% 0% C C C
G63 0% 0% C C C
G64 0% 0% C C C
G65 0% 0% C C C
The operating ranges are categorized into A, B
and C classes, where class A contains the strategic
ranges, that should receive the most important
attention. B class items are less important and C class
items are of very low importance
Class A workflow map was then drawn allowing
to vizualize clearly the flow structure of the major
product ranges that contribute the most to the success
of the company.
3.2.3 Data Analysis
Once items have been grouped into clusters, the target
value stream can be identified by simply drawing all
class A product families.
The close examination of class A map has
revealed a regularity in the logical structure of the
flow (Figure 3) which is characterised by a linearity.
The exact process map with all details cannot be
disclosed due to confidentiality reasons. A macro
logical workflow process is developed in Figure 4. It
shows the current state map that was constructed; the
boxes in the map represent the processing steps and
the number inside the box is the number of machines
at each process. The machines are grouped by stage E
(e = 1,…, 9). Each stage E is made up of a set of me
machines (me ⩾1) of the same trade, of the same
production capacity or of different production
capacity, Called mixed parallel machines (hybrid).
The logical workflow map offers a clear outlook on
the process configuration, it outline the most relevant
stream, so that adequate scheduling rules can be
properly applied .
Figure 3: Class A workflow.
Class A workflow mapping highlights that the
workflow tend to be linear, e.g. there is no going back
to an earlier stage. but flexible in the sense that from
a product to another one, the operating ranges
involved might be different. The operating ranges of
each product is predefined according to the
processing requirements. We note very well that all
the ranges of class A are linear, this means that this
zone can be assimilated to a flexible and hybrid Flow
shop workshop with skipping (following the
manufacturing range).
Figure 4: Logical workflow.
Logical Workflow Analysis based on Multiple Criteria Decision Analysis: Industrial Application for a Make to Order Environment
405

4 CONCLUSIONS
It is not easy to analyze the workflow in the case of
complex production processes characterized by
multiple flows that merge. To address this problem,
the basic idea in this study was to execute a thorough
process analysis through all product families in order
to identify the main flow using MCABC, under two
criteria: Selling revenue and quantity produced, these
criteria are the most relevant for the studied firm. This
aggregation has allowed to reduce significantly the
number of product families requiring extensive
management attention.
The analysis of the different ranges involved in
the studied process, has allowed to obtain, analyze,
and reflect on a set of information of high importance
and understand the complexity of the process. This
work contributed to a better knowledge of the
company, bringing a greater degree of detail on the
evolution of the industrial activity, allowing to verify
the importance of certain ranges, and highlight those
with high value for the company. To summarize, this
work enables us to define the appropriate
configuration of the process: Hybrid and flexible flow
shop, which have an important role in defining
suitable scheduling rules taking into account the most
significant parameters.
As future research, we try to compare the logical
workflow to the physical layout, and then, to propose
an arrangement of machines that suits the main
logical flow which will enable the manufacturing
process to be carried on efficiently.
REFERENCES
Chen, Y., Li, K. W., Marc Kilgour, D. and Hipel, K. W., A
Case-Based Distance Model for Multiple Criteria ABC
Analysis, Computers & Operations Research, vol. 35,
no. 3, pp. 776–96, March 1, 2008. DOI:
10.1016/j.cor.2006.03.024
Cohen, M. A. and Ernst, R., Multi-Item Classification and
Generic Inventory Stock Control Policies, Production
and Inventory Management Journal, vol. 29, no. 3, pp.
6–8, 1988.
Ernst, R. and Cohen, M. A., Operations Related Groups
(ORGs): A Clustering Procedure for
Production/Inventory Systems, Journal of Operations
Management, vol. 9, no. 4, pp. 574–98, 1990. DOI:
10.1016/0272-6963(90)90010-B
Flores, B. E. and Whybark, D. C., Multiple Criteria ABC
Analysis, International Journal of Operations and
Production Management, vol. 6, no. 3, pp. 38–46, 1986.
Flores, Benito E. and Whybark, D. C., Implementing
Multiple Criteria ABC Analysis, Journal of Operations
Management, vol. 7, no. 1–2, pp. 79–85, 1987. DOI:
10.1016/0272-6963(87)90008-8
Gajpal, P. P., Ganesh, L. S. and Rajendran, C., Criticality
Analysis of Spare Parts Using the Analytic Hierarchy
Process, International Journal of Production
Economics, vol. 35, no. 1–3, pp. 293–97, 1994.
Guvenir, H. A. and Erel, E., Multicriteria Inventory
Classification Using a Genetic Algorithm, European
Journal of Operational Research, vol. 105, no. 1, pp.
29–37, 1998.
Komaki, G. M., Sheikh, S. and Malakooti, B., Flow Shop
Scheduling Problems with Assembly Operations: A
Review and New Trends, International Journal of
Production Research, vol. 57, no. 10, pp. 2926–55,
May 19, 2019. DOI: 10.1080/00207543.2018.1550269
Kurtzberg, J. M. and Levanoni, M., ABC: A Better Control
for Manufacturing, IBM Journal of Research and
Development, vol. 38, no. 1, pp. 11–30, January 1994.
DOI: 10.1147/rd.381.0011
Lödding, H., Nyhuis, P., Schmidt, M. and Kuyumcu, A.,
Modelling Lateness and Schedule Reliability: How
Companies Can Produce on Time, Production Planning
& Control, vol. 25, no. 1, pp. 59–72, January 2, 2014.
DOI: 10.1080/09537287.2012.655803
Metaxiotis, K. S., Ergazakis, K. and Psarras, J. E., An
Elaborate Analysis of Production Systems in Industry:
What a Consultant Should Know, Industrial
Management & Data Systems, vol. 101, no. 4, pp. 185–
93, January 1, 2001. DOI:
10.1108/02635570110390170
Mohan, J., Lanka, K. and Rao, A. N., A Review of Dynamic
Job Shop Scheduling Techniques, Procedia
Manufacturing, vol. 30, pp. 34–39, January 1, 2019.
DOI: 10.1016/j.promfg.2019.02.006
Pareto, V., Considerations on the Fundamental Principles
of Pure Political Economy, Routledge, pp. 193, 2007.
Partovi, Fariborz Y and Anandarajan, M., Classifying
Inventory Using an Artificial Neural Network
Approach, Computers & Industrial Engineering, vol.
41, no. 4, pp. 389–404, February 1, 2002. DOI:
10.1016/S0360-8352(01)00064-X
Partovi, F. Y. and Burton, J., Using the Analytic Hierarchy
Process for ABC Analysis,
International Journal of
Production and Operations Management, vol. 13, no.
9, pp. 29–44, 1993.
Ramanathan, R., ABC Inventory Classification with
Multiple-Criteria Using Weighted Linear Optimization,
Computers & Operations Research, vol. 33, no. 3, pp.
695–700, March 1, 2006. DOI:
10.1016/j.cor.2004.07.014
Saaty, R. W., The Analytic Hierarchy Process—What It Is
and How It Is Used, Mathematical Modelling, vol. 9,
no. 3, pp. 161–76, January 1, 1987. DOI: 10.1016/0270-
0255(87)90473-8
Scherrer-Rathje, M., Deflorin, P. and Anand, G.,
Manufacturing Flexibility through Outsourcing: Effects
of Contingencies, International Journal of Operations
& Production Management, vol. 34, no. 9, pp. 1210–
42, January 1, 2014. DOI: 10.1108/IJOPM-01-2012-
0033
ICORES 2021 - 10th International Conference on Operations Research and Enterprise Systems
406

Silver, E. A., Pyke, D. F. and Thomas, D. J., Inventory and
Production Management in Supply Chains, CRC Press,
pp. 810, 2016.
Yu, M.-C., Multi-Criteria ABC Analysis Using Artificial-
Intelligence-Based Classification Techniques, Expert
Systems with Applications, vol. 38, no. 4, pp. 3416–21,
April 1, 2011. DOI: 10.1016/j.eswa.2010.08.127
Logical Workflow Analysis based on Multiple Criteria Decision Analysis: Industrial Application for a Make to Order Environment
407
