
Characterization of Upper Limb Functionality Caused by
Neuromuscular Disorders using Novel Motion Features from a
Specialized Gaming Platform
A. Chytas
1a
, D. Fotopoulos
1b
, V. Kilintzis
1c
, E. Koutsiana
1
, I. Ladakis
1
, E. Kiana
2
, T. Loizidis
2
and I. Chouvarda
1d
1
Laboratory of Computing, Medical Informatics and Biomedical Imaging Technologies,
Aristotle University of Thessaloniki, Thessaloniki, Greece
2
Theodoros Loizidis Apokatastasi LTM, Thessaloniki, Greece
Kiana.Elpida@Gmail.Com, Loizidis@Yahoo.Com, Ioannach@Auth.Gr
Keywords: Gamification, Rehabilitation, Signal-analysis, Neuromuscular Disorder, Upper-limb Motion, Classification.
Abstract: This paper describes the methodology for analyzing upper limb motion data derived from a novel Gamified
Motion Control Assessment platform that is based on a virtual 3D game environment. The gamified approach
targets patients experiencing upper-limb movement hindrances, typically caused by neuromuscular disorders.
The leap motion controller is used for interaction. The game guides the avatar to move along the X and Y axis
following specific paths. The avatar mimics the movement of the user's hand that performs these movements
for rehabilitation. In order to use this method for the training and assessment patient’s motion, a quantified
approach that uses the game-based motion for patient assessment is required. Besides simple game scores that
are often used, the proposed data analysis aims to elaborate on the discrimination between pathological and
healthy movement with a machine learning approach, as well as the quantification of the patient’s progress
over time. For this purpose, movement and performance-related features were extracted from the leap sensor
recordings and their value was explored towards characterizing the patient state and progress in detail. A
dataset with multiple recordings from patients and healthy individuals was used for this purpose. All patients
suffered from neuromuscular disorders. The features with the highest discriminatory value between the two
groups were subsequently used to develop a set of classifiers for different sets of movements (e.g., horizontal,
diagonal, vertical). A patient was left out of the classifier creation procedure and used for external validation.
The models achieved high accuracy (92.13%). These results are deemed promising for the quantification of a
patient’s progress.
1 INTRODUCTION
Motor control is a complex process or a set of sub-
processes that involves the coordination of muscles
and limbs in order to perform a motor skill either
voluntary or as a reflex. Humans from birth are
trained in motor control by integrating sensory-motor
information, a procedure called Motor-learning.
Firstly, through observation and later via repetition,
movements are consolidated in the Central Nervous
System (CNS). Certain pathologies or injuries affect
a
https://orcid.org/0000-0001-8486-011X
b
https://orcid.org/0000-0001-8605-8593
c
https://orcid.org/0000-0002-9783-6757
d
https://orcid.org/0000-0001-8915-6658
the CNS resulting in the loss of cognitive functions of
the brain. This may impact several motor functions
and cause partial or complete loss.
Rehabilitation programs aim to detect motor
deficits and help patients regain control of their
movements through motor learning. The standard
procedure is the repetitive training of isolated
movements’ correct form.
There has been an increasing amount of studies
regarding the assistance of physical rehabilitation and
conventional treatment methods via technology
60
Chytas, A., Fotopoulos, D., Kilintzis, V., Koutsiana, E., Ladakis, I., Kiana, E., Loizidis, T. and Chouvarda, I.
Characterization of Upper Limb Functionality Caused by Neuromuscular Disorders using Novel Motion Features from a Specialized Gaming Platform.
DOI: 10.5220/0010244400600068
In Proceedings of the 14th International Joint Conference on Biomedical Engineering Systems and Technologies (BIOSTEC 2021) - Volume 4: BIOSIGNALS, pages 60-68
ISBN: 978-989-758-490-9
Copyright
c
2021 by SCITEPRESS – Science and Technology Publications, Lda. All rights reserved

(Meijer et al., 2018),(Ang and Guan, 2013). This
interest in technology-based rehabilitation has led to
the development of an emerging domain that
combines exergames, gamification mechanisms and
traditional rehabilitation methodologies (Smeddinck
et al., 2015). These novel treatment methodologies
combine software and hardware to facilitate the
process of Motor Learning, by introducing an
efficient (Veerbeek et al., 2017) and more rewarding
way of performing a series of repetitive and
functional movements, which are required for the
rehabilitation of patients with motor deficits.
Gamification and serious gaming are regarded as
means for inducing positive health behavioural
change (Sardi et al., 2017), but there is still lack of
solid evidence and consolidated approaches and
means for quantification progress.
There are various research approaches that are
integrating Leap motion sensor in their system. One
example is a system that was suggested in 2014
(Charles et al., 2014) for the rehabilitation of wrist
and fingers that used Leap as a part of a game that
engaged the user to pick up various objects and place
them correctly in order to form a specific shape or
construction. Another example is a system (Elnaggar
and Reichardt, 2017) that was also suggested for the
rehabilitation of hand, wrist and fingers and was
trying to exercise hand’s grip and movement.
Overall, gamification mechanisms integrated
appropriately in standard therapy regimens and
protocols, have been found to be sufficiently effective
in a wide range of diseases involving motion, for
example in stroke (Henderson et al., 2007; Tamayo-
Serrano et al., 2018) or in Parkinson’s disease with
leap motion (Oña et al., 2018).
The current work is based on a custom
rehabilitation platform that can be used as a tool for
the medical treatment of patients with physical
impairments of the upper limbs (Chytas et al., 2020),
including arm, axilla and shoulder. It supports the
idea of a ‘gaming as a health service’ (GaaHS),
providing the physician the ability to remotelly
monitor patients and adjust their treatmeant. The
platform is aiming to optimize the Motor Control and
Learning processes by providing an engaging way for
rehabilitation exercise execution along with a set of
statistical tools that evaluate quantitatively the
patient's upper limb motion and overall performance.
The analysis of upper limb motion is a challenging
task due to its multidimensional nature. We propose
a novel set of features that characterizes upper limb
motion along with gameplay related features. Our aim
is to establish a baseline that can distinguish between
healthy and pathological movement and additionally
quantify the patient's rehabilitaion progress and
improvement.
2 BACKGROUND AND
RATIONALE
Currently, the GaaHS platform (Chytas et al., 2020)
consists of one game scenario that incorporates basic
rehabilitation exercises in its mechanics. It follows
the flying simulation paradigm. The user is asked to
guide a red polygon airplane (avatar) through
orthogonal game objects (gates) that are placed across
the scene. The interaction between the user and his
avatar is achieved by the camera sensor Leap Motion
Controller, which utilizes computer vision
technology to recognize hands in its field of view and
calculates a set of measurements that describe them.
The general therapy protocol focuses on these
exercise movements: horizontal adduction/abduction
of the shoulder, and supination/pronation of the
forearm. The hand is placed above the sensor and
moves along the horizontal and vertical plane, as well
as rotate along the Z-axis. In the virtual world of the
game, the airplane mimics the hand’s movement.
Because of the strictly defined set of movement
exercises, it was a requirement-based design decision
that the airplane avatar of the game cannot move with
six degrees of freedom. Thus, the airplane’s
movement is confined to the X and Y plane, a
restriction that made it quite challenging to achieve a
degree of immersion of the user in the game world.
The gate objects that the user leads the aircraft
through, appears in a predefined 3x3 grid Figure 2.
The goal is the highest possible number of repetitions,
so the condition for the end of a game session is either
a time limit or a limit on the number of the gates. A
secondary objective of the game is to collect the
‘coins’ that are placed in the middle of a gate. This
provides the user with a clear target of where he/she
should aim to “fly” through, and it might later be
helpful in discerning patterns during the analysis
process.
After the completion of the course, a score is
awarded to the user that represents the number of
gates he/she managed to go through. A rough metric
of the performance is the percentage of successful
gates. This score is useful both as a means for
motivating the user and as a summarized, high level
index of the user’s ability to perform the task, useful
for the rehabilitation healthcare professional.
However, it is questionable whether this index is
adequately informative for the patient’s detailed
condition or for specific problems in movement and
their progress over time.
Characterization of Upper Limb Functionality Caused by Neuromuscular Disorders using Novel Motion Features from a Specialized
Gaming Platform
61
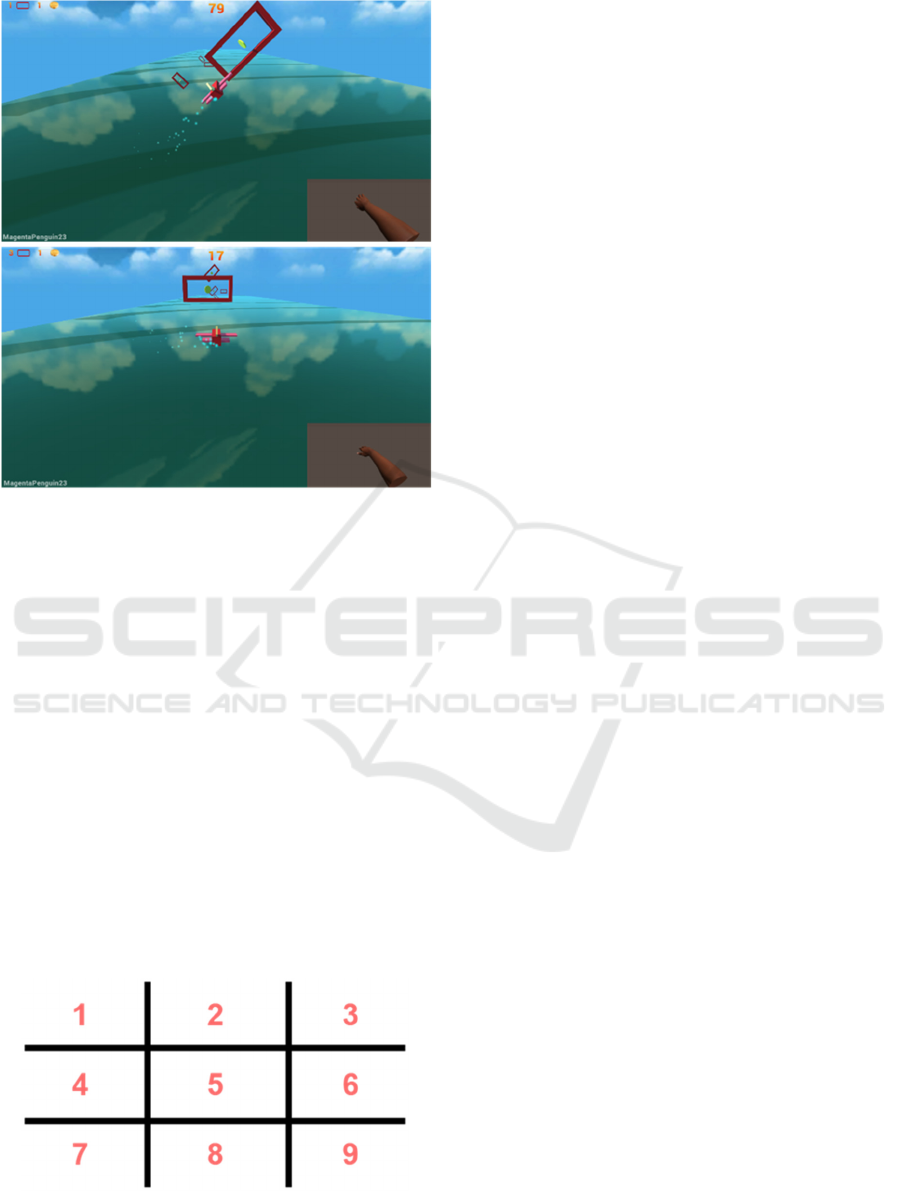
Figure 1: Movement of the hand and its effect on
the virtual world of the game.
Similar studies use the respective game score and
task completion time features to evaluate the patient’s
progress (De Leon et al., 2014) while others delve
further into analysing the trajectory using motion
features (Tang et al., 2017). We propose a new
strategy that enables detailed evaluation combining
elements of both approaches. We split hand
movement into discrete segments resulting in more
detailed time characteristics, use derived trajectory
characteristics (such as acceleration per axis), we also
include a variation of our game score (proximity to
the target instead of success or failure) and
distinguish between groups of movement that are
activated by different muscle groups. Our approach is
based on fine grained time features with a
combination of commonly used motion
characteristics that derive from medical needs and are
meaningful to the physician.
Figure 2: Gates 3x3 grid where the gates appear.
3 MATERIAL AND METHODS
The main focus of the analysis on the current stage is
to determine the variables that are going to be
examined and explore the differences between
healthy and pathological movement.
Our hypothesis is that the proposed movement
features differ among healthy subjects and patients,
and that they reflect changes over time. Regarding the
classification of movement, a two-phase procedure
was followed. In Phase 1, we examined if the creation
of such classifiers is feasible using a dataset
consisting of healthy subjects and patients. In Phase
2, we used external data to verify the results.
3.1 Data
For this analysis, we collected data from 8 subjects; 3
patients undergoing rehabilitation and 5 healthy
individuals not diagnosed with a related motor control
/ central neural system disorder. Healthy subjects
were of ages 25-38 with one of them being female
(20%), while all patients are males in their 20s. The
patients performed the games using the hand in need
of physiotherapy (right hand in both cases) while the
healthy subjects were using their dominant hand
(20% were left-handed). Those gaming sessions were
in addition to the routinely prescribed physiotherapy
treatment the patients were receiving at that time. The
data acquisition protocol was approved by the Bio-
ethics committee at the Aristotle University of
Thessaloniki (AUTH) and the patients signed a
consent form.
The data acquisition for the healthy subjects
lasted 2 weeks, while the patients’ data were retrieved
based on the amount of time they were receiving
physiotherapy, the occurrence rate of the therapy, and
the settings the physician deemed proper based on
their current condition and general progress. An
upcoming pilot will follow a more refined protocol
for all participants. The healthy subjects performed 2
sessions per week for 2 weeks (4 sessions total). The
first week’s sessions were performed in normal
difficulty settings while the second week’s, in hard
difficulty settings. Each session consisted of 10
games and each game had a duration of 90 seconds.
The difficulty settings affect the avatar’s constant
movement rate on the Z-axis, substantially reducing
the time required for the avatar to move from one gate
to another. Of note, according to all healthy subjects’
feedback, the normal settings were more bothersome
than the hard ones since the subjects were supposed
to keep their hand steady for a longer period. Each
healthy subject (H1-5) had 4 gaming sessions, 40
games and 800 gates. Percentages of gates the
BIOSIGNALS 2021 - 14th International Conference on Bio-inspired Systems and Signal Processing
62
subjects H1-5 successfully navigated through were 1,
0.942, 0.985, 0.995 and 1 respectively.
As far as the patients are concerned, their data
have been collected in a span of 9 months (P1) and 6
months (P2 and P3) accordingly. Specifically, P1 had
39 gaming sessions, 652 games played, and went
through 19033 gates, P2 had 24 gaming sessions, 378
games and 10300 gates, while P3 corresponding
statistics are 16 gaming sessions 184 games and 2107
gates. The difficulty settings were gradually changed
from normal to hard to eventually very hard in the
span of their treatment for P1 and P2. P3 difficulty
settings remained to normal. Percentages of
successful gates for the patients P1-3 were 0.946,
0.969 and 0.718 respectively.
The dataset used for the classification stage
consisted of 4000 gates for the healthy subjects H1-5
and 29333 gates for patients P1,2. The gates were
grouped based on the type of movement, vertical,
horizontal, diagonal and the direction (e.g., top to
bottom, etc.). P3 was used as an external validation
dataset.
The distinction of direction was deemed
important from a medical viewpoint, since such
movements involve the activation of different muscle
groups, e.g., horizontal abduction (Latissimus dorsi
and posterior fibers of deltoid) and adduction
(Pectoralis major and anterior fibers of deltoid)
(Elzanie and Varacallo, 2018). This distinction also
makes sense from a statistical analysis point of view
(e.g., the metrics of the X-axis are expected to differ
when the subject performs a horizontal movement vs
a vertical one).
3.2 Feature Extraction
The raw data points acquisition rate is tied to the
frame rate at which the game runs. Although the
frame rate for the game was capped at 60 fps it can
occasionally drop below 60, an occurrence more
common in systems with low computational
capabilities.
Another issue was the artefacts that occurred
when the leap sensor failed momentarily to correctly
identify the subject’s hand, typically other objects
interrupting the sensor’s field of view or nearby light
sources causing interferences. The abrupt changes in
the hand trajectory were identified using a high pass
filter, followed by an evaluation of the neighbouring
area in order to determine which part of the
movement was the artefact (if any). The data points
that were deemed as artefacts were subsequently
removed. Firstly by removing time windows that had
more than 25% out of the expected samples missing
and afterwards during the analysis.
As a next step, and in order to address both the
above issues and to facilitate an analysis that supports
exploration in the frequency domain, the time-series
of the hand coordinates were interpolated at a steady
rate of equivalent to 60 fps.
The gameplay can be distinguished into parts.
Each part corresponds to the period between two
consecutive gates (time window W
i
). The gates (G
i
)
are moving towards the avatar at a controlled pace.
Therefore, all the time windows have the same
duration, with the exception of the first gate, which
appears a few moments after the start, to provide the
user ample time to get accustomed to the game.
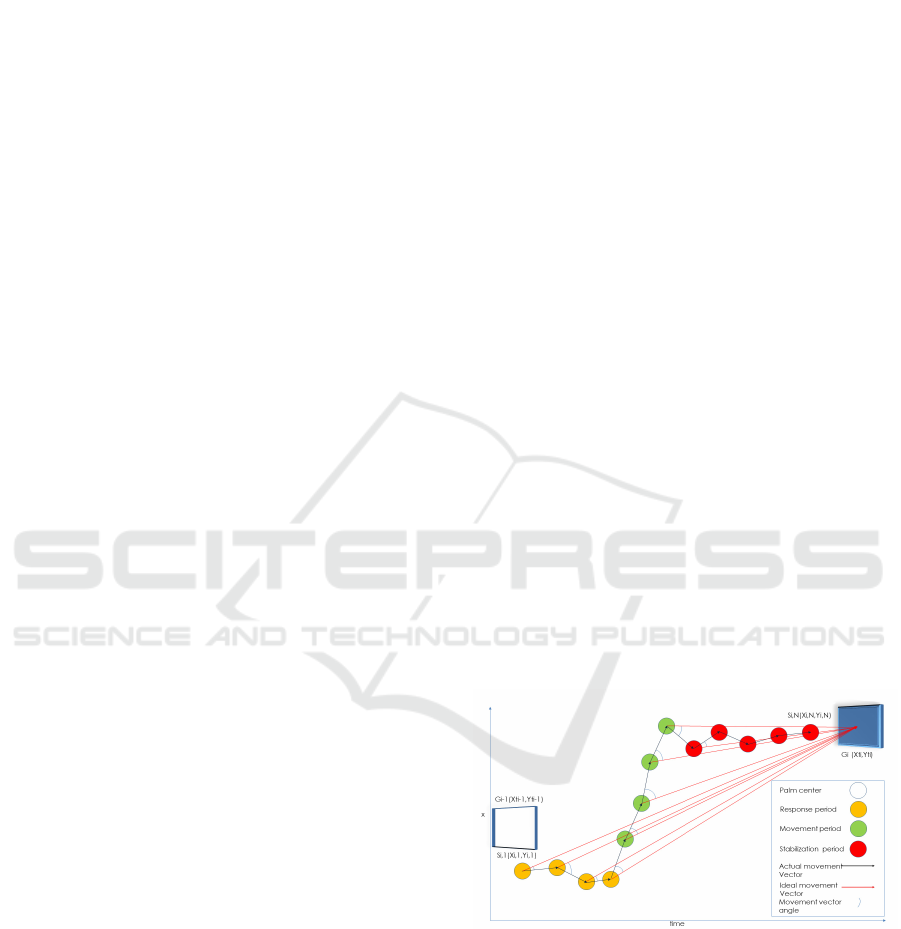
Each time window (W
i
) is further distinguished
into 3 different sub-periods (Figure 3). Those periods
were detected by examining the velocity on X and Y-
axes, considering the direction and the proximity to
the target gate.
1. Response (DT1: t0-t1): it refers to the time
period starting when the user has reached
the Gi gate until they become aware of the
upcoming gate Gi+1, and they begin to
move towards it. This is characterized as a
Steady state (orange).
2. Movement (DT2: t1-t2): it refers to the time
period where the user is moving from Gi
towards the upcoming gate Gi+1. This is a
Movement state (green).
3. Stabilization (DT3: t2-t3): it refers to the
time period from the time point that the user
has arrived to the X, Y coordinates that
correspond to the Gi+1 gate and is waiting
to reach it (plane pass through the gate) until
the time the avatar crosses the gate. This is a
Steady state (red).
Figure 3: Movement from gate Gi-1 to Gi . The Si,j
represents the hand position on each j frame for every i
window (Wi).
The features currently examined involve the
description of the movement in the time domain
(velocity, acceleration, trajectory, jitter, etc.) The
distance and the metrics that derive from it (velocity
and acceleration) are measured in in-game units.
Characterization of Upper Limb Functionality Caused by Neuromuscular Disorders using Novel Motion Features from a Specialized
Gaming Platform
63

Durations of DT1/DT2/DT3 in milliseconds
Mean/SD Velocity DT1/DT2/DT3
X/Y/both: Mean/Standard deviation of the
hand velocity on parts DT1/DT2/DT3 on
axis X/Y/ both of them.
Mean Velocity DT2 start calculated during
the first 0.25 seconds of the DT2 part.
Mean/SD Acceleration DT1/DT2/DT3
X/Y/both: Mean/Standard deviation of the
hand acceleration on parts DT1/DT2/DT3
on axis X/Y/ both axes.
Distances total travelled per time window
and total, ratio of minimum movement
required to actual
Total Distance/ Total Distance
DT1/DT2/DT3: actual distance travelled
during the whole Wi, on parts
DT1/DT2/DT3, respectively.
Minimum distance (final): minimum
distance from the center of the gate during
the whole Wi movement/ during the final 0.5
sec of the Wi movement
This amounted to a total of 28 features that were
subsequently examined.
3.3 Analysis
The gates were grouped based on the type of
movement, vertical, horizontal, diagonal and
direction.
Right to Left (r2l) Left to Right (l2r) , Up to
Bottom (u2d), Bottom to Up (d2u) Top Left to Bottom
Right (dg1) Top Right to Bottom Left (dg2), Bottom Left
to Top Right (dg3), Bottom Right to Top Left (dg4).
The analysis was focused on the subject’s
performance during the traversal from one gate to
another. For each subject, all the calculated
movement features were grouped together without
the distinction of individual games or sessions. The
order in which each gate was traversed was kept intact
and as such, we were able to examine the subject’s
progress through time. In more detail, t
he analysis
consists of following steps:
1. In each cross-validation round, split the
dataset into two parts: a) Train: 1 patient
(19033 or 10300 gates), 4 healthy subjects
(3200 gates), b) Test: 1 patient (19033 or
10300 gates), 1 healthy subject (800 gates)
2. Use one direction at a time (this reduces the
number of gates used for the training and
testing, e.g. out of the 19033 gates P1 has,
2203 belong in the u2d category)
3. On the training dataset, for each feature,
detect values that are outside the range of
four times the standard deviation. A single
out of bounds value would cause that gate to
be excluded. This further addresses the
artefact problem during data acquisition.
4. Test the features for normality using the
Shapiro–Wilk test (Shapiro and Wilk, 2015)
for normality.
5. If the variables were normally distributed,
the analysis of variation (AOV) was used,
otherwise the Kruskal–Wallis H test was
preferred (Kruskal and Wallis, 1952).
6. Adjust the p-values that derived from the
above tests using the Bonferroni correction
(B. Alt, 2006).
7. Select the statistically significant (p<0.05)
features.
8. Check those features for correlation using
the Pearson formula (Chen and Popovich,
2011).
9. Features that had a high degree of
correlation (0.8) were further examined and
the worst performing features were
removed.
10. Utilize the training dataset with the
remaining features and train a neural
network model (Kalchbrenner et al., 2014)
(these models yielded the best results in the
type of data that were used) using an internal
k-fold cross-validation with one hidden
layer and an adjustable size (range 3 to 15).
The model that was created using data from 5
subjects (4 healthy 1 patient) was tested using the
remaining two subjects (1 healthy, 1 patient). The
Leave-One-out (a healthy subject and a patient) cross-
validation approach was preferred over the k-fold
cross-validation with train and test samples mixed
from all using those 7 subjects, as this method is less
biased, i.e., the hypothesis that patients and healthy
subjects differ in their movement patterns can be
examined without any bias that is inserted by utilizing
the same subjects for testing and training.
After testing the validity of our hypothesis that
the movement patterns differ among healthy subjects
and that pathological patterns can be identified using
classifiers, we created a final set of 8 models, one for
each direction. These models were trained with the
dataset initially used in Phase 1 as a whole (P1,P2 and
H1-5). These classifiers were afterwards used in
Phase 2 on P3’s data as external validation.
To observe the patients’ progress during their
treatment, the data points of each feature were aligned
in chronological order. Following, they were filtered
using a simple moving average window as a low-pass
filter to present the underlying trend.
BIOSIGNALS 2021 - 14th International Conference on Bio-inspired Systems and Signal Processing
64
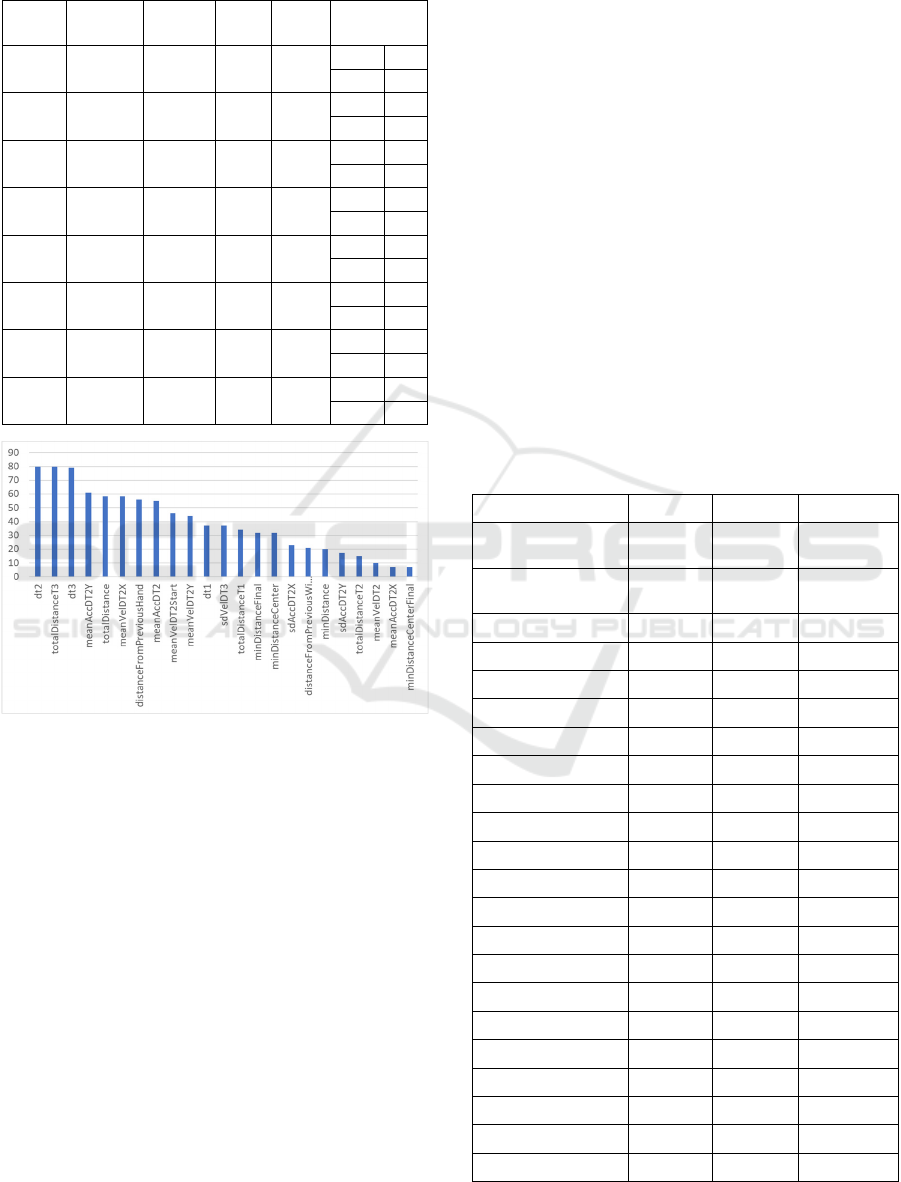
Table 1: The details of the best performing models.
Balanced Acc stands for balanced accuracy, Sense for
sensitivity, Spec for specificity, Mov. for Movement.
Mov.
type
Test Data Balanced
Acc
Sense Spec Truth Table
u2d P1 – H4 0.979 0.979 0.979
2157 2
46 96
dg1 P1 – H4 0.978 0.980 0.976
1016 1
20 41
u2d P2 – H4 0.963 0.978 0.948
1155 5
25 93
l2r P2 – H5 0.962 0.979 0.944
1158 5
24 85
d2u P2 – H5 0.953 0.969 0.938
1160 4
37 61
d2u P1 – H4 0.946 0.934 0.958
2167 4
153 93
l2r P1 – H4 0.943 0.963 0.923
2060 7
78 85
dg1 P1 – H1 0.942 0.983 0.901
1019 5
17 46
Figure 4: Feature Selection Rate, defined as the number of
times each feature is selected in the model, during the
training phase with different training sets.
4 RESULTS
Overall, the sensitivity of the proposed models
reached high levels (mean 95.35% sd 2.62%), while
the specificity varied depending on which healthy
subject was used for testing. Subjects H2 and H3 did
not fit the created models well (mean specificity
53.14% sd 14.44%), while subjects H1, H4, H5
responded significantly better (mean specificity
86.55% std 7,55%). Of note, when the above pipeline
was performed with the exclusion of the H2 and H3
subjects, there was a significant drop in the models’
metrics moving from ~95% to ~70%. This indicates
that healthy subjects can be heterogeneous, and
familiarity with games in general could be a reason
behind that. The proposed methods allow for patients
to be clustered into categories reflecting similar hand
movement patterns as a result of similar
neuromuscular disorders/physical trauma.
Performing the above pipeline for all 10
combinations of patient and health training set x 8
movement direction (e.g., right to left) resulted in 80
executions. The 8 best performing models based on
the balanced accuracy metric are depicted on Table 1.
The features finally utilized for the creation of
each model varied based on the selected direction,
and their p values varied also depending on the
selected training dataset. Figure 4 shows the selection
rate of each feature in the model creation. Out of the
28 features examined, 23 appeared at least once with
among the most common being the duration of the
Movement (dt2) and Stabilization (dt3) time periods.
Table 2 depicts the features used for the
development of the best performing model (direction
Top to Bottom, training P2|H1,H2,H3,H5, testing
P1|H4).
Table 2: Mean value for each feature per subject group
(Patients, Healthy). Adjusted p was calculated using the
Mann-Whitney U test.
Feature Mean P Mean H Adjusted p
distanceFromPrevio
usWindow
46.609 33.702 0
distanceFromPrevio
usHand
44.59231 34.55598 0
DT1 544.7925 460.2483 0.0036
DT2 712.3987 261.6593 0
DT2 1942.664 3633.71 0
sdVelDT2 37.42379 17.34871 0
meanVelDT2 50.25814 48.66921 0.004
meanVelDT2Start 41.81328 39.13429 0
meanAccDT2 1350.74 1003.941 0
sdVelDT2X 22.48586 10.47494 0
meanVelDT2X 25.97193 20.89285 0
sdVelDT2Y 30.99457 15.26332 0
sdAccDT2X 21.06343 8.583197 0
Feature Mean P Mean H Adjusted p
meanAccDT2X 23.09528 10.6853 0
sdAccDT2Y 27.11824 13.2992 0
meanAccDT2Y 29.69753 14.80098 0
totalDistance 100.5733 92.49089 0
totalDistanceT2 34.64196 14.41555 0
totalDistanceT3 35.84011 60.09226 0
minDistance 2.077342 1.231234 0
minDistanceCenter 3.828137 2.726778 0.0285
Characterization of Upper Limb Functionality Caused by Neuromuscular Disorders using Novel Motion Features from a Specialized
Gaming Platform
65
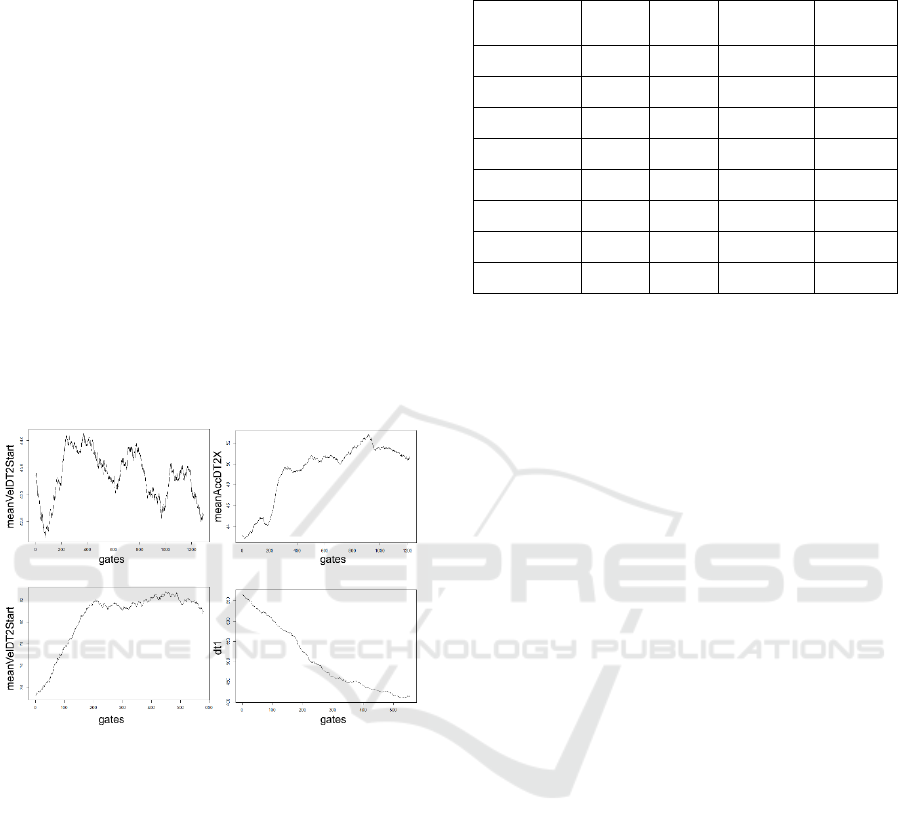
Figure 5. depicts a selection of
subject/feature/direction combinations over the
course of time for the patients during their
physiotherapy. It translates to 9 months for P1 and 6
months for P2. Significant spikes (top left) in certain
features can probably be attributed to the changes in
the difficulty settings in which the games were
played. In all cases, the features that were found to be
statistically significant, tended to improve over time
towards the values that the healthy subjects had
achieved. Some patient’s features show a steady
improvement, at least regarding the data collected
thus far, (bottom right, dt1). On the contrary, other
features seem to reach a plateau over time (bottom left
meanVelDT2Start) but at the same time not reaching
the performance of healthy subjects. Whether this
plateau is unsurmountable and characterizes the
nderlying pathology, or some movement
characteristics require more effort in order to improve
over a certain point (top right), remains to be
investigated.
Figure 5: Features’ trend over time. X-axis depicts the gates
the subject has played in chronological order. Top left
subject:P1| direction: u2d|feature:meanVelDT2Start. Top
right subject:P1| direction: l2r|feature:meanACCDT2X.
Bottom left subject:P2| direction:
l2r|feature:meanVelDT2Start. Bottom right subject:P2|
direction: ud2|feature:DT1.
Table 3 shows the final classifiers’ performance
when used on the external data that was P3. The
classifiers achieved over 90% accuracy in identifying
P3 as patient for 6 out of the 8 directions while the
remaining two where in the high 80%.
Table 3: Results of the final classifiers on the external
dataset (P3).
Movement
type
Total
Gates
Correct
Gates
False Gates Accuracy
u2d 258 243 15 0.94186
l2r 234 215 19 0.91880
r2l 224 200 24 0.89285
d2u 245 230 15 0.93877
diag1 147 137 10 0.93197
diag2 150 137 13 0.91333
diag3 144 136 8 0.94444
diag4 136 119 17 0.875
5 DISCUSSION
The detailed analysis presented in this work is based
on a system that extends the use of Leap sensor for
upper extremity’s functional rehabilitation exploiting
the quite precise detection that is provided.
Although there is distance to cover in the field for
gamification approaches such as ours to reach their
full potential as GaaHS, the presented results are
promising and novel. Specifically, the presented
approach stands out since it attempts to propose and
evaluate quantified metrics regarding not only the in-
game performance but also the hand motion
characteristics which reflect the underlying
pathology.
Looking at the score-based characterisation vs
movement-feature based classification, patients P1
and P2 achieved scores comparable to healthy
subjects, while P3 had significantly lower scores than
all the other subjects. The values of P3’s features
were further away from the healthy subjects than the
rest of the patients. This indicates that a single score
of success or failure in undertaking a task is not
always enough for a successful classification in the
GaaHS scope. On the other hand, the proposed
classifiers using movement features that carry a
higher degree of information, were able to distinguish
between healthy and pathological movement.
One of the challenges that we encountered during
this research was the parametrization of the game
scenario which translates to a varied range of motor
control exercises. The main problem was that
introducing several variables would introduce a high
degree of complexity and decrease the comparability
of the data. Furthermore, a major challenge is the
mapping of the game-specific features to generalized
concepts that are applicable in other scenarios.
BIOSIGNALS 2021 - 14th International Conference on Bio-inspired Systems and Signal Processing
66

Considering the limitations of the study, while the
number of gates is high the number of patients and
healthy subjects is low in terms of variability within
the population. While this can be understood for this
methodological study, a future wider study would be
useful to provide a more concrete evidence and
provide the correlation with the patients’ medical data
and progress as recorded by the physician. In these
next steps, the analysis will take into account the
effect that settings with different difficulty may have
on the result. The familiarization with the specific
game as well as the subject’s general aptitude with
video games, is something that can affect the
subject’s performance, and needs also to be
considered.
Furthermore, while the motion specific classifiers
(horizontal, vertical, diagonal) are useful in terms of
detailed characterization, a unification of the
classifiers will also be helpful in a clinical context,
providing an answer for a subject’s clinical image
regarding hand mobility as a whole and not divided
in specific directions.
6 CONCLUSIONS
This analysis has shown promising results during the
classification process especially as far as the patients
are concerned, the inconsistencies in the performance
of the healthy subjects can be attributed to the
heterogeneity of the healthy population. Additional
data will help in establishing a broader healthy
baseline. In general, the patients were slower in their
reaction time and had a greater distance from the gate
center compared to the healthy subjects.
Regarding future goals, our main objective is the
quantification of patient’s progress and effort will be
placed on matching their progress as indicated by our
features to the commonly used scores regarding upper
limb mobility, such as FMA-UE (Singer and Garcia-
Vega, 2017) and FIM (Hamilton et al., 1994).
Next steps will also involve the level of difficulty
in the analysis and define the optimal settings for
patients that share common characteristics.
Moreover, more complex feature extraction methods
will be explored. Expanding the dataset both in terms
of games and in subjects will facilitate a more robust
statistical analysis and additionally will allow us to
explore the clustering of patients based on their
performance and progress.
ACKNOWLEDGEMENTS
This research has been co-financed by the European
Union and Greek national funds through the
Operational Program Competitiveness,
Entrepreneurship and Innovation, under the call
RESEARCH – CREATE – INNOVATE (project
code:T1EDK-02488)».
REFERENCES
Ang, K. K., and Guan, C. 2013. Brain-computer interface
in stroke rehabilitation. J. Comput. Sci. Eng.
doi:10.5626/JCSE.2013.7.2.139.
B. Alt, F. 2006. “Bonferroni Inequalities and Intervals,” in
Encyclopedia of Statistical Sciences
doi:10.1002/0471667196.ess0163.pub2.
Charles, D., Pedlow, K., McDonough, S., Shek, K., and
Charles, T. 2014. Close range depth sensing cameras
for virtual reality based hand rehabilitation. J. Assist.
Technol. doi:10.1108/JAT-02-2014-0007.
Chen, P. Y., and Popovich, P. M. 2011. “Corellation:
Parametric and Nonparametric Measures,” in
Correlation doi:10.4135/9781412983808.n1.
Chytas, A., Fotopoulos, D., Kilintzis, V., Loizidis, T., and
Chouvarda, I. 2020. Upper limp movement analysis of
patients with neuromuscular disorders using data from
a novel rehabilitation gaming platform. in IFMBE
Proceedings doi:10.1007/978-3-030-31635-8_79.
De Leon, N. I., Bhatt, S. K., and Al-Jumaily, A. 2014.
Augmented reality game based multi-usage
rehabilitation therapist for stroke patients. Int. J. Smart
Sens. Intell. Syst. doi:10.21307/ijssis-2017-693.
Elnaggar, A., and Reichardt, D. 2017. Digitizing the hand
rehabilitation using serious games methodology with
user-centered design approach. in Proceedings - 2016
International Conference on Computational Science
and Computational Intelligence, CSCI 2016
doi:10.1109/CSCI.2016.0011.
Elzanie, A., and Varacallo, M. 2018. Anatomy, Shoulder
and Upper Limb, Deltoid Muscle.
Hamilton, B. B., Laughlin, J. A., Fiedler, R. C., and
Granger, C. V. 1994. Interrater reliability of the 7-level
Functional Independence Measure (FIM). Scand. J.
Rehabil. Med.
Henderson, A., Korner-Bitensky, N., and Levin, M. 2007.
Virtual reality in stroke rehabilitation: A systematic
review of its effectiveness for upper limb motor
recovery. Top. Stroke Rehabil. doi:10.1310/tsr1402-52.
Kalchbrenner, N., Grefenstette, E., and Blunsom, P. 2014.
A convolutional neural network for modelling
sentences. in 52nd Annual Meeting of the Association
for Computational Linguistics, ACL 2014 -
Proceedings of the Conference doi:10.3115/v1/p14-
1062.
Characterization of Upper Limb Functionality Caused by Neuromuscular Disorders using Novel Motion Features from a Specialized
Gaming Platform
67

Kruskal, W. H., and Wallis, W. A. 1952. Use of Ranks in
One-Criterion Variance Analysis. J. Am. Stat. Assoc.
doi:10.2307/2280779.
Meijer, H. A., Graafland, M., Goslings, J. C., and Schijven,
M. P. 2018. Systematic Review on the Effects of
Serious Games and Wearable Technology Used in
Rehabilitation of Patients With Traumatic Bone and
Soft Tissue Injuries. Arch. Phys. Med. Rehabil.
doi:10.1016/j.apmr.2017.10.018.
Oña, E. D., Balaguer, C., Cano-De La Cuerda, R., Collado-
Vázquez, S., and Jardón, A. 2018. Effectiveness of
serious games for leap motion on the functionality of
the upper limb in Parkinson’s disease: A feasibility
study. Comput. Intell. Neurosci.
doi:10.1155/2018/7148427.
Sardi, L., Idri, A., and Fernández-Alemán, J. L. 2017. A
systematic review of gamification in e-Health. J.
Biomed. Inform. doi:10.1016/j.jbi.2017.05.011.
Shapiro, and Wilk, M. B. 2015. The Shapiro-Wilk And
Related Tests For Normality. Statistics (Ber).
Singer, B., and Garcia-Vega, J. 2017. The Fugl-Meyer
Upper Extremity Scale. J. Physiother.
doi:10.1016/j.jphys.2016.08.010.
Smeddinck, J. D., Herrlich, M., and Malaka, R. 2015.
Exergames for physiotherapy and rehabilitation: A
Medium-term situated study of motivational aspects
and impact on functional reach. in Conference on
Human Factors in Computing Systems - Proceedings
doi:10.1145/2702123.2702598.
Tamayo-Serrano, P., Garbaya, S., and Blazevic, P. (2018).
Gamified In-Home Rehabilitation for Stroke Survivors:
Analytical Review. Int. J. Serious Games.
doi:10.17083/ijsg.v5i1.224.
Tang, H. K., Feng, Z. Q., Xu, T., and Yang, X. H. 2017. VR
system for active hand rehabilitation training. in ICCSS
2017 - 2017 International Conference on Information,
Cybernetics, and Computational Social Systems
doi:10.1109/ICCSS.2017.8091432.
Veerbeek, J., Langbroek-Amersfoort, A., van Wegen, E. E.,
Meskers, C. G., and Kwakkel, G. 2017. Effects of
Robot-Assisted Therapy for the Upper Limb After
Stroke: A Systematic Review and Meta-analysis.
Neurorehabil. Neural Repair.
BIOSIGNALS 2021 - 14th International Conference on Bio-inspired Systems and Signal Processing
68
