
Early Defect Detection in Conveyor Belts using Machine Vision
Guilherme G. Netto
1,3 a
, Bruno N. Coelho
1,3 b
, Saul E. Delabrida
2 c
, Amilton Sinatora
3 d
,
H
´
ector Azp
´
urua
3 e
, Gustavo Pessin
3 f
, Ricardo A. R. Oliveira
2 g
and Andrea G. C. Bianchi
2 h
1
Department of Engineering of Control and Automation, School of Mines, Federal University of Ouro Preto (UFOP),
122 Diogo de Vasconcelos, Ouro Preto, MG, 35400-000, Brazil
2
Computing Department, Federal University of Ouro Preto (UFOP),
122 Diogo de Vasconcelos, Ouro Preto, MG, 35400-000, Brazil
3
Vale Institute of Technology (ITV), 31 Juscelino Kubitschek, Ouro Preto, MG, 35400-000, Brazil
Keywords:
Image and Signal Processing, Curvature Outlier, Defects Detection, Machine Vision Inspection, Maintenance.
Abstract:
Continuous belt monitoring is of utmost importance since wears on its surface can develop into tears and
even rupture. It can causes the interruption of the conveyor, and consequently, loss of capital, or even worse,
serious or fatal accidents. This paper proposes a laser-based machine vision method for detecting defects in
conveyor belts to solve the monitoring problem. The approach transforms an image of a laser line into a one-
dimensional signal, then analyzes it to detect defects, considering that variations in this signal are caused by
defects/imperfections on the belt surface. Differently from previous works, the proposed method can identify
a defect through a 2D reconstruction of it. The results reveal that the proposed method was capable to detect
superficial imperfections in simulated conveyor belt experiments, achieving high values in metrics such as
precision and recall.
1 INTRODUCTION
Conveyor belt has been developed and used for
decades as an essential part of transportation pro-
cesses (Pang and Lodewijks, 2005), it can be cited
as the most cost-effective equipment for the contin-
uous transport of large amounts of material due to
their high efficiency, large capacity, relatively simple
construction, and less maintenance required (Fedorko
et al., 2014; fu Hou and rui Meng, 2008). A problem
found in traditional monitoring systems for conveyor
belt is operator dependence. At the same time, rollers
and pulleys can only be monitored while they are run-
ning. On the other hand, conveyor belts can only be
observed when they are not in operation. Also, it is
often difficult to define whether a malfunction was
caused by the conveyor’s operation or by the act of
a
https://orcid.org/0000-0001-7255-5708
b
https://orcid.org/0000-0002-2809-7778
c
https://orcid.org/0000-0002-8961-5313
d
https://orcid.org/0000-0002-5004-4947
e
https://orcid.org/0000-0002-4182-2540
f
https://orcid.org/0000-0002-7411-9229
g
https://orcid.org/0000-0001-5167-1523
h
https://orcid.org/0000-0001-7949-1188
taking the sample when there is a need for a destruc-
tive test on the belt (Fedorko et al., 2018).
Conveyor belts are prone to failures, such as: wear
on the surface, degradation due to weathering, dam-
age to the ends and longitudinal and perpendicular
tears in sections of the belt, misalignment of the belt
during operation, overheating of the rollers, among
others, causing production risk (Yang et al., 2014).
Failures in such equipment systems generally result
in a production stoppage for repair, or in more serious
cases, as accidents with workers, resulting in serious
consequences to the company.
Traditional defect techniques and instruments usu-
ally require physical contact with parts of the con-
veyor to identify faults, or worst, just identify faults
only when they occur, like a tear that crosses the
thickness of the belt, causing material leaking. An ex-
ample is a mechanical sensor as a misalignment sen-
sors, which are composed of position switches that
trigger an alarm when in contact with the misaligned
belt. Depending on the severity of the misalignment,
stop the conveyor operation.
There are some sophisticated techniques for mon-
itoring conveyor belt components such as systems
based in RFID sensors (Pang and Lodewijks, 2006),
magnetic sensors (Nicolay et al., 2004), X-rays sen-
Netto, G., Coelho, B., Delabrida, S., Sinatora, A., Azpúrua, H., Pessin, G., Oliveira, R. and Bianchi, A.
Early Defect Detection in Conveyor Belts using Machine Vision.
DOI: 10.5220/0010240803030310
In Proceedings of the 16th International Joint Conference on Computer Vision, Imaging and Computer Graphics Theory and Applications (VISIGRAPP 2021) - Volume 4: VISAPP, pages
303-310
ISBN: 978-989-758-488-6
Copyright
c
2021 by SCITEPRESS – Science and Technology Publications, Lda. All rights reserved
303

sors (Yang et al., 2016) among others. It is notable
that these monitoring methods, even though some
have a better monitoring capacity than standard meth-
ods, need a special construction, with sensors inside
the belt, or unusual equipment used in industrial ar-
eas, such as an X-ray emitter. Thus, image analysis
using computer vision has been a strong candidate for
this kind of approach.
This paper aims to present an automatic method
based on computer vision, clustering and statistical
basic techniques capable of detecting and describe
defects in the conveyor belt, as well as rebuild a
2D shape of those identified defects. The proposed
method can identify tears, bubbles, and wear on the
belt surface. Instead of using regular laser belt sur-
face scanning, this approach uses curvature outlier
values of a one-dimensional signal extracted from a
laser line’s image to represent defects through the belt
surface. The major contributions of this work are as
follows: a new machine vision approach to detect a
defect in conveyor belts using a camera and a laser,
interpretability with a 2D shape of those identified de-
fects and recognition of various types of defects, such
as bubble, wear and rips.
This paper is organized as follows: Section 2 dis-
cusses the techniques used in the literature to deal
with the same problem. Section 3 introduces the pro-
posed materials and method. Section 4 presents a
short explanation of the database and method evalua-
tion. Section 5 presents the experiments and obtained
results. Then, the conclusions and future works are
exposed in Section 6.
2 RELATED WORKS
Sophisticated and intelligent techniques that monitor
the belt conveyor’s status have already been devel-
oped. (Nicolay et al., 2004) proposed a system that
made use of RFID using tags spread over the entire
length of the belt, making it or a very long time large
between readings or the lack of a tag would trigger the
tearing alarm on the belt. (Pang and Lodewijks, 2006)
proposed using magnets inside the belt and using an
external sensor, making it determine the belt condi-
tions such as: operating speed, wear, among others.
(Guan et al., 2008) proposed the use of X-rays in con-
junction with a receiver so that by observing the atten-
uation of the signal received by the receiver, the sys-
tem was able to identify ruptures in the steel webs of
the belts. Considering the overheating, (Nascimento
et al., 2017) proposed using computer vision in an
unmanned aerial vehicle (UAV) for the inspection of
rollers through the image of a thermal camera.
(Fromme et al., 2006) proposed a system capable
of detecting defects in sections of the belt using data
from at least one camera, using a encoder to adjust the
camera frames. (Kurihara et al., 2006) developed an
apparatus using a camera and laser to detect tears in
conveyor belts by spacing the laser beam in the case
of a tear in the belt.
(Li et al., 2011) proposed an intelligent method
using characteristics of the binary image of the belt
(such as shape, position and size of the identified
objects) together with ANDs and ORs to determine
whether or not the belt has tears. (Peng, 2013) pro-
posed using the MDNMS algorithm to identify tears
in grayscale images of conveyor belts and developing
a method of automatic false positive detection using
the classifier AdaBoost.
(Yang et al., 2014) developed an apparatus using
a camera focused on a brightly lit area, providing a
system capable of identifying tears and misalignment
in conveyor belts. (Li and Miao, 2016) proposed us-
ing the SSR algorithm to identify slots present in con-
veyor belts through characteristics of the resulting bi-
nary image, such as boundary areas of rectangles of
the identified objects, among others
(Yang et al., 2016) proposed to transform the two-
dimensional signal obtained by the camera into a one-
dimensional vector, and from there, detect the tears
in conveyor belts through the difference between the
intensities obtained by the one-dimensional vector.
(Qiao et al., 2016) proposed using two cameras (in-
frared and CCD) and a laser beam emitted on the belt,
detecting tears through the discontinuity of the laser
by the CCD, and the histogram obtained by an in-
frared camera. (Qiao et al., 2017) used a camera in
conjunction with a laser beam emitted on the belt sur-
face to detect tears in conveyor belts, using edge de-
tection and Hough transform.
Although the aforementioned works can identify
defects such as longitudinal tears in conveyor belts,
there are still few, if any, that can inform any other
information or details about other types of defects,
such as surface erosion, for example. To inform more
about different types of defects detected, such as bub-
bles and surface erosion, the present work proposes
to use a camera focused on a section of the belt where
a laser beam is used perpendicular to the direction of
movement of the belt, assuming that defects present in
the belt profile cause deformations in the shape of the
laser captured by the camera, and, capturing these de-
formations, identify and reconstruct the shape of these
defects.
VISAPP 2021 - 16th International Conference on Computer Vision Theory and Applications
304
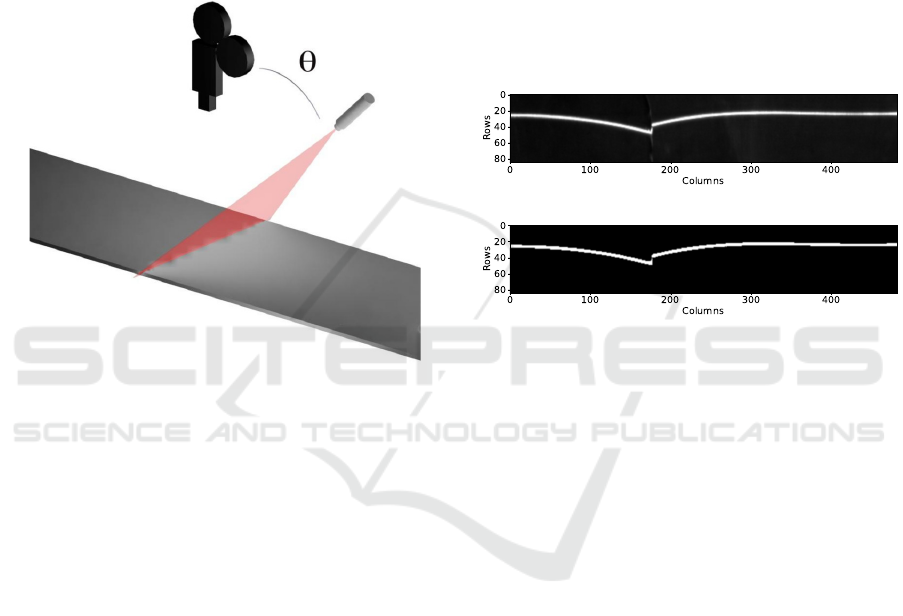
3 MATERIALS AND METHODS
To identify defects covering belt surfaces, the exper-
imental set up used a camera and a laser line out
of phase and positioned below the lower belt. A
schematic representation is shown in Figure 1. The
hypothesis assumes that with this configuration, a
laser line on the belt surface can emphasize irregu-
larities present on it, even if not visible to the naked
eye. When combined with automatic computer vision
techniques, it can automatically detect defects.
Figure 1: Schematic representation of the experimental
setup for image acquisition.
The first step is image acquisition and laser seg-
mentation as an object of interest. Then, the object is
transformed into a one-dimensional signal, and its 1D
curvature is calculated. The statistical analysis iden-
tifies outlier points of curvature, assuming that such
points are caused by irregularities on the belt surface,
and consequently in the one-dimensional signal. The
discrepant points are grouped using an unsupervised
algorithm, and a bounding box is drawn around them,
a 2D defect representation, the identification itself.
The following sections present the description of the
proposed method in detail.
3.1 Laser Segmentation
In this work, the more we save time processing, the
better. So, we proposed to simulate a system that
could use a monochromatic digital camera with a
specter filter. Since we proposed to use a laser, the
filter must be at the same specter frequency of the
chosen laser. This way, we could achieve the same
result of an RGB-Gray color transformation without
any computational cost. The result is shown in Fig-
ure 2a, a grayscale image with high intensity was the
laser is present and low intensity in the remainder of
the image.
Bilateral Filter (Elad, 2002), a non-linear filter ca-
pable of reducing noises without loss of image infor-
mation was used. The filtering result is a smooth im-
age without most of the acquired noises, keeping the
format of the laser. The bilateral filter has two pa-
rameters: spatial (σ) and range (r). The spatial pa-
rameter is proportional to the size of the image, and
the range parameter is proportional to the amplitude
of the edges. After the non-linear smoothing, Otsu’s
Method (Otsu, 1979) was used to binarize the image,
since it has an excellent performance in bimodal im-
ages. The result is an image with 0s representing fore-
ground and 1s for laser line, as shown in Figure 2b.
(a) R-channel of the RGB image
(b) Resulting binary image after preprocessing
Figure 2: Gray and preprocessed image, respectively.
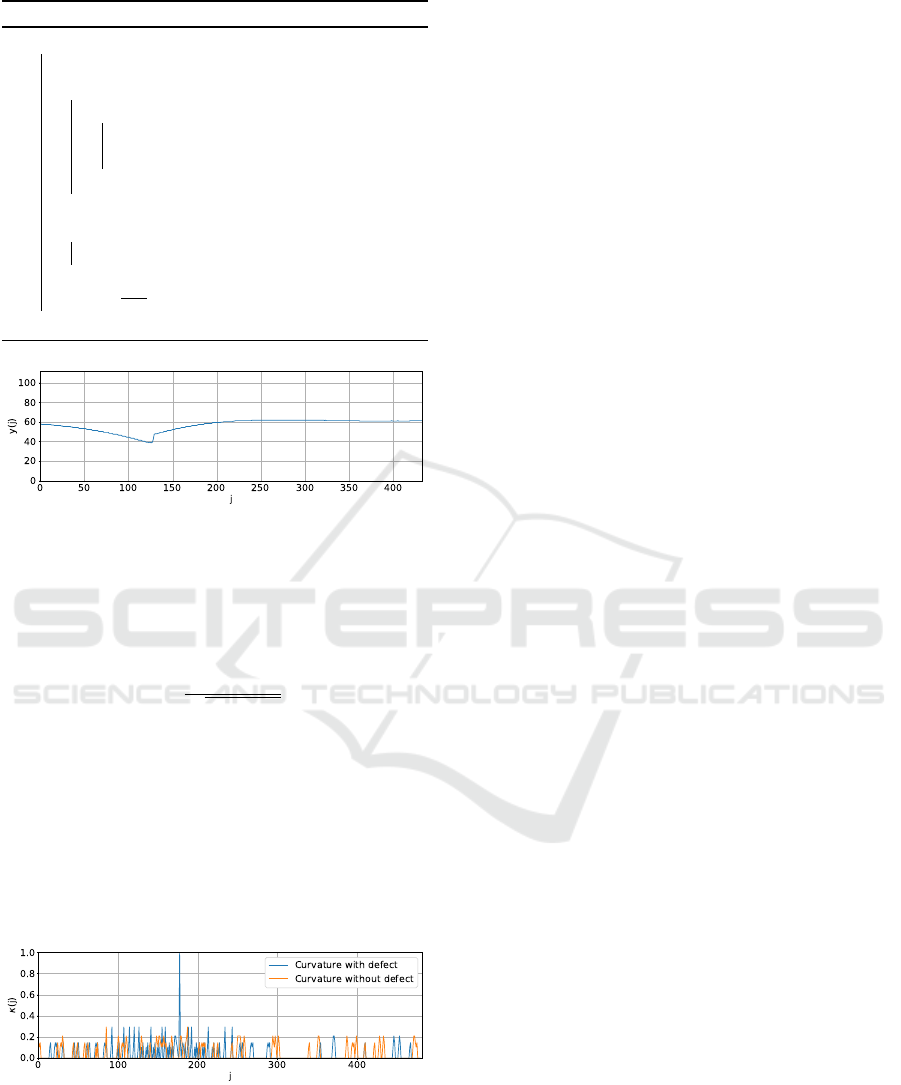
3.2 One-dimensional Signal
Transformation
Due to the laser’s width, the segmented line has a
width as well. Furthermore, as an image is usually
toughest to process than a one-dimensional signal, we
propose to transform it in a one-dimensional signal
named y.
Consider the image denoted by I(i, j), of size M ×
N, where i and j represents the rows and columns of
the image, respectively, being i = 1 to M, and j =
1 to N. The one-dimensional transformation occurs
assigning to each column j of the image I the mean
value of all the indices i of each row when I(i, j) =
1. Algorithm 3.1 presents the pseudo-code for one-
dimensional transformation y( j) with j varying from
1 to N, i.e., image width now representing the length
of transformed signal. Figure 3 shows the result of the
one-dimensional transformation of the binary image
of Figure 2b in a signal y with size N.
3.3 Curvature Calculation
It is well accepted that curvature provides an essen-
tial representation of salient shape points, as well as
Early Defect Detection in Conveyor Belts using Machine Vision
305
Algorithm 3.1: One-dimensional transformation.
1 for j = 1 → N do
2 m ← 0; cont ← 0;
3 for i = 1 → M do
4 if I(i, j) 6= 0 then
5 m ← m + i;
6 cont ← cont + 1;
7 end
8 end
9 if cont = 0 then
10 cont ← 1;
11 end
12 y( j) =
m
cont
;
13 end
Figure 3: One-dimensional signal.
invariant to rigid-body transformations (Estrozi et al.,
2003). Once the one-dimensional signal y was ob-
tained, a numerical curvature κ of it was calculated
through Equation 1
κ =
|y
00
|
p
(1 + y
02
)
3
(1)
where y
0
is the first and y
00
the second derivatives of
one-dimensional signal. The complete description of
numeric curvature calculation is explained in (Xian-
guo et al., 2018) and (Junior and Costa, 1996).
Figure 4 presents the curvatures κ as function of
length of one-dimensional signal y for two different
image frames (belt position), where the blue curve
represents the calculated curvature in a region with
defect and red without one.
Figure 4: Curvature of the section with (blue) and without
(orange) defect.
As shown in Figure 4, both curvatures are very
similar, except in the location of the defect, region of
the curvature peak in the blue curve. Consequently,
the main hypothesis is that outlier curvature values
may represent defects at the belt surface.
A closer look at Figure 4 shows that in the regions
close to the defect, the curvature values are higher, or
an outlier in that exact frame, whereas in the remain-
ing part of the signal, the curvature is relatively simi-
lar. We did not use a static threshold value because it
is difficult to choose a curvature value for a belt sur-
face representing a defect on it since the same belt
may have different surfaces: straight in a location and
noisier in another one. Therefore, a curvature point
representing a defect in the straight section of the belt
may not represent in the noisily. Thus we propose
to use outlier curvature points as a descriptor of the
defects. In other words, the outlier will represent a
curvature value that diverges from an overall pattern
on a sample.
In data processing, there are many techniques for
outlier detection. In this work, four known statistical
techniques were used: Z-Score (Hodge and Austin,
2004), Chauvenet Criterion (Lin and Sherman, 2007),
Median Absolute Deviation (MAD) (Leys et al.,
2013) and Interquartile Range (IQR) (Jeong et al.,
2017). The first two use concepts of mean and stan-
dard deviation, whereas the last two use quantile con-
cepts. As every technique has particularities, to use
all of them was proposed, and accept an outlier detec-
tion only if three of them detect the same point. The
detection becomes more robust to noises, as at least
one of the two concepts (mean+standard deviation or
quantile) can detect the same outliers. Moreover, in
data processing, usually, the outliers are removed or
replaced in the data. However, in this work, we iden-
tify these outliers’ index and assign these points as
defects.
3.4 Defect Detection
Many frames with defect information in the laser line
will be captured depending on the velocity of the con-
veyor and the size and shape of the defect, so many
outlier curvature points can be recognized. These
points are allocated into a defect matrix, with the
same dimensions rows×columns of the image, in the
correspondent column j that they were found in the
signal, but updating the row value in every frame ac-
cording to the velocity of the conveyor. After the laser
passes through a complete defect, the points identified
has an approximate shape of the defect, which was de-
fined as the 2D reconstruction of the defect.
The Density-Based Spatial Clustering of Applica-
tions with Noise (DBSCAN) algorithm (Ester et al.,
1996), which has the capacity of clustering data ac-
cording to the density of points in a spatial location,
makes the defect detection itself. The algorithm ana-
VISAPP 2021 - 16th International Conference on Computer Vision Theory and Applications
306
lyzes the defect matrix, grouping the nearby points as
a single defect. As DBSCAN is an unsupervised ma-
chine learning clustering algorithm, it does not need
previous training. Also, as it groups points locally, it
does not need to know the number of clusters inside
the data. Therefore, it makes the defects detection
possible, even not knowing the shapes or number of
defects present in the belt surface.
4 DEFECTS DATABASE AND
METHOD EVALUATION
The core of this work is to propose a method that
even with low-cost techniques, should be possible to
achieve a good result detecting defects in conveyor
belts, so before the implementation of the solution on
real conveyor belts, we tested our hypotheses on sim-
ulated images. The images samples were illuminated
by laser, according to the scheme presented in Fig-
ure 1. The database were constructed to simulates the
movement of a conveyor belt with defects illuminated
by a laser and filmed by a camera, where videos sim-
ulating the laser, and the movement of the conveyor
were recorded.
4.1 Synthetic Database
The synthetic database was developed using 3D
Studio Max
R
software. The environment was
simulated using a virtual conveyor belt with
4500mm×900mm×20mm. A video simulating the
movement of the conveyor was built with 30 seconds
of duration and 30 frames per second. To investigate
the configurations between camera and laser, many
simulations with the same video characteristics were
built, as duration and frame rate, but changing the po-
sitions of the laser and the camera. The laser was
lagged in 30
◦
, 45
◦
, and 60
◦
degrees of the camera,
whereas the camera was positioned perpendicular to
the belt. Also, the reverse of these configurations was
used as well.
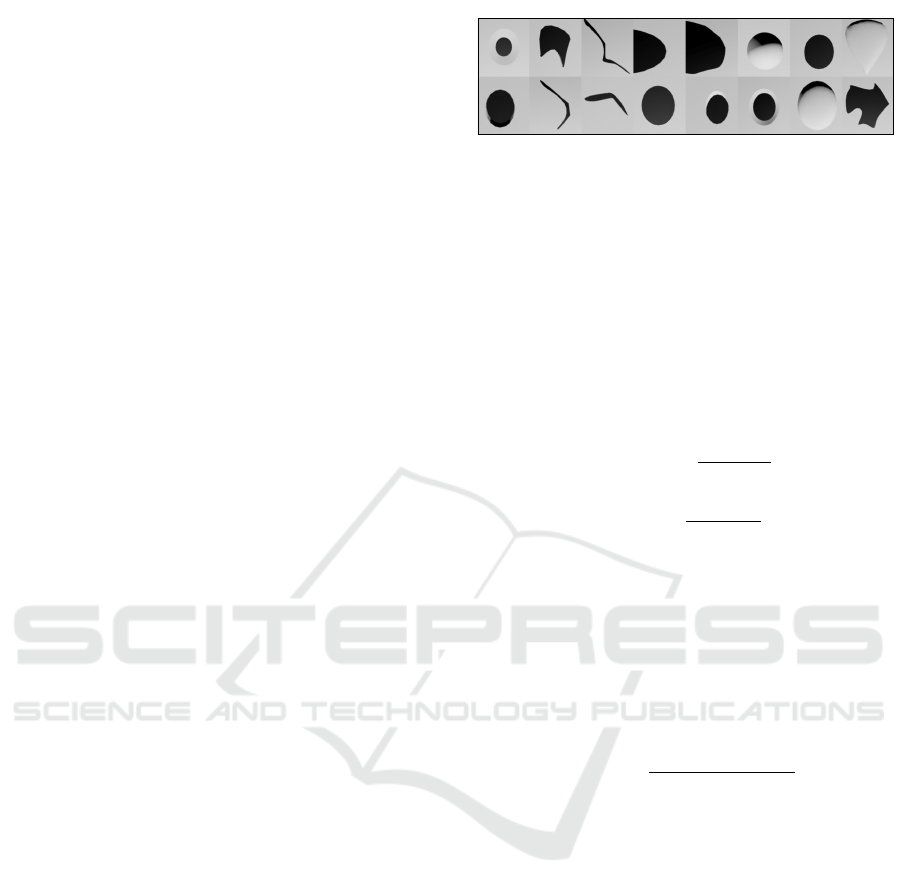
To simulate defects, some irregularities (visible
and invisible with the naked eye) of many shapes and
sizes were inserted randomly in the simulated belt im-
age. The regions with the irregularities are shown in
Figure 5. These irregularities intend to describe real
defects such as rips, erosion, tears, wears, among oth-
ers.
4.2 Performance Evaluation
Considering the proposed method for defect detec-
tion, its evaluation is based on three known pattern
Figure 5: Examples of different irregularities proposed in
the simulation.
recognition metrics: Precision, Recall, and F1 Score.
These metrics measure how good the method’s detec-
tion was compared with the ground truth of the syn-
thetic database. Precision and recall are metrics use-
ful for measure relevance (Perruchet and Peereman,
2004), since they show the amount of data obtained
that are relevant (precision), and the amount of rel-
evant data obtained (recall). The Equations 2 and 3
describe precision and recall, respectively
Precision =
T P
T P + FP
(2)
Recall =
T P
T P + FN
(3)
where TP is the true positive, corresponding to defects
that were correctly detected, FP, the false positive, a
defect that was detected incorrectly, and FN, the false
negative, indicating no detection when it does.
Using precision and recall, we can calculate the F1
Score (Sasaki et al., 2007), which represents the bal-
ance between the two metrics, and can be described
by Equation 4.
F1 = 2 ∗
Precision ∗ Recall
Precision + Recall
(4)
5 EXPERIMENTS AND RESULTS
The proposed method was developed in Python pro-
gramming language, running Ubuntu 16.04 64 bits as
operational system. All experiments were performed
on a DELL Inspiron 15 7559, Intel
R
Core
TM
i7 −
6700HQ processor with a 2.60Hz × 8, SSD 120Gb,
16Gb RAM.
Tests to obtain the best configuration between
laser and camera were performed comparing the re-
sults obtained by the method with the ground truth.
Table 1 presents the mean values of precision, recall,
and F1 achieved by every configuration between cam-
era and laser. The best configuration was obtained
with the camera and laser lagged by an angle of 30
◦
(camera perpendicular to the belt).
Using the best configuration, the experiment used
the synthetic database presented in Section 4 to obtain
Early Defect Detection in Conveyor Belts using Machine Vision
307
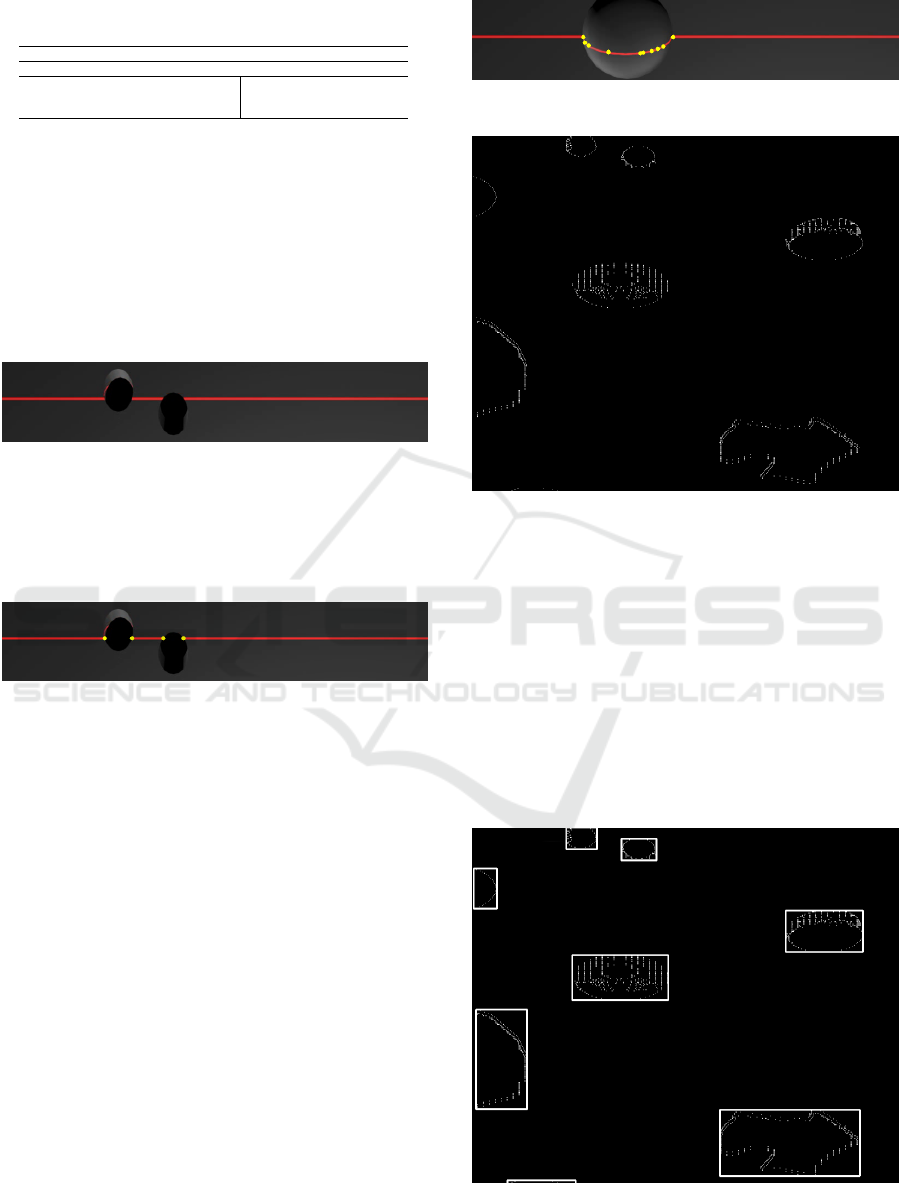
Table 1: Mean results of precision, recall and F1 for defects
detection in every configuration.
Laser 90
◦
Camera 90
◦
Angle Precision Recall F1 Precision Recall F1
30
◦
0.88 0.91 0.89 0.92 0.94 0.93
45
◦
0.87 0.89 0.88 0.90 0.93 0.91
60
◦
0.86 0.90 0.88 0.89 0.92 0.90
detection results of defects. The shape, size, and an-
gle of the defects influence how the camera will cap-
ture the laser. Figure 6 shows an instant of time t with
the laser on two imperfections that exceed the depth
of the belt in the simulation, with a lagged entry an-
gle (oblique and acute, depending on the position of
the observer/camera) to the belt plane. The laser has
a discontinuous shape due to the hole, and its visu-
alization is only possible while it is reflected on the
belt.
Figure 6: Simulation in time t.
Figure 7 presents the result of detecting the points
of high curvature using the statistical analysis to de-
tect outliers. The yellow dots in the image represent
the algorithm’s identification.
Figure 7: Outlier detection in simulation database.
As previously stated, detecting defects that cross
the entire belt profile would be the best case for the
proposed method. However, this would clearly be
the worst case in a real environment, as it would be
a serious defect in the belt. However, even in superfi-
cial defects, the algorithm could also detect the defect
points, as shown in Figure 8.
The yellow dots describe imperfections on the belt
surface due to their high curvature value. These points
are allocated in a defect matrix after each frame. Af-
ter the laser’s complete passage over any defect, this
matrix will have several points capable of describing
the 2D format of that defect presented in the belt. To
identify these points as a grouping of points (cluster)
describing only one defect at a time, the DBSCAN al-
gorithm was used. Figure 9 shows the defect matrix
after the laser has passed through several defects of
the simulated database.
Figure 10 shows the clustering result using DB-
SCAN algorithm in the defect matrix. It can be seen
that it could group the defects separately, different
bounding boxes, even though the number of defects
Figure 8: Outlier detection on a superficial defect.
Figure 9: Defect matrix.
present in the matrix has not been entered. Also, we
can check the interpretable shape inside the identified
bounding box. The algorithm input was a vector com-
posed of the indices (row × column) of the defect
matrix points. However, such input data comprises
large and integer values, since they represented pixel
indices in an image. Therefore, they have been nor-
malized for better tuning of the algorithm parameters.
However, as the DBSCAN default parameters have
already managed to identify each defect separately,
these parameters were then used, which are r = 0.1
and n = 10.
Figure 10: DBSCAN cluster in defect matrix.
VISAPP 2021 - 16th International Conference on Computer Vision Theory and Applications
308

Table 2 presents the results of all defect detec-
tion in the simulation. The mean precision was 92%,
which indicates that the proposed method could cap-
ture a high ratio of relevant information for each de-
fect (ratio between TP and FP). The mean recall was
94%, and the mean F1 Score was 91%, indicating
that the method has a high rate of discrimination.
Furthermore, literature shows that good values or a
true detection for F1 are values above 70% (Radau
et al., 2009), and for precision and recall, above 60%
(Genc¸Tav et al., 2012). Thus, we can observe that the
method obtained 100% of detection in the simulated
environment with these values.
Table 2: Results of defect detection using the proposed
technique.
Defect Precision Recall F1
1 0.97 0.91 0.94
2 0.97 0.94 0.96
3 0.86 0.98 0.92
4 0.92 1.00 0.96
5 0.80 0.80 0.80
6 0.93 0.89 0.91
7 0.93 0.97 0.95
8 0.76 0.93 0.84
9 0.92 0.93 0.92
10 0.99 0.89 0.94
11 0.93 0.99 0.96
12 0.90 0.92 0.94
13 0.99 0.98 0.95
14 0.86 0.98 0.92
15 0.98 0.98 0.98
16 0.97 0.95 0.96
mean 0.92 0.94 0.93
6 CONCLUSIONS
The present work proposed a machine vision method
for detecting defects in conveyor belts. A synthetic
database investigated the best configuration between
camera, laser, and belt, as well as the method’s detec-
tion capacity.
The proposed method achieved a good result in
the synthetic environment with a mean precision of
92%, mean recall 94%, and mean F1 score of 93%,
indicating that the method has a good performance
for the identification of target defects.
The performance shows that it has, in fact, the
potential for identifying defects in the real environ-
ment of the industry. Moreover, the contribution of
the method to the industry is great since the proposal
is a remote interpretable monitoring system capable
of presenting defects to the maintenance team with-
out the necessity of an operator present at the location
of the conveyor, an environment extremely dangerous
and conducive to accidents, providing a safe and non-
invasive way of monitoring. Also, with the camera
calibration, it would be possible to perform a classifi-
cation only looking at the size of defects, easy defin-
ing a threshold to it.
Future work is intended to assemble the equip-
ment in a real operating situation of a conveyor belt
to construct a database with a more significant num-
ber and variability of real defects. This new database
will allow an exhaustive investigation in real situa-
tions and critical parameters for detection. All these
improvements would be valuable, and once the de-
fect is detected, we can develop models capable of
recognizing the type of defect, and even learn how
defect evolves. Machine learning techniques may be
included in the investigation of the evolution of the
defects in such a way as to allow the construction of
predictive models that aid in maintenance.
ACKNOWLEDGEMENTS
This study was financed in part by the Coordenac¸
˜
ao
de Aperfeic¸oamento de Pessoal de N
´
ıvel Superior
- Brasil (CAPES) - Finance Code 001, the Con-
selho Nacional de Desenvolvimento Cient
´
ıfico e Tec-
nol
´
ogico (CNPQ), the Fundac¸
˜
ao de apoio a pesquisa
do estado de Minas Gerais (FAPEMIG) (FAPEMIG-
APQ-01331-18), the Instituto Tecnol
´
ogico Vale (ITV)
and Vale S.A. (No.23109.005575/2016-81 and No.
23109.005909/2018-89) and the Federal University of
Ouro Preto (UFOP) (No. 23109.003515/2018-96 and
No.23109.000928/2020-33).
REFERENCES
Elad, M. (2002). On the origin of the bilateral filter and
ways to improve it. IEEE Transactions on image pro-
cessing, 11(10):1141–1151.
Ester, M., Kriegel, H.-P., Sander, J., Xu, X., et al. (1996).
A density-based algorithm for discovering clusters in
large spatial databases with noise. In Kdd, volume 96,
pages 226–231.
Estrozi, L. F., Rios-Filho, L. G., Bianchi, A. G. C., Ce-
sar Jr, R. M., and da Fontoura Costa, L. (2003). 1d
and 2d fourier-based approaches to numeric curvature
estimation and their comparative performance assess-
ment. Digital signal processing, 13(1):172–197.
Fedorko, G., Moln
´
ar, V., Dovica, M., T
´
oth, T., Fabianov
´
a,
J., Strohmandl, J., Neradilov
´
a, H., Heged
¨
u
ˇ
s, M., and
Belu
ˇ
sko, M. (2018). Analysis of defects in carcass of
rubber–textile conveyor belts using metrotomography.
Journal of Industrial Textiles, 47(7):1812–1829.
Fedorko, G., Molnar, V., Marasova, D., Grincova, A.,
Dovica, M., Zivcak, J., Toth, T., and Husakova, N.
(2014). Failure analysis of belt conveyor damage
caused by the falling material. part i: Experimental
measurements and regression models. Engineering
failure analysis, 36:30–38.
Early Defect Detection in Conveyor Belts using Machine Vision
309

Fromme, C., Stager, D., Pilarski, T., Bancroft, B., and
Hegadorn, T. (2006). Conveyor belt inspection sys-
tem and method. US Patent 6,988,610.
fu Hou, Y. and rui Meng, Q. (2008). Dynamic characteris-
tics of conveyor belts. Journal of China University of
Mining and Technology, 18(4):629 – 633.
Genc¸Tav, A., Aksoy, S., and
¨
ONder, S. (2012). Unsuper-
vised segmentation and classification of cervical cell
images. Pattern recognition, 45(12):4151–4168.
Guan, Y., Zhang, J., Shang, Y., Wu, M., and Liu, X.
(2008). Embedded sensor of forecast conveyer belt
breaks. In Fuzzy Systems and Knowledge Discovery,
2008. FSKD’08. Fifth International Conference on,
volume 5, pages 617–621. IEEE.
Hodge, V. and Austin, J. (2004). A survey of outlier de-
tection methodologies. Artificial intelligence review,
22(2):85–126.
Jeong, J., Park, E., Han, W. S., Kim, K., Choung, S., and
Chung, I. M. (2017). Identifying outliers of non-
gaussian groundwater state data based on ensemble
estimation for long-term trends. Journal of Hydrol-
ogy, 548(Supplement C):135 – 144.
Junior, R. M. C. and Costa, L. D. F. (1996). Towards effec-
tive planar shape representation with multiscale digi-
tal curvature analysis based on signal processing tech-
niques. Pattern Recognition, 29(9):1559–1569.
Kurihara, T., Okuda, K., and Yoshimoto, M. (2006). Longi-
tudinal rip detection method and device for conveyor
belt. Japan Patent 6,282,319.
Leys, C., Ley, C., Klein, O., Bernard, P., and Licata, L.
(2013). Detecting outliers: Do not use standard devi-
ation around the mean, use absolute deviation around
the median. Journal of Experimental Social Psychol-
ogy, 49(4):764–766.
Li, J. and Miao, C. (2016). The conveyor belt longitudi-
nal tear on-line detection based on improved ssr al-
gorithm. Optik-International Journal for Light and
Electron Optics, 127(19):8002–8010.
Li, M., Du, B., Zhu, M., and Zhao, K. (2011). Intelligent de-
tection system for mine belt tearing based on machine
vision. In Control and Decision Conference (CCDC),
2011 Chinese, pages 1250–1253. IEEE.
Lin, L. and Sherman, P. D. (2007). Cleaning data the chau-
venet way. The Proceedings of the SouthEast SAS
Users Group, SESUG Proceedings, Paper SA11.
Nascimento, R., Carvalho, R., Delabrida, S., Bianchi, A. G.,
Oliveira, R. A. R., and Garcia, L. G. U. (2017). An in-
tegrated inspection system for belt conveyor rollers. In
19th International Conference on Enterprise Informa-
tion Systems (ICEIS 2017), volume 2, pages 190–200.
Nicolay, T., Treib, A., and Blum, A. (2004). Rf identifi-
cation in the use of belt rip detection [mining product
belt haulage]. In Sensors, 2004. Proceedings of IEEE,
pages 333–336. IEEE.
Otsu, N. (1979). A threshold selection method from gray-
level histograms. IEEE transactions on systems, man,
and cybernetics, 9(1):62–66.
Pang, Y. and Lodewijks, G. (2005). Large-scale conveyor
belt system maintenance decision-making by using
fuzzy causal modeling. In Intelligent Transportation
Systems, 2005. Proceedings. 2005 IEEE, pages 563–
567. IEEE.
Pang, Y. and Lodewijks, G. (2006). A novel embedded con-
ductive detection system for intelligent conveyor belt
monitoring. In Service Operations and Logistics, and
Informatics, 2006. SOLI’06. IEEE International Con-
ference on, pages 803–808. IEEE.
Peng, X. (2013). A novel image-based method for conveyor
belt rip detection. In Signal Processing, Communica-
tion and Computing (ICSPCC), 2013 IEEE Interna-
tional Conference on, pages 1–4. IEEE.
Perruchet, P. and Peereman, R. (2004). The exploitation
of distributional information in syllable processing.
Journal of Neurolinguistics, 17(2-3):97–119.
Qiao, T., Li, X., Pang, Y., L
¨
u, Y., Wang, F., and Jin, B.
(2017). Research on conditional characteristics vision
real-time detection system for conveyor belt longitu-
dinal tear. IET Science, Measurement & Technology,
11(7):955–960.
Qiao, T., Liu, W., Pang, Y., and Yan, G. (2016). Research
on visible light and infrared vision real-time detection
system for conveyor belt longitudinal tear. IET Sci-
ence, Measurement & Technology, 10(6):577–584.
Radau, P., Lu, Y., Connelly, K., Paul, G., Dick, A., and
Wright, G. (2009). Evaluation framework for algo-
rithms segmenting short axis cardiac mri.
Sasaki, Y. et al. (2007). The truth of the f-measure. Teach
Tutor mater, 1(5):1–5.
Xianguo, L., Lifang, S., Zixu, M., Can, Z., and Hangqi, J.
(2018). Laser-based on-line machine vision detection
for longitudinal rip of conveyor belt. Optik, 168:360–
369.
Yang, Y., Miao, C., Li, X., and Mei, X. (2014). On-
line conveyor belts inspection based on machine vi-
sion. Optik-International Journal for Light and Elec-
tron Optics, 125(19):5803–5807.
Yang, Y., Zhao, Y., Miao, C., and Wang, L. (2016). On-line
longitudinal rip detection of conveyor belts based on
machine vision. In Signal and Image Processing (IC-
SIP), IEEE International Conference on, pages 315–
318. IEEE.
VISAPP 2021 - 16th International Conference on Computer Vision Theory and Applications
310
