
Analysis of School Performance of Children and Adolescents
with Attention-Deficit/Hyperactivity Disorder:
A Dimensionality Reduction Approach
Caroline Jandre
1
, Bruno Santos
1
, Marcelo Balbino
1
, D
´
ebora de Miranda
2
, Luis Z
´
arate
1
and Cristiane Nobre
1
1
Department of Computer Science, Pontifical Catholic University of Minas Gerais, Minas Gerais, Brazil
2
Department of Pediatrics, Federal University of Minas Gerais, Minas Gerais, Brazil
Keywords:
Dimensionality Reduction, Features Selection, Machine Learning, ADHD, School Performance.
Abstract:
Attention-Deficit/Hyperactivity Disorder (ADHD) is defined by harmful inattention, disorganization, and/or
hyperactivity and impulsivity. ADHD can negatively affect an individual’s life, but it is not a definitive factor
for poor school performance. This work aims to identify classification rules that best describe the school
performance in arithmetic, writing, and reading of students with ADHD. For this, information obtained from
the Genetic Algorithm, Random Forest and specialists in ADHD were used so that later the VTJ48 and JRip
algorithms could be applied. It is usual in the health area to collect various information about the individual,
resulting in the frequent need to reduce the base’s dimensionality. The results found were promising, reaching
up to 92% of F-Measure. The discovered rules point to environmental and emotional factors as drivers of
school performance prognosis and reinforce that ADHD is not synonymous with academic failure.
1 INTRODUCTION
The large-scale collection and storage of information
have hampered the analysis and visualization of data
and the discovery of useful knowledge for decision
making (Borges and Nievola, 2012). The high di-
mensionality of data, represented here by the num-
ber of features, can impair the predictive capacity of
Machine Learning (ML) algorithms and increase the
cost of computational processing at the time of the
analysis (Santos et al., 2007). In the health area, it is
common to collect various information about the in-
dividual, such as socioeconomic status, demographic
characteristics, lifestyle, and health conditions, so that
they can be used to assess the prognosis of the pathol-
ogy (dos Santos et al., 2019). Therefore, the reduction
of dimensionality in a health-oriented database is of-
ten necessary.
Present in the Diagnostic and Statistical
Manual of Mental Disorders (DSM), Attention-
Deficit/Hyperactivity Disorder (ADHD) is defined
by harmful levels of inattention, disorganization,
and/or hyperactivity and impulsivity, symptoms that
are excessive when compared with other people of
the same age and degree of development. Population
surveys suggest that ADHD occurs in most cultures
in about 5% of children and 2.5% of adults, being
more frequent in males (APA et al., 2014).
ADHD can have negative repercussions on the in-
dividual’s social, educational, and family life (Mat-
tos, 2015). Reduced academic performance and suc-
cess, social rejection, and relationship difficulties are
usually due to the disorder, which leads to consider-
able educational and social losses (Rangel J
´
unior and
Loos, 2011).
Since ADHD is not a definitive factor for poor
school performance (Frazier et al., 2007), it is es-
sential to identify which other characteristics can en-
hance or minimize losses in the academic environ-
ment. Thus, this work aims to find classification rules
that best describe school performance in arithmetic,
writing, and reading (subjects that are part of the first
phase of primary education, foreseen in the Standard-
ized International Classification of Education (UN-
ESCO, 2012) of students with ADHD. A database
with 266 children and adolescents and 225 features
was used. Two classification algorithms were also
used: JRip, which generates rules directly from the
data set, and VTJ48, a decision tree algorithm.
In order to improve the representativeness of the
Jandre, C., Santos, B., Balbino, M., de Miranda, D., Zárate, L. and Nobre, C.
Analysis of School Performance of Children and Adolescents with Attention-Deficit/Hyperactivity Disorder: A Dimensionality Reduction Approach.
DOI: 10.5220/0010240401550165
In Proceedings of the 14th International Joint Conference on Biomedical Engineering Systems and Technologies (BIOSTEC 2021) - Volume 5: HEALTHINF, pages 155-165
ISBN: 978-989-758-490-9
Copyright
c
2021 by SCITEPRESS – Science and Technology Publications, Lda. All rights reserved
155

database, the dimensionality reduction process was
applied. As the base has a high degree of dimen-
sionality and the classification algorithms are sensi-
tive to the number of features, the reduction was car-
ried out to seek non-compromise of the performance
and the final result of the classification. Therefore,
three approaches were used to features selection: 1)
Genetic Algorithm (GA), which work to select the
smallest subset of features, representative and rele-
vant, seeking a higher quality model (Pappa et al.,
2002); 2) Random Forest (RF), an ensemble-type al-
gorithm, combining decision trees, which lists the
features in order of importance; and 3) attribute se-
lection performed by an ADHD specialist and infor-
mation from the literature (Ara
´
ujo, 2002).
It is hoped that the adopted methodology can
be used to create strategies aimed at students with
ADHD, helping them to reduce their daily difficulties.
The article follows the following structure: in Sec-
tion 2, the theoretical foundation is presented, which
brings the main concepts related to work. The works
related to the theme are covered in Section 3. Section
4 presents the methodology used, with a detailed de-
scription of the database and the pre-processing steps.
Section 5 presents the discussions regarding the re-
sults found. Finally, in Section 6, the final considera-
tions in this article are exposed.
2 BACKGROUND
2.1 Attention-Deficit/Hyperactivity
Disorder
The names and forms of treatment referring to ADHD
have changed over the years. Research shows that
the disorder is related to a deficiency of neurotrans-
mitters, known as dopamine and noradrenaline, and
a change in the right region of the frontal cerebral
lobe, affecting the control of inhibitory behavior and
executive functions (ABDA, Associac¸
˜
ao Brasileira
do D
´
eficit de Atenc¸
˜
ao, 2016). However, it is dis-
cussed about its cause being multifactorial, covering
from biological to environmental aspects (Andrade
and Lohr J
´
unior, 2017).
The individual with ADHD may have an inatten-
tive, hyperactive/impulsive, or combined profile. The
combined profile consists of the union of characteris-
tics of the other two profiles and is present in about
62% of people with ADHD (Cardoso et al., 2019).
The disorder is usually noticed at school age because
concentration becomes more necessary for tasks’ per-
formance. However, its symptomatological signs can
extend to adulthood (Santos and Vasconcelos, 2010).
The diagnosis of the disorder is based on clinical-
behavioral criteria, which hinders the accuracy of the
result. It depends on the patient’s clinical history, the
use of consolidated questionnaires in the classifica-
tion of disorders, and the information provided by
parents and the school, often omitted because they
are not considered essential or for other personal rea-
sons (Andrade and Lohr J
´
unior, 2017). However, de-
spite the difficulties of diagnosis, there is an increase
in cases of ADHD. Social awareness on the subject
brought greater collective knowledge, attracting par-
ticular attention from parents, educators, and health
professionals to the topic (de Azevedo Santos, 2017;
Jou et al., 2010).
The school environment is considered to be of
great help in the cognitive and socio-emotional de-
velopment of human beings, can assist in reducing
to a decrease in these losses resulting from ADHD.
However, due to these students’ peculiar functioning,
educational institutions have found it challenging to
deal with them (Rangel J
´
unior and Loos, 2011). In
addition to the very characteristics of ADHD, that
can leave them more scattered, students face emo-
tional and psychological factors that directly affect
their academic performance, leading to high numbers
of failures, expulsions, and dropping out of school
(de Lima and Coelho, 2018; DuPaul et al., 2017; Mat-
tos, 2015). Thus, the student with ADHD must be
helped to overcome their difficulties in the academic
environment, creating strategies that contribute to the
inclusion process and making these students not be at
a disadvantage about other people who do not have
the disorder (Cortez and Pinheiro, 2018; de Lima and
Coelho, 2018).
2.2 Features Selection with Genetic
Algorithm
When it comes to reducing dimensionality in terms
of the number of features, two methods stand out:
1) compression of features, which encodes or trans-
forms the data to obtain a compact representation
of the originals, as is the case of Principal Com-
ponent Analysis; and 2) features selection, that de-
tects and discards irrelevant, little relevant or redun-
dant features. There are at least three strategies for
features selection: exponential (represented by ex-
haustive search), sequential (represented by direct se-
quential selection), and random (represented by GA)
(Pappa et al., 2002).
GA are mathematical algorithms inspired by the
mechanisms of evolution of populations of living be-
ings. The technique introduced by (Holland, 1975)
HEALTHINF 2021 - 14th International Conference on Health Informatics
156

and popularized by (Goldberg, 1989), provides an
adaptive search engine, which follows the principle of
natural selection and survival of the fittest. This con-
ception is based on the Darwinian maxim that ”The
better an individual adapts to his environment, the
greater his chance of surviving and generating de-
scendants.” (de Lacerda and de Carvalho, 1999). The
Algorithm 1 presents a simplified representation of
the GA evolution process:
Algorithm 1: GA Pseudocode.
t ← 0;
InitializePopulation(P(t));
f itness(P(t));
while not Stopping Criteria do
parents ← Selection(P(t));
children ← CrossoverMutation(parents);
P(t) ← P(t) + children;
f itness(P(t));
P(t + 1) ← NewPopulation(P(t));
t ← t + 1;
end
In GA, the individual is portrayed by the chromo-
some, a data structure representative of the possible
solutions to the problem. The process begins with the
random generation of a set of chromosomes, form-
ing the so-called population. This population is as-
sessed through fitness, which determines how well
the individual has adapted to the problem in ques-
tion. As long as the stopping criterion is not met,
chromosomes are subjected to an evolutionary pro-
cess involving: selection, which consists of finding
the most suitable individuals and letting them pass on
their genes to the next generation; and genetic oper-
ators (crossover and mutation), which are applied to
each pair of selected parents and will generate new
individuals, called children. After this process, the
current population receives the new children gener-
ated. The fitness metric again evaluates this popula-
tion. Finally, the next individuals who will be part of
the new population are selected. After several cycles
of evolution, the population should contain the fittest
individuals (Pacheco et al., 1999).
3 RELATED WORKS
ML methods have been widely used in research
related to ADHD and have generated important
advances in searching for knowledge associated with
this disorder.
Anuradha et al. (2010) conducted a study for di-
agnosing ADHD in 100 children aged 6 to 11 years
using the Support Vector Machines (SVM) algorithm.
The database was collected through the students’ re-
sponses to a questionnaire and medical diagnoses in-
dicating whether the children had ADHD. The work
used GA to features selection in order to identify the
essential features and increase the accuracy of the
model. The study achieved an 88.7% success in diag-
nosing ADHD, which was considered a satisfactory
result from the authors.
Rahadian et al. (2017) used GA to improve
a Learning Vector Quantization 2 Neural Network
(LVQ2NN) method to classify data about the type of
ADHD in patients. The GA was used to optimize the
weight vector in the training process. The tests per-
formed without the GA reached 80% of correctness,
while the model with the GA improved the perfor-
mance to 89.5%.
Another research line that associates ML algo-
rithms with ADHD is related to solutions that seek
to diagnose the disorder through Magnetic Reso-
nance Images (MRI). Sachnev (2015) presents a
classification approach combining Meta - Cognitive
Neuro-Fuzzy Interface System (McFIS) with an fea-
tures selection mechanism based on Binary Coded
Genetic Algorithm and Extreme Learning Machine
(BCGA-ELM). The experiments show the possibil-
ity of achieving good results in the classification of
ADHD based on the hippocampus images. Already
Aradhya et al. (2020), describe an approach based on
Metaheuristic Spatial Transformation (MST) and hy-
brid GA. The purpose of the work was to use the MST
to perform the extraction of MRI features from the
ADHD-200 base that served as input for classification
using the Projection Based Learning - Meta-cognitive
Radial Basis Function Network (PBL-McRBFN).
The literature also presents research that relates
to data mining and the school environment. This
combination has become more and more frequent,
giving rise to the field of Educational Data Mining
(EDM) (Angeli et al., 2017). EDM includes works
that use ML algorithms to acquire knowledge on ed-
ucational topics, such as prediction of student perfor-
mance (Ahmed and Elaraby, 2014), learning through
remote teaching (He, 2013), among other issues re-
lated to the school environment.
However, in the surveys carried out, no studies re-
lated to the use of ML, ADHD, and school perfor-
mance, object of study of this work. The research
results associating ML and ADHD presented studies
that focus on the diagnosis of the disorder, rather than
its impact on the school environment.
Analysis of School Performance of Children and Adolescents with Attention-Deficit/Hyperactivity Disorder: A Dimensionality Reduction
Approach
157

4 MATERIALS AND METHODS
4.1 Description of the Database
The database was made available by the Depart-
ment of Pediatrics of the Federal University of Minas
Gerais - Brazil. The sample consists of 266 students
(instances), aged between 6 and 18 years. Among
them, 196 are diagnosed with ADHD and 70 have a
negative diagnosis.
The database, based on 225 characteristics (fea-
tures), it was built from the individual and family
responses present in the questionnaires. Also, inter-
views were conducted with those responsible and pa-
tients who are followed up at the hospital linked to
the college. The base contains information on health,
financial conditions, parental care, education, among
others, in addition to the notes for the arithmetic, writ-
ing, and reading tests of each present in the database.
4.2 Pre-processing
With the aim to improve the quality of the data,
the pre-processing of the database was performed
through the steps described below.
1. Exclusion of instances that did not present the
grade of the Test of School Performance (TSP)
(Stein, 1994) in arithmetic, writing, or reading.
2. Transformation of the grades obtained in the TSP,
comparing them with the average grade of a
Brazilian state, in High and Low performance.
For this, the Standards Tables present in the TSP
manual were used. The tables in the manual for
the classification of notes range from the 1st to the
6th grade, which corresponds from the 2nd to the
7th year in the current academic category. There-
fore, the years before the 2nd year were classi-
fied according to the classification criteria of the
2nd year, and those after the 7th year followed the
classification parameters of the 7th year.
3. Exclusion of irrelevant features (e.g., name and
telephone number), and those who presented the
same information or were complementary (e.g.,
age in months and age in years), concatenating
them and maintaining only one feature.
4. Transformation of features belonging to the same
category into a single feature (e.g., Conduct Dis-
order and Opposition Disorder are part of Behav-
ior Disorders, so a single feature called ”Behav-
ior Disorders” has been created, which indicates
whether the individual has ”Conduct Disorder” or
”Opposition Disorder”).
5. Filling in the missing data by the average, in nu-
merical data, or by mode, in categorical features.
6. Binarization of non-ordinal nominal features, that
is, they were coded as the presence or absence of
the characteristic.
7. Random manual separation of 15% of each class’s
instances to carry out the testing stage.
8. Balancing of 85% of the remaining data using
the SpreadSubsample algorithm present in the
Waikato Environment for Knowledge Analysis
- WEKA
1
. The SpreadSubsample algorithm fol-
lows the undersampling approach, randomly re-
ducing instances of the majority class. Uniform
distribution was applied. After balancing, the
Randomize filter was executed in order to shuffle
the instances.
Thus, Table 1 shows the total number of instances,
of each class, for testing and creating models, after
the pre-processing steps. It should be noted that the
separation of the instances for testing was carried out
before the database was balanced.
Table 1: Number of balanced instances for creating the
model and unbalanced for the testing phase.
Discipline
Training/Validation Test
High Low High Low
Arithmetic 59 59 11 29
Writing 50 50 09 31
Reading 39 39 08 27
As for the features, at the end of the pre-
processing, 130 remained to represent the base. Fig-
ure 1 presents an overview of the database, with
the categories of data and the number of features in
each category, in the form ”Number of initial fea-
tures/Number of features after pre-processing”.
4.3 Dimensionality Reduction with
Genetic Algorithm, Random Forest,
and Specialist
A combination of three methods - GA, RF, and spe-
cialist - was used to select the essential features
in learning among the 130 features present in the
database.
The Non-dominated Sorting Genetic Algorithm II
(NSGA-II) algorithm was chosen to find the best sub-
set of features maximizing your fitness, in this case,
1
WEKA is open source software issued under the
GNU General Public License that contains a collec-
tion of ML algorithms (Garner, 1995). Available at
http://www.cs.waikato.ac.nz/ml/weka
HEALTHINF 2021 - 14th International Conference on Health Informatics
158
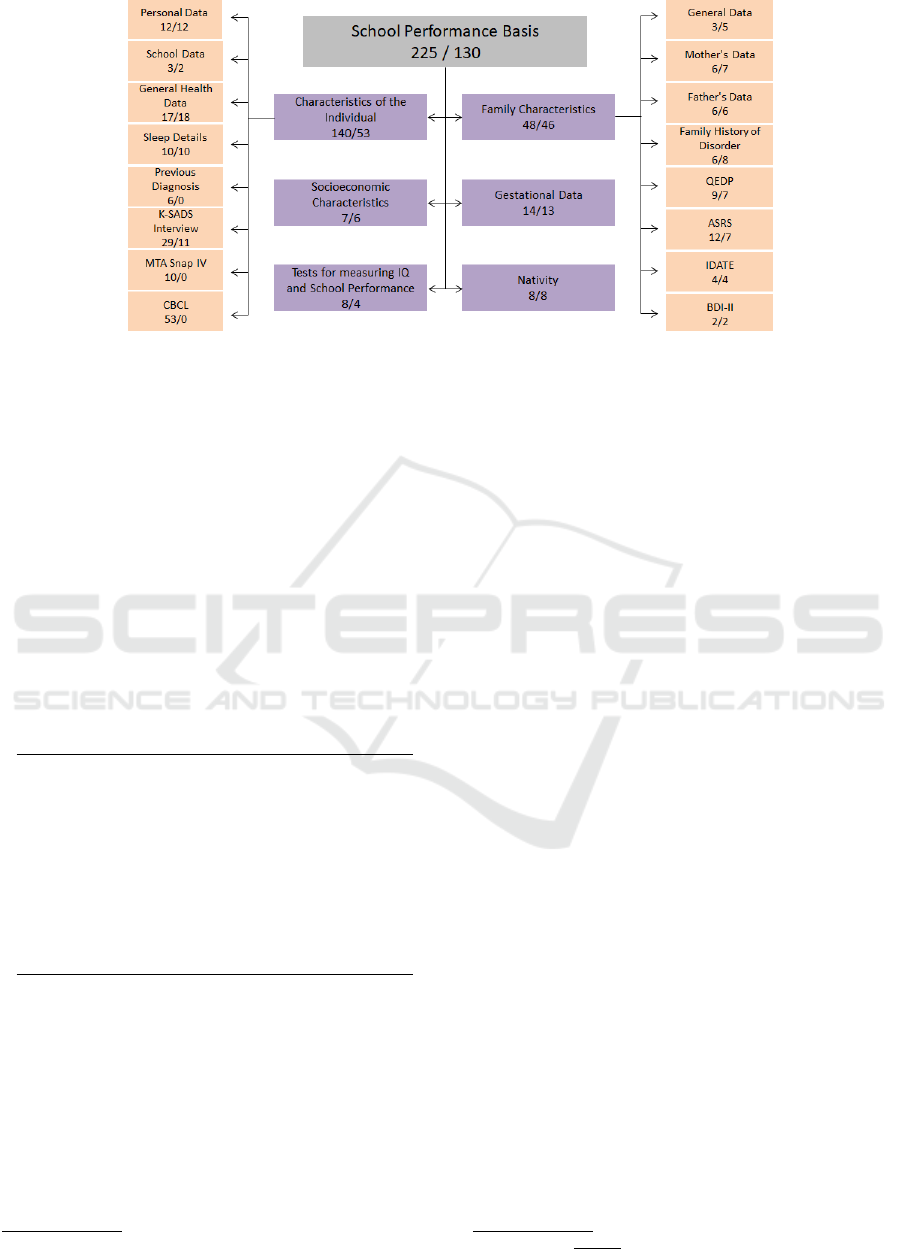
Figure 1: Overview of the database, grouped by categories.
the F-Measure. To evaluate the F-Measure, the K-
Nearest Neighbors (KNN) classifier was used. His
choice was motivated by the low computational cost
for adjusting his parameters. In this work, the pa-
rameter k (number of closest neighbors) was adjusted,
varying its value range [1-10]. GA was implemented
in the Python language, using the DEAP library, avail-
able from Universit
´
e Laval (Fortin et al., 2012).
Aiming at the adequate definition of the necessary
parameters for the experiments’ execution, intervals
of values were analyzed, having as a stopping crite-
rion the number of GA generations. For each set of
parameters, 10 different random seeds were used. Ta-
ble 2 shows the ranges of values used.
Table 2: Range of parameter values.
Population initialization Random
Representation Binary
Crossover operator Two Points
Crossover probability 70%, 75%, 80% and 85%
Mutation operator One Point
Mutation probability 1%, 5% and 10%
Population size 100, 300 and 500
Number of generations 100, 300 and 500
Crossover selection method Tournament (size = 2)
Composition of the new generation Non-dominated individuals
Stopping criteria Number of generations
To automatically adjust the Random Forest algo-
rithm’s parameters, CVParameterSelection
2
was used
(Kohavi, 1995b), varying the number of trees and fea-
tures, and the depth of the trees. The RF calculates the
feature’s importance, indicating which are the most
important for creating the model. Only features with
relevance as from 70% were considered.
Regarding specialist, the knowledge of the medi-
cal expert in ADHD, who provided the database and
2
Available in the WEKA tool.
is a collaborator in this work, was used to finalize the
features selection, in conjunction with the informa-
tion present in the work of Ara
´
ujo (2002), focused on
the school performance.
Figure 2 shows the features selected by GA and
RF, separated for each of the three disciplines (Fig-
ures 2 a, b and c). The figure also shows the features
considered important, for the three disciplines (Figure
2 d), according to the specialist.
4.4 Description of Methods
To assist in discovering the rules that lead the stu-
dent to obtain a high or low performance, the VTJ48
algorithm (tree algorithm) and the JRip (rule algo-
rithm) were used. VTJ48 (Stiglic et al., 2012) has
the same functioning as J48, developed by Quinlan
(1993), which is a Java adaptation of C4.5. That is,
the VTJ48 also builds a decision tree from the in-
stances, but its difference is that it automatically ad-
justs the confidence for pruning and the minimum
number of instances per leaf. JRip is a Java imple-
mentation of the Ripper algorithm, proposed by Co-
hen (1995) as an optimized version of the IREP algo-
rithm. JRip constructs the rules seeking to represent
the model as compactly as possible with as much in-
formation of the data; that is, it seeks to consistently
explain which features are relevant to the pattern(s)
found in the database, with the minimum of rules.
4.5 Model Quality Assessment Metrics
To evaluate the quality of the obtained models, Preci-
sion, Recall, and F-Measure metrics were used.
Precision
3
is the percentage of instances correctly
3
Precision =
V P
V P+FP
Analysis of School Performance of Children and Adolescents with Attention-Deficit/Hyperactivity Disorder: A Dimensionality Reduction
Approach
159
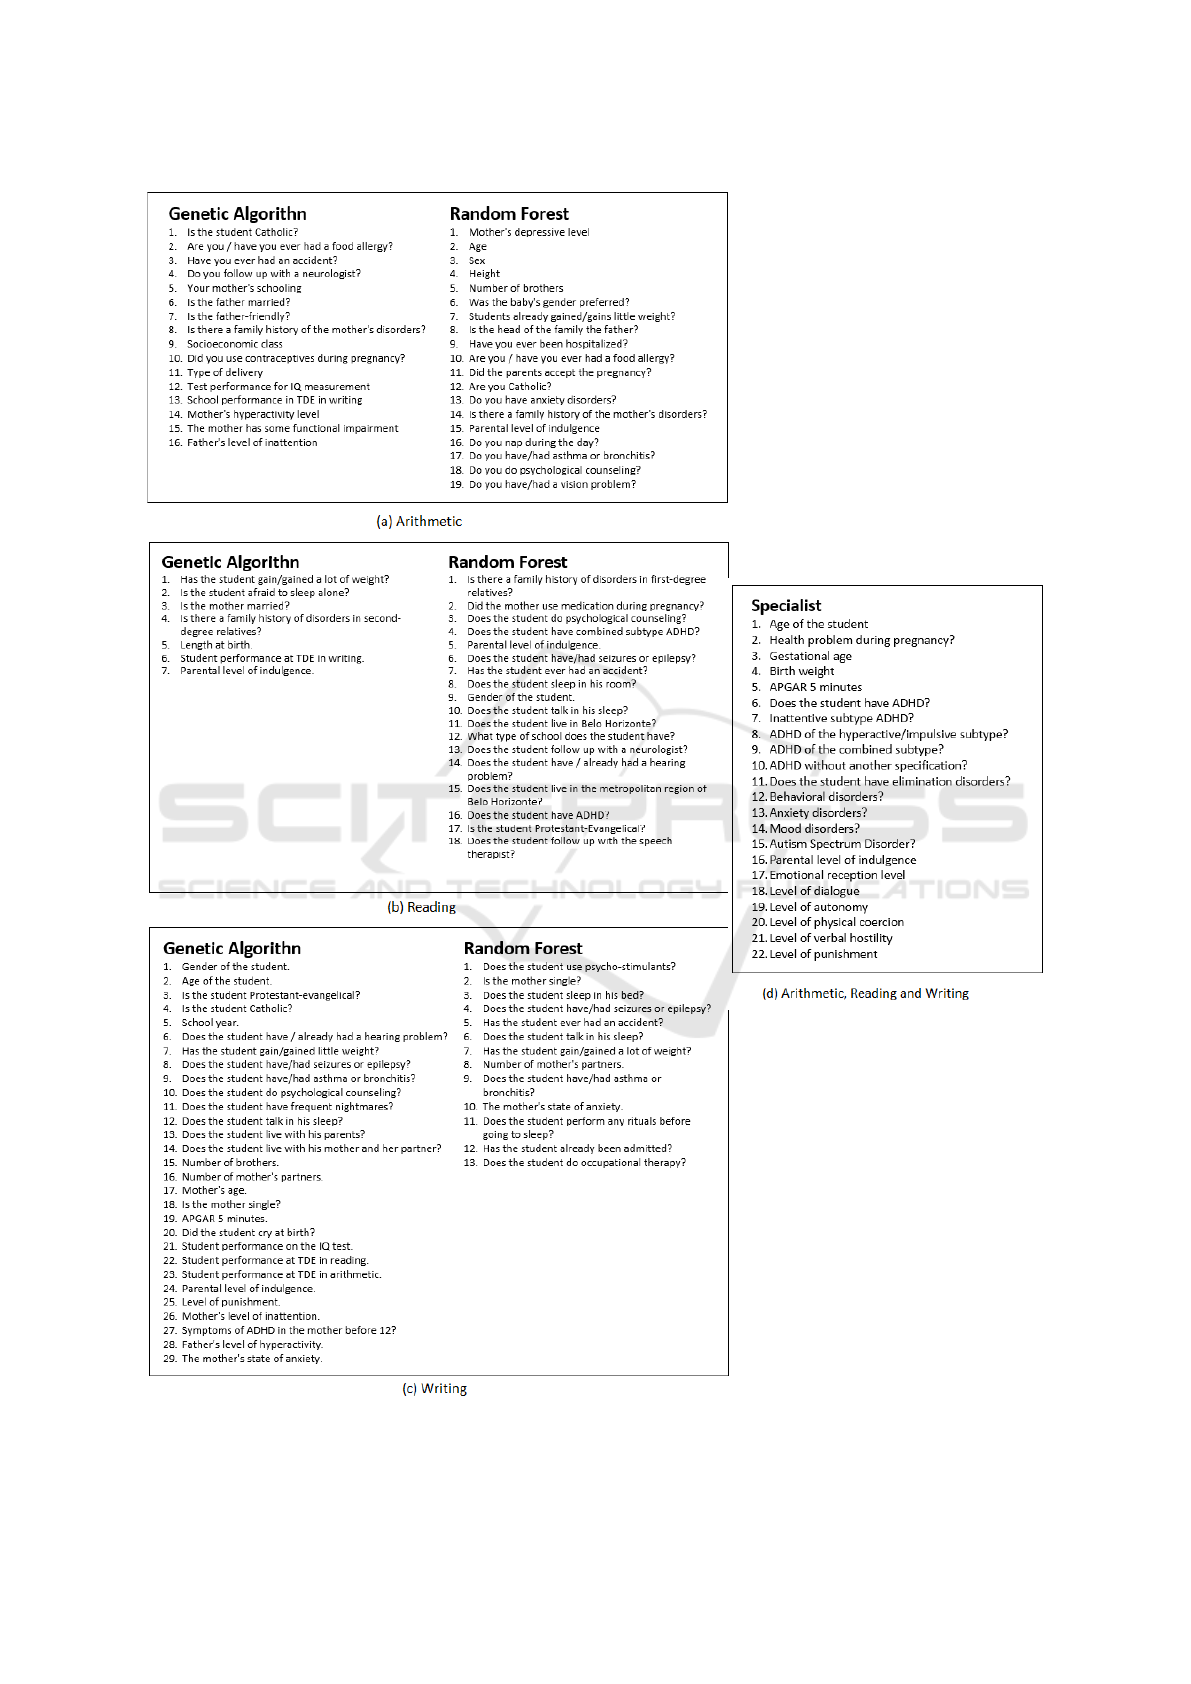
Figure 2: Description of the features of the three databases, considering the three selection methods.
HEALTHINF 2021 - 14th International Conference on Health Informatics
160

classified in a class, out of all those that were classi-
fied in the class.
Recall
4
is the percentage of instances of a class
that have been correctly predicted to belong to the
class.
F-Measure
5
represents the harmonic mean be-
tween Precision and Recall.
All classifiers were built and validated using the
k-fold cross-validation process, with k = 10 (Kohavi,
1995a).
5 RESULTS AND DISCUSSIONS
Figures 3 and 4 present the results in the phase of cre-
ating the model and test, respectively. The values re-
fer to the experiments with the selection of the GA
and the insertion of the features of the RF and special-
ist. Results are presented by discipline and by class.
It is noteworthy that in the experiments where the
features were selected only by the GA, the number
of features used in predicting arithmetic, writing, and
reading performance were only 16, 29, and 7, respec-
tively. In the experiments where the features are a
combination of the non-identical features present in
selecting the GA, RF, and specialist, 51 features re-
mained for arithmetic representation, 54 of writing,
and 43 of reading.
Analyzing the model creation phase, it is consid-
ered that the best results in the three disciplines come
from the JRip algorithm. Regarding the disciplines of
’arithmetic’ and ’reading’, the best results were ob-
tained only with the GA’s features. In the case of
the discipline ’writing’, the best results were obtained
with the combination of the features identified by the
GA, RF, and specialist. It is observed that the per-
formance obtained by the two algorithms remained
close, with F-Measure ranging from 64% to 84%.
To verify the efficiency of the generated models,
tests were performed with instances not seen during
the creation of the models. In terms of algorithms, the
disciplines ’arithmetic’ and ’reading’ obtained better
results with the VTJ48 algorithm, while in ’writing’,
the use of JRip was more efficient. Regarding the fea-
tures, in the discipline ’arithmetic’, the best results
were obtained with the GA, RF, and specialist fea-
tures. In ’writing’ and ’reading’, the best results were
obtained with the features found only by the GA. An
F-Measure ranging from 48% to 92% is perceived for
both algorithms.
4
Recall =
V P
V P+FN
5
F −Measure =
2×Recall×Precision
Recall+Precision
5.1 Generated Rules
Table 3 presents the rules found, which explain the
reasons for a student to have a high or low perfor-
mance in the subjects, with coverage from 10%. Cov-
erage is the percentage of instances that the rule clas-
sifies correctly, out of all class instances.
Regarding arithmetic, analyzing the five rules, it
is clear that performance in writing vigorously influ-
ences students’ performance in this discipline. It is
observed that the influence is mainly in rule 3, where
only good writing performance is enough for high
performance in arithmetic. This connection is pos-
sible since the student’s ease or difficulty decoding
and/or understanding mathematical symbols can af-
fect calculations. However, detailing each rule, the
relevance of other features is observed. Rules 1 and
2, for example, indicate that if the student does poorly
in writing and is of middle or vulnerable socioeco-
nomic class, according to the Secretariat for Strate-
gic Affairs (Kamakura and Mazzon, 2016), the stu-
dent will do poorly in arithmetic, indicating that the
financial aspect is important for student performance.
These two rules alone classified 76% of the instances
of the lower class. With rule 4, it is possible to no-
tice several aspects of the individual’s life, because
if his performance in writing is average, and he was
never below the ideal weight for his age and was born
by normal childbirth, and his parents give him aver-
age or low autonomy (highest present value in the
base is 25) and there was no health problem during
pregnancy, the performance in arithmetic is high. The
parental style factor referring to autonomy may indi-
cate that if the father has a balance between listen-
ing to his son, but not letting him dictate the house’s
rules, or doing everything he wants, it has a positive
impact on performance. Rule 5 reveals that if the per-
formance in writing is average, and the student was
never below the ideal weight for his age and was born
by cesarean childbirth, the performance in arithmetic
is high, pointing out the relevance of the type of child-
birth.
In writing, rule 1 indicates that if the student has
a poor performance in arithmetic, he also does poorly
in writing, reinforcing the strong correlation between
subjects. This single rule classifies 70% of instances
of the low class. Rule 2 shows that poor performance
in reading and gender = male also leads to poor writ-
ing performance. The fact that males appear in this
rule may indicate a reproduction of social stereotypes
where girls are said to be quieter, and boys are messy
and undisciplined, which leads to a negative assess-
ment of the child’s behavior and influences the final
note (Carvalho, 2007). Rule 3 reveals that if the indi-
Analysis of School Performance of Children and Adolescents with Attention-Deficit/Hyperactivity Disorder: A Dimensionality Reduction
Approach
161
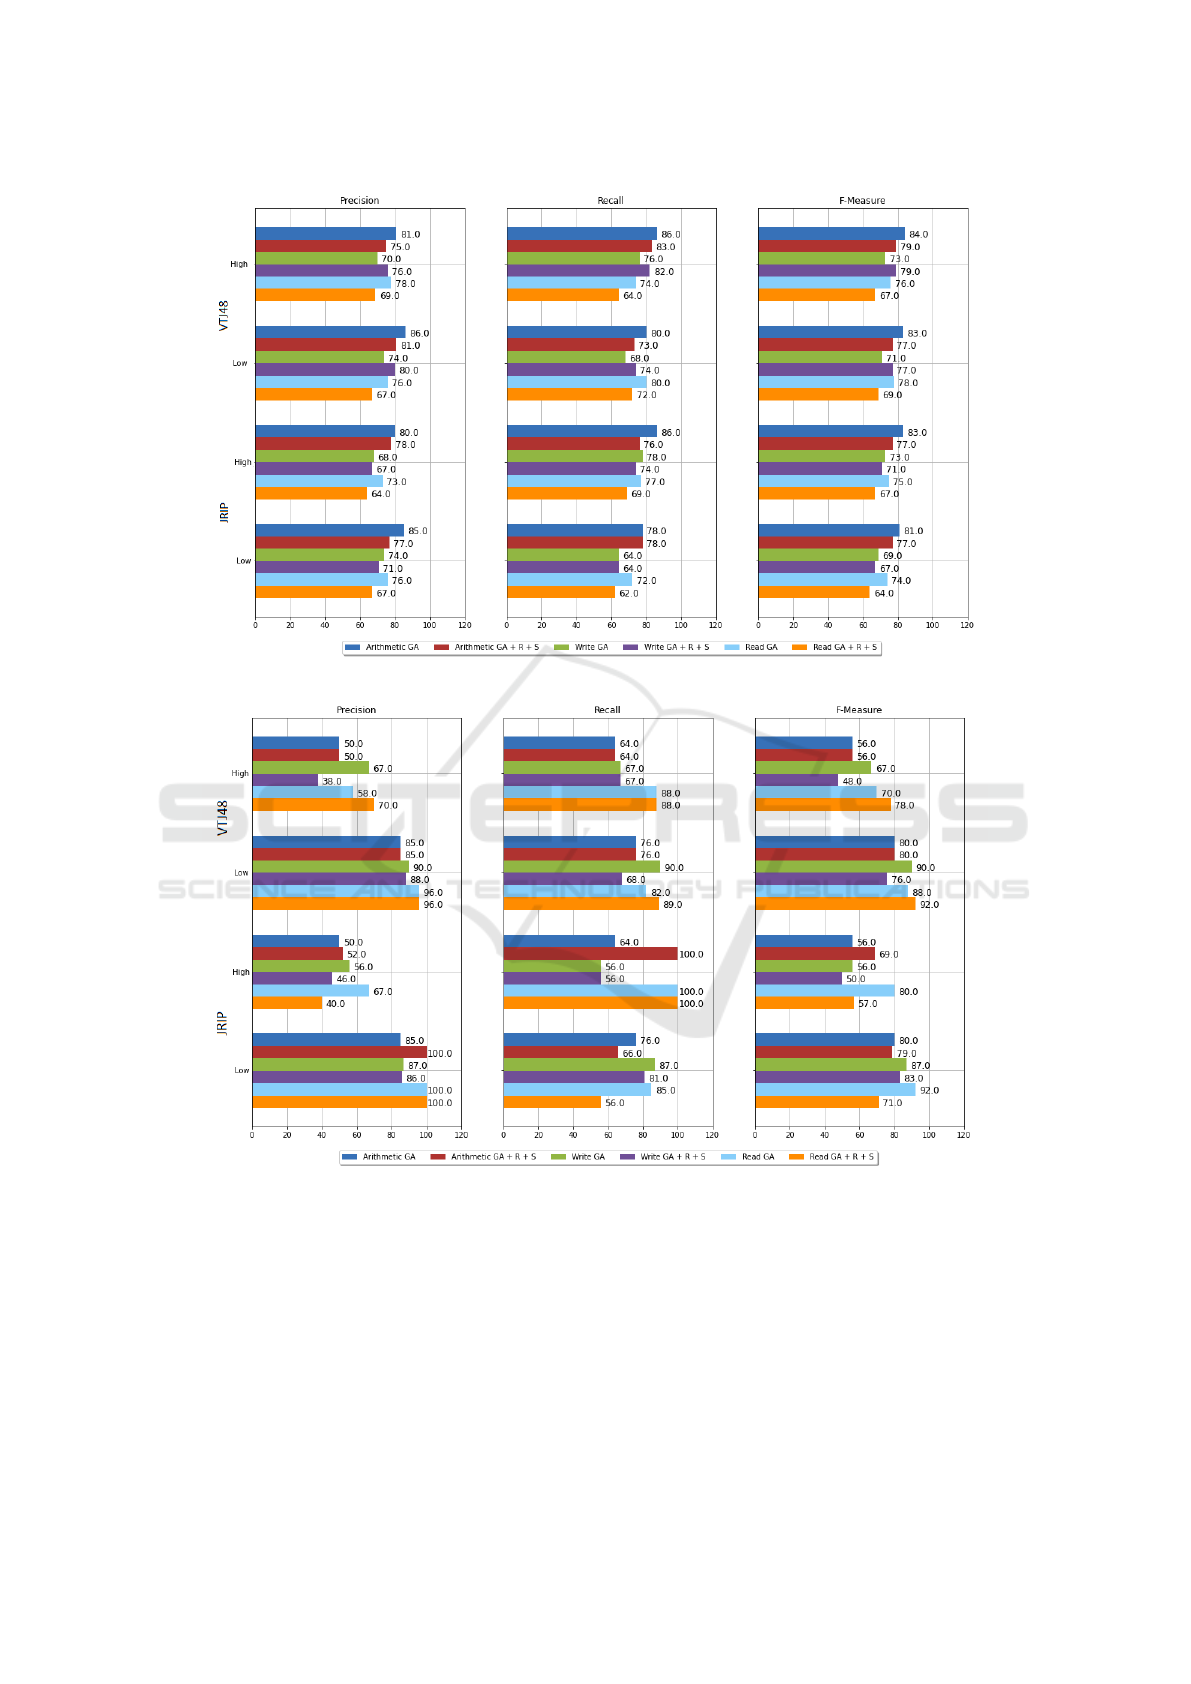
Figure 3: Evaluation of model creation.
Figure 4: Evaluation of model quality through tests.
vidual’s life characteristics do not fit into any previous
rules, then his performance will be high in writing.
That is, if the performance in arithmetic and reading
is high and the student is female, then the writing per-
formance will be high, with coverage of 88% of the
instances of this class.
Regarding reading, it is noted that the perfor-
mance in writing has a strong influence on the stu-
dent’s performance in this discipline, especially in
rule 2, where if the student does well in writing, he
also does well in reading. However, the influence of
some other features on reading performance is also
observed. Rule 1, for example, with coverage of 80%,
points to the importance of the parental behavior, be-
cause if the student has a low writing performance
and his parents are less indulgent (the highest present
value in the base is 24), that is, generally do not for-
give mistakes or praise successes, their reading per-
formance will also below. This observation indicates
that family support is essential, especially in times of
HEALTHINF 2021 - 14th International Conference on Health Informatics
162

Table 3: Generated rules and coverage.
Arithmetic
Number Rule Coverage
1 If writing performance = low and social class = average then Low 64%
2 If writing performance = low and social class = vulnerable then Low 12%
3 If writing performance = high then High 42%
4 If writing performance = medium and gained little weight = no and
childbirth = normal and autonomy <= 20 and health problem in preg-
nancy = no then High
22%
5 If writing performance = medium and gained little weight = no and
childbirth = cesarean then High
20%
Writing
Number Rule Coverage
1 If arithmetic performance = low then Low 70%
2 If reading performance = low and gender = male then Low 18%
3 If it doesn’t fit any previous rule then High 88%
Reading
Number Rule Coverage
1 If writing performance = low and indulgence <= 15 then Low 80%
2 If writing performance = high then High 44%
3 If writing performance = average and fear of sleeping alone = no
then High
26%
difficulty. Rule 3 suggests that when writing perfor-
mance is average, and the student is not afraid to sleep
alone, he has a high reading performance. One of the
justifications for fear of sleeping alone may be linked
to phobic anxiety, which causes a lack of confidence,
security, and support, leading to feelings of helpless-
ness, fragility, and dependence (da Rocha Antony,
2009). Therefore, not being afraid to sleep alone can
represent certain self-confidence, which results in a
positive performance.
When analyzing the rules, it is noticed that knowl-
edge in other disciplines directly influences the stu-
dent’s performance in the discipline being predicted.
Therefore, other experiments were carried out to
verify the model’s behavior without the disciplines
as an entry feature, following the same methodol-
ogy described previously. However, for the ’read-
ing’ and ’writing’ disciplines, the algorithmic perfor-
mance was not promising, showing a loss of up to 47
percentage points in the high class. As for the disci-
pline of ’arithmetic’, there was again in algorithmic
performance of up to 11 percentage points in the low
class. In this discipline, the rules found relate some
features to the high class: 1) the fact that the mother
has completed a higher education course, 2) the stu-
dent is less than or equal to eight years old, and the
parents practice physical coercion in a moderate to
low way.
With the rules found, it is noted that performance
in the disciplines can be affected by family financial
and health conditions during pregnancy, factors re-
lated to the student’s weight, parental behavior, sit-
uations surrounding birth, circumstances associated
with fear and insecurity, mother’s education, gender
and age of the student, in addition to her performance
in other subjects. Therefore, a multifocal approach
must be performed so that students with ADHD can
improve their academic performance.
6 FINAL CONSIDERATIONS
With the possible unfavorable prognosis of students
with ADHD, it becomes significant to identify which
characteristics influence the individual’s experience
to alleviate their difficulties.
To identify the classification rules, ”white box” al-
gorithms were used. The purpose of using these al-
gorithms was to obtain, more directly and objectively,
the knowledge acquired about the school performance
pattern of students with ADHD. The use of this tech-
nique proved to be positive for the database used. Re-
garding the reduction of dimensionality, it is noted
that the Genetic Algorithm performed quite satisfac-
torily since in two (writing and reading) of the three
disciplines evaluated, the best performance of the al-
gorithms was obtained only with the features identi-
fied by this method.
Furthermore, the rules obtained reveal that differ-
ent contexts can influence school performance, not
Analysis of School Performance of Children and Adolescents with Attention-Deficit/Hyperactivity Disorder: A Dimensionality Reduction
Approach
163

being ADHD synonymous with academic failure.
Therefore, it is necessary to understand the envi-
ronment of that child or adolescent with ADHD be-
fore creating strategies that aim to remedy or alleviate
the educational problems faced by them, since envi-
ronmental and emotional factors directly affect their
school performance, contributing to the difficulties al-
ready existing in the daily lives of people with ADHD
are expanded.
As future work is intended to evaluate new bal-
ancing distributions with the undersampling approach
since the one used in this work was the uniform distri-
bution. Besides, it aims to investigate what the results
would be like if the problem were treated as a multi-
label. In other words, it is intended to evaluate the
quality of the models in predicting the performance
of students in all subjects, jointly.
ACKNOWLEDGEMENTS
This study was financed in part by the Coordination
for the Improvement of Higher Education Personnel
- Brasil (CAPES) - Finance Code 001. The authors
thank the National Council for Scientific and Techno-
logical Development of Brazil (CNPq - Conselho Na-
cional de Desenvolvimento Cient
´
ıfico e Tecnol
´
ogico)
and the Foundation for Research Support of the Mi-
nas Gerais State (FAPEMIG). The work was devel-
oped at the Pontifical Catholic University of Minas
Gerais, PUC Minas in the Applied Computational In-
telligence laboratory – LICAP.
REFERENCES
ABDA, Associac¸
˜
ao Brasileira do D
´
eficit de Atenc¸
˜
ao
(2016). Motivac¸
˜
ao
´
e coisa s
´
eria. https://tdah.org.br/
motivacao-e-coisa-seria/. Online; access October 5,
2020.
Ahmed, A. and Elaraby, I. S. (2014). Data mining: A pre-
diction for student’s performance using classification
method. World Journal of Computer Application and
Technology, 2(2):43–47.
Andrade, A. L. M. and Lohr J
´
unior, A. (2017).
Quest
˜
oes atuais acerca do transtorno de d
´
eficit
de atenc¸
˜
ao/hiperatividade. Psicologia Argumento,
25(48):73–83.
Angeli, C., Howard, S. K., Ma, J., Yang, J., and Kirschner,
P. A. (2017). Data mining in educational technol-
ogy classroom research: Can it make a contribution?
Computers & Education, 113:226 – 242.
Anuradha, J., Tisha, Ramachandran, V., Arulalan, K. V.,
and Tripathy, B. K. (2010). Diagnosis of adhd using
svm algorithm. In Proceedings of the Third Annual
ACM Bangalore Conference, COMPUTE ’10, New
York, NY, USA. Association for Computing Machin-
ery.
APA, A. P. A. et al. (2014). DSM-5: Manual diagn
´
ostico e
estat
´
ıstico de transtornos mentais. Artmed Editora.
Aradhya, A. M. S., Sundaram, S., and Pratama, M. (2020).
Metaheuristic spatial transformation (mst) for accu-
rate detection of attention deficit hyperactivity disor-
der (adhd) using rs-fmri. In 2020 42nd Annual In-
ternational Conference of the IEEE Engineering in
Medicine Biology Society (EMBC), pages 2829–2832.
Ara
´
ujo, A. P. d. Q. C. (2002). Avaliac¸
˜
ao e manejo de crianc¸a
com dificuldade escolar e dist
´
urbio de atenc¸
˜
ao. Jornal
de Pediatria, 78:S104–S110.
Borges, H. B. and Nievola, J. C. (2012). Comparing
the dimensionality reduction methods in gene expres-
sion databases. Expert Systems with Applications,
39(12):10780–10795.
Cardoso, L., Mollica, A. M. V., Sales, A. M., and Ara
´
ujo,
L. C. (2019). O l
´
udico e a aprendizagem de crianc¸as
com transtorno de d
´
eficit de atenc¸
˜
ao/hiperatividade.
Revista Cient
´
ıfica FAGOC-Multidisciplinar, 3(2).
Carvalho, M. P. d. (2007). Por que tantos meninos v
˜
ao mal
na escola? crit
´
erios de avaliac¸
˜
ao escolar segundo o
sexo. Cadernos de Pesquisa.
Cohen, W. W. (1995). Fast effective rule induction. In
Twelfth International Conference on Machine Learn-
ing, pages 115–123. Morgan Kaufmann.
Cortez, M. T. and Pinheiro,
ˆ
A. M. V. (2018). Tdah e escola:
incompatibilidade? Paid
´
eia, 13(19).
da Rocha Antony, S. M. (2009). Os ajustamentos cria-
tivos da crianc¸a em sofrimento: uma compreens
˜
ao
da gestalt-terapia sobre as principais psicopatologias
da inf
ˆ
ancia. Estudos e pesquisas em Psicologia,
9(2):356–375.
de Azevedo Santos, J. L. (2017). Tdah-transtorno de d
´
eficit
de atenc¸
˜
ao e hiperatividade: Intervenc¸
˜
ao psicope-
dag
´
ogica. Ideias e Inovac¸
˜
ao-Lato Sensu, 4(1):115.
de Lacerda, E. G. and de Carvalho, A. (1999). Introduc¸
˜
ao
aos algoritmos gen
´
eticos. Sistemas inteligentes:
aplicac¸oes a recursos hıdricos e ci
ˆ
encias ambientais,
1:99–148.
de Lima, C. B. and Coelho, C. L. M. (2018). Transtorno de
d
´
eficit de atenc¸
˜
ao/hiperatividade-um olhar sob a per-
spectiva da educac¸
˜
ao especial inclusiva. Cadernos de
Pesquisa em Educac¸
˜
ao, 20(47):172–192.
dos Santos, H. G., do Nascimento, C. F., Izbicki, R.,
de Oliveira Duarte, Y. A., Chiavegatto Filho, A. D. P.,
et al. (2019). Machine learning para an
´
alises predi-
tivas em sa
´
ude: exemplo de aplicac¸
˜
ao para predizer
´
obito em idosos de s
˜
ao paulo, brasil. Cad. Sa
´
ude
P
´
ublica, 35(7):e00050818.
DuPaul, G. J., Dahlstrom-Hakki, I., Gormley, M. J., Fu, Q.,
Pinho, T. D., and Banerjee, M. (2017). College stu-
dents with adhd and ld: Effects of support services
on academic performance. Learning Disabilities Re-
search & Practice, 32(4):246–256.
Fortin, F.-A., De Rainville, F.-M., Gardner, M.-A. G.,
Parizeau, M., and Gagn
´
e, C. (2012). Deap: Evolu-
tionary algorithms made easy. J. Mach. Learn. Res.,
13(1):2171–2175.
HEALTHINF 2021 - 14th International Conference on Health Informatics
164

Frazier, T. W., Youngstrom, E. A., Glutting, J. J., and
Watkins, M. W. (2007). Adhd and achievement: Meta-
analysis of the child, adolescent, and adult literatures
and a concomitant study with college students. Jour-
nal of learning disabilities, 40(1):49–65.
Garner, S. (1995). Weka: The waikato environment for
knowledge analysis. Proceedings of the New Zealand
Computer Science Research Students Conference.
Goldberg, D. E. (1989). Genetic algorithms in search. Op-
timization, and MachineLearning.
He, W. (2013). Examining students’ online interaction in
a live video streaming environment using data min-
ing and text mining. Computers in Human Behavior,
29(1):90 – 102. Including Special Section Youth, In-
ternet, and Wellbeing.
Holland, J. (1975). Adaptation in natural and artificial sys-
tems: an introductory analysis with application to bi-
ology. Control and artificial intelligence.
Jou, G. I. d., Amaral, B., Pavan, C. R., Schaefer, L. S., and
Zimmer, M. (2010). Transtorno de d
´
eficit de atenc¸
˜
ao e
hiperatividade: um olhar no ensino fundamental. Psi-
cologia: reflex
˜
ao e cr
´
ıtica, 23(2):409–409.
Kamakura, W. and Mazzon, J. A. (2016). Crit
´
erios de
estratificac¸
˜
ao e comparac¸
˜
ao de classificadores socioe-
con
ˆ
omicos no brasil. Revista de administrac¸
˜
ao de em-
presas, 56(1):55–70.
Kohavi, R. (1995a). A study of cross-validation and boot-
strap for accuracy estimation and model selection. In
Proceedings of the 14th International Joint Confer-
ence on Artificial Intelligence - Volume 2, IJCAI’95,
pages 1137–1143, San Francisco, CA, USA. Morgan
Kaufmann Publishers Inc.
Kohavi, R. (1995b). Wrappers for Performance Enhance-
ment and Oblivious Decision Graphs. PhD thesis,
Stanford University, Department of Computer Sci-
ence, Stanford University.
Mattos, P. (2015). No mundo da lua: perguntas e respostas
sobre transtorno do d
´
efict de atenc¸
˜
ao com hiperativi-
dade em crianc¸as, adolescentes e adultos. Associac¸
˜
ao
Brasileira do D
´
efict de Atenc¸
˜
ao.
Pacheco, M. A. C. et al. (1999). Algoritmos gen
´
eticos:
princ
´
ıpios e aplicac¸
˜
oes. ICA: Laborat
´
orio de In-
telig
ˆ
encia Computacional Aplicada. Departamento
de Engenharia El
´
etrica. Pontif
´
ıcia Universidade
Cat
´
olica do Rio de Janeiro. Fonte desconhecida,
page 28.
Pappa, G. L., Freitas, A. A., and Kaestner, C. A. (2002).
A multiobjective genetic algorithm for attribute selec-
tion. In Proc. 4th Int. Conf. on Recent Advances in
Soft Computing (RASC-2002), pages 116–121, Not-
tingham. Nottingham Trent University.
Quinlan, R. (1993). C4.5: Programs for Machine Learning.
Morgan Kaufmann Publishers, San Mateo, CA.
Rahadian, B. A., Dewi, C., and Rahayudi, B. (2017).
The performance of genetic algorithm learning vec-
tor quantization 2 neural network on identification of
the types of attention deficit hyperactivity disorder.
In 2017 International Conference on Sustainable In-
formation Engineering and Technology (SIET), pages
337–341.
Rangel J
´
unior,
´
E. d. B. and Loos, H. (2011). Escola e
desenvolvimento psicossocial segundo percepc¸
˜
oes de
jovens com tdah. Paid
´
eia, 21(50):373–382.
Sachnev, V. (2015). An efficient classification scheme for
adhd problem based on binary coded genetic algo-
rithm and mcfis. In 2015 International Conference
on Cognitive Computing and Information Process-
ing(CCIP), pages 1–6.
Santos, J. C., Oliveira, J. d. F., Dutra, L. V., Santa’Ana,
S., and Renn
´
o, C. D. (2007). Selec¸
˜
ao de atribu-
tos usando algoritmos gen
´
eticos para classificac¸
˜
ao de
regi
˜
oes. XIII Simp
´
osio Brasileiro de Sensoriamento
Remoto, Florian
´
opolis, Brasil. INPE–Instituto Na-
cional de Pesquisas Espaciais, pages 6143–6150.
Santos, L. d. F. and Vasconcelos, L. A. (2010). Transtorno
do d
´
eficit de atenc¸
˜
ao e hiperatividade em crianc¸as:
uma revis
˜
ao interdisciplinar. Psicologia: Teoria e
Pesquisa, 26:717 – 724.
Stein, L. M. (1994). Tde: teste de desempenho escolar:
manual para aplicac¸
˜
ao e interpretac¸
˜
ao. S
˜
ao Paulo:
Casa do Psic
´
ologo, pages 1–17.
Stiglic, G., Kocbek, S., Pernek, I., and Kokol, P. (2012).
Comprehensive decision tree models in bioinformat-
ics. PloS one, 7(3):e33812.
UNESCO, I. f. S. (2012). International standard classifi-
cation of education: ISCED 2011. UNESCO Institute
for Statistics Montreal, Quebec.
Analysis of School Performance of Children and Adolescents with Attention-Deficit/Hyperactivity Disorder: A Dimensionality Reduction
Approach
165
