
Integration of Life Cycle Assessment and Data Envelopment
Analysis using a Free Disposable Hull Approach to Evaluate
Farms’ Eco-efficiency
Leonardo Vásquez-Ibarra
1a
, Alfredo Iriarte
2b
, Ricardo Rebolledo-Leiva
3c
,
Marcela Gonzalez-Araya
2d
and Lidia Angulo-Meza
4e
1
Doctoral Program in Engineering Systems, University of Talca, Camino a Los Niches km.1, Curicó, Chile
2
Department of Industrial Engineering, University of Talca, Camino a Los Niches km.1, Curicó, Chile
3
Master Program in Operations Management, University of Talca, Camino a Los Niches km.1, Curicó, Chile
4
Production Engineering Department, Universidade Federal Fluminense, Rua Passo da Patria 156, São Domingos,
Niterói 24210-240, Brazil
lidiaangulomeza@id.uff.br
Keywords: Eco-efficiency, Free Disposable Hull, Life Cycle Assessment, Data Envelopment Analysis, Raspberries
Production.
Abstract: The joint use of Life Cycle Assessment and Data Envelopment Analysis, also known as LCA+DEA, appears
as a suitable methodology to evaluate eco-efficiency of multiple units. This methodology has been developed
mainly during the last decade, and different methodological aspects has been proposed. However, there are
other such as the use of advanced DEA models that have been poorly explored. In this sense, this study seeks
to integrate the Free Disposable Hull (FDH) approach into LCA+DEA methodology, applied an agricultural
case study. The five-step method is employed to a sample of 37 raspberry producers considering carbon
footprint as environmental category. The results indicated that 11 farmers are identified as inefficient for
which operational and environmental targets are proposed. The use of FDH model is suitable for the use into
the LCA+DEA methodology since it allows to determine one benchmark for inefficient farmers, unlike others
models widely used in this methodology, such as BCC, SBM or CCR.
1 INTRODUCTION
Sustainable development has received great attention
during the last decade. Since its proposal eco-
efficiency has been coined as a quantitative
management approach for studying both,
environmental and economic aspects (Rybaczewska-
Błażejowska & Gierulski, 2018). The World Business
Council for Sustainable Development (WBCSD)
defined eco-efficiency concept as “the delivery of
competitively priced goods and services that satisfy
human needs and bring quality of life, while
progressively reducing ecological impacts and re-
a
https://orcid.org/0000-0001-8514-8685
b
https://orcid.org/0000-0002-8281-829X
c
https://orcid.org/0000-0003-1082-169X
d
https://orcid.org/0000-0002-4969-2939
e
https://orcid.org/0000-0003-4557-0210
source intensity throughout the life-cycle, to a level at
least in line with the earth's estimated carrying
capacity” (Schmidheiny & Stigson, 2000).
Eco-efficiency has been evaluated using different
methodologies, which can be classified into linear
programming methods, statistical and econometric
tests, and, accounting and indicator techniques
(Nikolaou & Matrakoukas, 2016). Among these
methodologies, the joint use of life cycle assessment
and Data Envelopment Analysis appears as one of the
most recent approaches, allowing to assess the
operational and environmental performance of
multiple units (Rebolledo-Leiva, Angulo-Meza,
Iriarte, & González-Araya, 2017a).
Vásquez-Ibarra, L., Iriarte, A., Rebolledo-Leiva, R., Gonzalez-Araya, M. and Angulo-Meza, L.
Integration of Life Cycle Assessment and Data Envelopment Analysis using a Free Disposable Hull Approach to Evaluate Farms’ Eco-efficiency.
DOI: 10.5220/0010240201850191
In Proceedings of the 10th International Conference on Operations Research and Enterprise Systems (ICORES 2021), pages 185-191
ISBN: 978-989-758-485-5
Copyright
c
2021 by SCITEPRESS – Science and Technology Publications, Lda. All rights reserved
185

LCA is a widely used methodology to evaluate the
potential environmental impacts through the whole
life cycle of products or services (ISO, 2006). This
methodology allows to identify opportunities to
improve their environmental performance.
DEA is a non-parametric tool that uses linear
programming to estimate the relative efficiency of
several homogeneous units, known as Decision
Making Units (DMU) (Cooper, Seiford, & Tone,
2007). These DMUs use multiple inputs (resources)
to produce multiple outputs (outcomes of the
processes). The relative efficiency is measured
employing inputs and outputs into different
mathematical DEA models. In general terms, these
models, could be oriented to inputs or to outputs. The
former (input-oriented models) seek to minimize the
inputs while maintaining the outputs constant. On the
contrary, the second (output-oriented models) aim to
maximize all outputs while maintaining the inputs
constant (Ten Raa & Greene, 2019). DEA models
classified the DMUs into efficient if its score is 1 (or
100%) and inefficient otherwise. For the inefficient
ones, DEA also provides targets and benchmarks in
order to become efficient.
The joint use of LCA and DEA, also namely
LCA+DEA methodology, has been developed into
three different LCA+DEA methods, five-step method
Vázquez-Rowe et al. (2010), three-step method
Lozano et al. (2010) and four-step method Rebolledo-
Leiva et al. (2017). The main differences among these
methods are the number of steps and the kind of
variables used into the DEA model (Vásquez-Ibarra,
Rebolledo-Leiva, Angulo-Meza, González-Araya, &
Iriarte, 2020). Beyond the LCA+DEA methodology,
others Life Cycle approaches have been coupled with
DEA, outstanding the development of the LC+DEA
concept. Due to the current relevance of GHG
emissions mitigation, based on the Carbon Footprint
(CF), a methodological framework is based on the
combined use of CF and DEA, known as CF+DEA
(Rebolledo-Leiva et al., 2017a; I Vázquez-Rowe &
Iribarren, 2015).
The use of LCA+DEA has increased during the
last decade. Vásquez-Ibarra, Rebolledo-Leiva,
Angulo-Meza, González-Araya, & Iriarte (2020)
conducted a critical review, proposed a taxonomy and
proposed future research related to the development
of this methodology. One item developed by these
authors were the widely used of three DEA models:
CCR (Charnes, Cooper, & Rhodes, 1978), BCC
(Banker, Charnes, & Cooper, 1984), SBM (Tone,
2001). In these models, inefficient DMUs can achieve
an efficient point on the frontier reducing their inputs
(in input-oriented models), adding output (in output-
oriented models), or both (in non-oriented models).
This efficient point is a combination of available
efficient units and they not necessarily represent real
units, as pointed out by Safari, Jafarzadeh, & Fathi
(2020). Furthermore, these models provide many
reference units (benchmarks) for inefficient DMUs,
making difficult their implementation in real world,
for example in agricultural sector. Particularly, small
farmers could be one of the most challenge group in
agricultural context, since its limit access to
information and communication technologies (Otter
& Theuvsen, 2014), making difficult to follow
operational practices of many benchmarks.
One way to deal with these issues is the use of
Free Disposable Hull (FDH) approach. FDH relaxes
the convexity assumption of DEA models providing
just one benchmark for each inefficient DMU as a
reference unit. This implies that FDH’ reference set is
more consistent and corresponds with real world
(Deprins, Simar, & Tulkens, 1984; Safari et al.,
2020). Therefore, the use of FDH model can provide
benefit from a practical point of view, since small
inefficient farmers have just one benchmark.
In this context, this study seeks to evaluate the use
of the FDH DEA model into the joint use of LCA and
DEA methodology to evaluate eco-efficiency. To do
this, we employ a case study of 37 Chilean raspberries
producers using the five-step method.
2 METHODS
In this Section, methodological aspects of five-step
CF+DEA method are presented. Briefly, the five-step
method consists of five stages: life cycle inventory,
actual environmental characterization using CF;
operational efficiency performed for each DMU
through DEA; environmental characterization using
the target DMUs from the previous step; and,
comparison of the current and target environmental
impacts.
2.1 Data Collection of Multiple Units
The first step of the five-step CF method is to develop
a Life Cycle Inventory (LCI), i.e. input and output
data for the assessed system are collected.
2.2 Carbon Footprint Assessment
In this step, carbon footprint (CF) assessment for
every DMU is performed. This step represents the
actual environmental characterization of all DMUs
under study. CF is an environmental indicator that
ICORES 2021 - 10th International Conference on Operations Research and Enterprise Systems
186

estimated the overall greenhouse gas (GHG)
emissions associated to a product or activity during
its whole life cycle. The most common GHG
emissions are carbon dioxide (CO
2
), nitrous oxide
(N
2
O) and methane (CH
4
), among several others
(ISO, 2018).
2.3 Data Envelopment Analysis
In this step, the DEA model is performed. As mention
in the Introduction section, the FDH DEA model is
employed in order to determine operational efficiency
of 37 farmers. The selection of this model lies on that
it provides one benchmark for inefficient DMUs,
unlike CCR, BCC or SBM which provides many
efficient units as references which could result
difficult to implement from a practical point of view
for small farmers. Furthermore, benchmarks and
calculation of the target for each inefficient DMU is
conducted.
The five-step CF method employs an input-
oriented DEA model (I Vázquez-Rowe & Iribarren,
2015). In this sense, the FDH model is used
considering operational inputs and outputs, while the
CF is evaluated before and after DEA model.
The mathematical formulation of DEA model is
as follow. Suppose there are n observed DMUs and
assume that each one uses m inputs to produce s
outputs. The FDH model that minimize the inputs of
DMU
0
assuming Variable Returns to Scale (VRS) is
presented from Eqs. (1) to (6).
Min
θ
(1)
Sub
j
ect to
λ
x
θ
x
∀
(2)
λ
y
y
∀ r
(3)
λ
1
(4)
λ
∈ 0,1 ∀ j
(5)
θ
is unconstrained
(6)
Where,
j is the subindex of the set of observed DMUs,
i is the subindex of the inputs,
r is the subindex of the outputs,
θ corresponds to the proportion by which all
inputs can be reduced (efficiency level),
λ
j
is the intensity of the participation of the DMUj
in the construction of the “compound” DMU or
benchmark,
x
ij
is the amount of input i consumed by DMUj,
y
rj
is the amount of output r produced by DMUj,
x
i0
is the amount of input i of DMU
0
,
y
r0
is the amount of output r of DMU
0
In the FDH model, Eq. (1) seeks to minimize the
proportion of inputs used by DMU
0
and it represents
the efficiency of this DMU. Eq. (2) guarantees the
proportional reduction of inputs limited by the
efficient frontiers. Similarly, Eq. (3) prevents that the
outputs of DMU
0
are limited by the efficient frontier.
Eq. (4) (4) stablishes that each DMUs evaluated is
compared with DMUs in similar size and scale. Eq.
(5) and (6) represent the nature of the decision
variables.
2.4 Carbon Footprint using Target
Values
After the target values were obtained for inefficient
DMUs through the FDH model, the CF is calculated
using the new LCI. This step is carried out with the
aim to calculate the potential environmental targets of
inefficient DMUs if they operate under efficient level.
This procedure entails the environmental
benchmarking of the sample.
2.5 Interpretation and Eco-efficiency
Assessment
In this step, the environmental impacts calculated in
step 2 are compared with those obtained in step 4
associated to the targets. In this sense, as stated I
Vázquez-Rowe & Iribarren (2015), “…the
environmental consequences of operational
inefficiencies are revealed…” and the eco-efficiency
can be verified. Furthermore, benchmark (best
practice) provided by FDH model can be used as a
guideline for inefficient farmers.
3 RESULTS AND DISCUSSION
This section presents the results obtained using the
five-step CF+DEA method following the FDH.
3.1 Data Collection of Multiple Units
The data of raspberries producers were obtained from
previous
works of our research group (Fernández
Integration of Life Cycle Assessment and Data Envelopment Analysis using a Free Disposable Hull Approach to Evaluate Farms’
Eco-efficiency
187
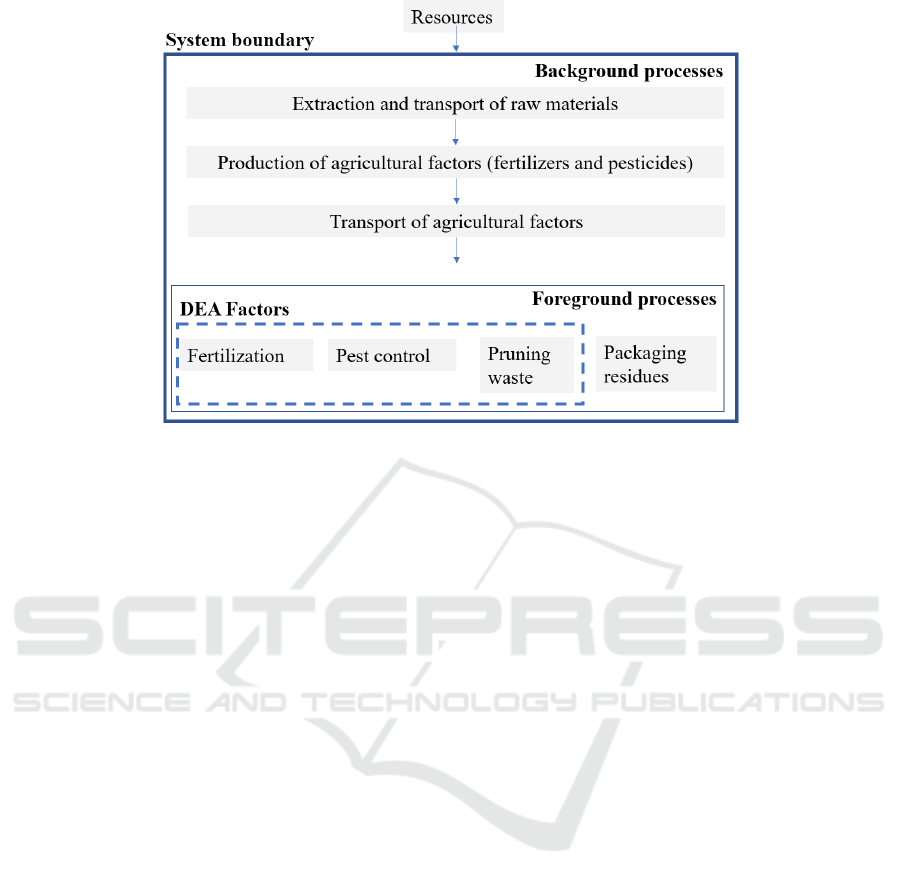
Figure 1: System boundaries and DEA factors employed.
Cáceres, 2018; Rebolledo-Leiva, Angulo-Meza,
Iriarte, González-Araya, & Vásquez-Ibarra, 2019)
and based on Consultora Campo Nova Ltda (2011)
who obtained them through face-to-face interviews.
The study considers 37 farmers of the Maule
Region in Chile, between the 35th and 36th parallel
south. This is one of the main regions where raspberry
is cultivated, totalizing 1216 hectares of this fruit
(Larrañaga et al., 2016).
The agricultural operations are made manually
and consequently, energy is not considered.
Furthermore, agricultural inputs are classified
considering it main function, i.e. fertilizer input
represents all chemical and organics compounds that
contribute to nutrition of the plants. The LCI is
extracted from Rebolledo-Leiva et al. (2019) and
consider as inputs the amount of fertilizers,
pesticides, waste pruning and packaging residues,
while the output is the raspberry production.
3.2 Carbon Footprint Assessment
In the second step, the system boundaries for CF
assessment were setted from cradle-to-gate. This
imply that the agricultural factors evaluated
correspond to fertilizers, pesticides, waste pruning
and packaging residues. Figure 1 presents LCA
factors used in this study. While the functional unit
(FU) is 1 kg of harvested raspberries.
The CF was obtained using the software CCalC2
v1.43 of the University of Manchester (2016)
following the CML 2001 method (Guinée et al.,
2002). Background processes, e.g. extraction of raw
material, fertilizer production, etc., were obtained
mainly from the Ecoinvent v.2.2 database (Wernet et
al., 2016). While the field emissions were calculated
following World Food Guide LCA Database
(Nemecek et al., 2015).
The total amount of CF produced by raspberry
production is on average 4409 kgCO
2-eq
(0.82 kgCO
2-
eq
/ kg of raspberry). Farmer 29 has the highest value
per FU (5.5 kgCO
2-eq
/ kg of raspberry) while farmer
9 has the lowest one (0.1 kgCO
2-eq
/ kg of raspberry).
The agricultural factors with the highest contribution
to the total CF are widely fertilizers (93.4%) followed
by pruning waste (4.2%), and pesticides (2.4%).
Packaging residues contributes only 0.01%.
3.3 Data Envelopment Analysis
Considering the low contribution of packaging
residues to the total CF, the inputs used in the FDH
model are fertilizers, pesticides and pruning waste,
while the output is raspberry production (see Figure
1). The DEA model was performed using software
IBM ILOG CPLEX Optimization Studio v.12.7.1.0.
According to the input oriented FDH model, a
total of 26 DMUs were classified as efficient and 11
DMUs as inefficient. Figure 2 presents efficiency
score for the inefficient DMUs. These DMUs
obtained an average score of 0.6, with the lowest
value of 0.2 (DMU 37) and highest value of 0.9
(DMUs 22, 27 and 30).
Inefficient DMUs produce 65% less raspberries
than the efficient ones, despite they use 17% less
fertilizers, 34% less pesticides and 34% less pruning
ICORES 2021 - 10th International Conference on Operations Research and Enterprise Systems
188
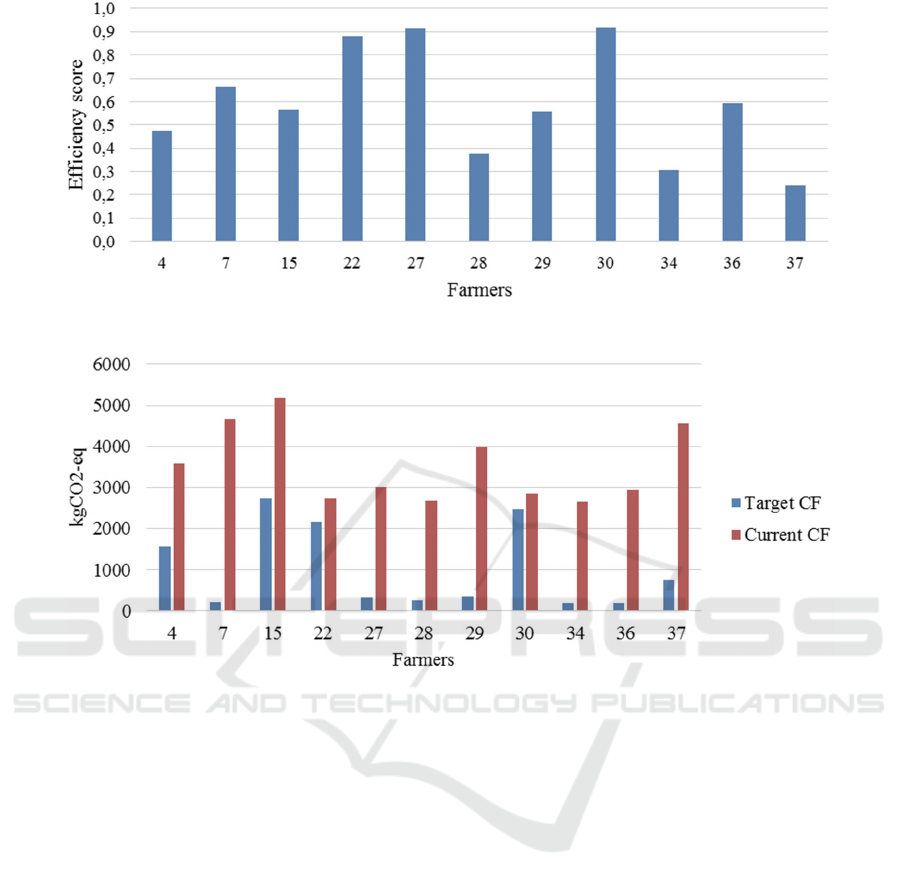
Figure 2: Efficiency score using FDH DEA model.
Figure 3: Current and targets CF level.
waste. This implyes that, even though farmers use
less inputs, their actual operation points is much
fewer than the efficient operating point. Therefore,
they should reduce actual amount of inputs
consumed.
For each inefficient DMU, FDH model provides
one benchmark, making suitable from a practical
point of view, since inefficient farmers should focuss
only on one efficient farm. For instance, farmer 9
(efficient) is benchmark of farmer 36 (inefficient).
Both produce the same amount of raspberries (2500
kg), however, farmer 9 uses 96% less fertilizers, 41%
less pesticides and 73% less pruning waste than
farmer 36. Consequently, if farmer 36 want to
improve their actual performance, it is advisable to
review operational practices of farmer 9.
3.4 Carbon Footprint using Target
Values
This step presents the new CF performed using the
targets provided by DEA model in step 3 for
inefficient DMUs. Figure 3 presents current and
target CF for the 11 inefficient DMUs. As can be
seen, on average inefficient farmers could reduce
their actual level of CF from 3530 kg CO
2-eq
until to
1021 kg CO
2-eq
which represents 71%. The most
dramatic reduction is observed in farmer 7 and 36
(95% and 94%, respectively).
3.5 Interpretation and Eco-efficiency
Assessment
In this last step, eco-efficiency level of the raspberry
farmers is analyzed. Eco-efficiency comprises
operational and environmental aspects. From an
operational point of view, the most critical reduction
observed for inefficient DMUs is related to fertilizers
(71%), followed by pesticides (55%) and prunning
waste (50%). It is importan to observe that fertilizers
are also the main contributor to the current CF level
(see Sub-section 3.2) This operational reduction
implies also an improving of CF performance.
Integration of Life Cycle Assessment and Data Envelopment Analysis using a Free Disposable Hull Approach to Evaluate Farms’
Eco-efficiency
189

On the other hand, the use of FDH model allows
the implementation of best practices easier than the
actual existing DEA models in the LCA+DEA
literature. Since, for the inefficient farmers it is
possible to provide operational factors through
bechmarking of one efficient farmer. Therefore, it is
recommendable that inefficient farms have to follow
the agricultural practices of the efficient farms, which
coul ensure not only achieving the CF targets but also
the final production targets.
4 CONCLUSIONS
This study integrates the FDH aproach into the joint
use of LCA+DEA methodology. The main
contribution is to suitability of FDH model into
LCA+DEA methodology from a practical point of
view in order to provide operational and
environmental targets for inefficient DMUs based on
one benchmarks.
The case study considered 37 chilean raspberries
farmers. The five-step CF+DEA method was
employed. The environmental assesssment (CF) was
evaluated in a cradle-to-gate system boundary
considering fertilizers, pest control (use of
pesticides), prunning waste and plastic waste. While
the DEA assessment considered the FDH model
through input orientation.
A total of 11 farmers were classified as eco-
inefficient, for whose operational and environmental
targets were proposed. On average, the highest
reduction is observed for fertilizers and pesticides.
This reduction implies a decrease of CF level of 71%
for the inefficient farmers.
The use of the FDH model appears as a suitable
DEA model for it use in the LCA+DEA methodology
since it allows to identify one benchmark (best-
practice) for inneficient DMUs. This enable that
inefficient farmers could follow agricultural practices
of the efficient ones in order to reduce operational
levels and CF, while maintaning actual raspberry
production.
Despite its novelty for LCA+DEA methodology,
future works could extend the use of the FDH model
comparing it with others DEA models widely used in
LCA+DEA literature, such as BCC, SBM or CCR.
Moreover, future works can propose further
methodology in order to rank the efficient DMUs and
increase the discrimination of the model.
ACKNOWLEDGEMENTS
Leonardo Vásquez-Ibarra is funded by CONICYT
PFCHA/DOCTORADO BECAS CHILE/2018–
21180701. Ricardo Rebolledo-Leiva gives thanks to
CONICYT–PFCHA/MagísterNacional/2019–
22190179 for financial support. Lidia Angulo-Meza
thanks the CNPq project 409590/2018-5 for financial
support.
REFERENCES
Banker, D., Charnes, A., & Cooper, W. W. (1984). Some
models for estimating technical and scale
innefficiencies in Data Envelopment Analysis.
Managment Science, 1078–1092.
Charnes, A., Cooper, W. W., & Rhodes, E. (1978).
Measuring the efficiency of decision making units.
European Journal of Operational Research, 2(6), 429–
444. https://doi.org/10.1016/0377-2217(78)90138-8
Consultora Campo Nova Ltda. (2011). Diagnóstico y
Propuesta: Acuerdo de Producción Limpia para la
Cadena Comercial de Berries Región del Maule. Talca.
Cooper, W. W., Seiford, L. M., & Tone, K. (2007). Data
Envelopment analysis: A Comprehensive Text with
Models and Applications (Second Edi). Nueva York:
Springer Science+Business Media.
Deprins, D., Simar, L., & Tulkens, H. (1984). Measuring
Labor Inefficiency in Post Offices. In The Performance
of Public Enterprises: Concepts and Measurements.
243–267.
Fernández Cáceres, J. R. (2018). Análisis de ciclo de vida
(ACV) de producción de frambuesas de exportación en
la región del Maule. University of Talca.
Guinée, J., Gorrée, M., Heijungs, R., Huppes, G., Kleijn,
R., de Koning, A., … Udo de Haes, H. (2002).
Handbook on Life Cycle Assessment. Dordrecht:
Kluwer Academic Publishers.
ISO. ISO 14040 - Environmental management - Life cycle
assessment - Principles and framework. , (2006).
ISO. (2018). ISO 14067:2018 Greenhouse gases — Carbon
footprint of products — Requirements and guidelines
for quantification. Geneva, Switzerland.
Larrañaga, P., Osores, M. A., Henríquez, G., Villa, R.,
Woywood, C., Peña, J. C., … González, J. (2016).
Catastro Frutícola. Principales resultados. Región del
Maule. Julio 2016. Retrieved from
http://bibliotecadigital.ciren.cl/handle/123456789/262
05
Lozano, S., Iribarren, D., Moreira, M. T., & Feijoo, G.
(2009). The link between operational efficiency and
environmental impacts. A joint application of Life
Cycle Assessment and Data Envelopment Analysis.
Science of The Total Environment, 407, 1744–1754.
Nemecek, T., Bengoa, X., Lansche, J., Mouron, P.,
Riedener, E., Rossi, V., & Humbert, S. (2015).
Methodological Guidelines for the Life Cycle Inventory
ICORES 2021 - 10th International Conference on Operations Research and Enterprise Systems
190

of Agricultural Products. Version 3.0. World Food LCA
Database (WFLDB). Quantis and Agroscope. Lausanne
and Zurich, Switzerland.
Nikolaou, I. E., & Matrakoukas, S. I. (2016). A framework
to measure eco-efficiency performance of firms
through EMAS reports. Sustainable Production and
Consumption, 8(February), 32–44.
https://doi.org/10.1016/j.spc.2016.06.003
Otter, V., & Theuvsen, L. (2014). ICT and farm
productivity: Evidence from the Chilean agricultural
export sector. Gesellschaft Fur Informatik, 206, 113–
116.
Rebolledo-Leiva, R., Angulo-Meza, L., Iriarte, A., &
González-Araya, M. C. (2017a). Joint carbon footprint
assessment and data envelopment analysis for the
reduction of greenhouse gas emissions in agriculture
production. Science of the Total Environment, 593–594,
36–46. https://doi.org/10.1016/j.scitotenv.2017.03.147
Rebolledo-Leiva, R., Angulo-Meza, L., Iriarte, A.,
González-Araya, M. C., & Vásquez-Ibarra, L. (2019).
Comparing two CF+DEA methods for assessing eco-
efficiency from theoretical and practical points of view.
Science of the Total Environment, 659, 1266–1282.
https://doi.org/10.1016/j.scitotenv.2018.12.296
Rybaczewska-Błażejowska, M., & Gierulski, W. (2018).
Eco-Efficiency Evaluation of Agricultural Production
in the EU-28. Sustainability (Switzerland), 10(12), 1–
21. https://doi.org/10.3390/su10124544
Safari, H., Jafarzadeh, A. H., & Fathi, M. R. (2020).
Evaluation of the branches of Iran Insurance
Corporation based on data envelopment analysis-free
disposal hull in the presence of weight restrictions.
International Journal of Mathematics in Operational
Research, 16(2), 202–216.
https://doi.org/10.1504/IJMOR.2020.105871
Schmidheiny, S., & Stigson, B. (2000). Eco-efficiency:
Creating More Value With Less Impact. In WBCSD:
World Business Council for Sustainable Development.
Ten Raa, T., & Greene, W. H. (2019). The Palgrave
handbook of economic performance analysis. In The
Palgrave Handbook of Economic Performance
Analysis. https://doi.org/10.1007/978-3-030-23727-1
Tone, K. (2001). A slacks-based measure of efficiency in
data envelopment analysis. European Journal of
Operational Research, 130(3), 498–509.
https://doi.org/10.1016/S0377-2217(99)00407-5
University of Manchester. (2016). CCaLC2 v.1.7 Software
and database. Retrieved January 1, 2018, from
www.ccalc.org.uk
Vásquez-Ibarra, L., Rebolledo-Leiva, R., Angulo-Meza, L.,
González-Araya, M. C., & Iriarte, A. (2020). The joint
use of life cycle assessment and data envelopment
analysis methodologies for eco-efficiency assessment:
A critical review, taxonomy and future research.
Science of The Total Environment, 139–538.
https://doi.org/10.1016/j.scitotenv.2020.139538
Vázquez-Rowe, I, & Iribarren, D. (2015). Review of Life-
Cycle Approaches Coupled with Data Envelopment
Analysis: Launching the CFP + DEA Method for
Energy Policy Making. The Scientific World Journal,
2015, 10. https://doi.org/10.1155/2015/813921
Vázquez-Rowe, Ian, Iribarren, D., Moreira, M. T., &
Feijoo, G. (2010). Combined application of life cycle
assessment and data envelopment analysis as a
methodological approach for the assessment of
fisheries. International Journal of Life Cycle
Assessment, 15(3), 272–283.
https://doi.org/10.1007/s11367-010-0154-9
Wernet, G., Bauer, C., Steubing, B., Reinhard, J., Moreno-
Ruiz, E., & Weidema, B. (2016). The ecoinvent
database version 3 (part I): overview and methodology.
International Journal of Life Cycle Assessment, 21(9),
1218–1230. https://doi.org/10.1007/s11367-016-1087-
8
Integration of Life Cycle Assessment and Data Envelopment Analysis using a Free Disposable Hull Approach to Evaluate Farms’
Eco-efficiency
191
