
Comparative Evaluation of Road Traffic Simulators based on Modeler’s
Specifications: An Application to Intermodal Mobility Behaviors
Azise Oumar Diallo
1 a
, Guillaume Lozenguez
1 b
, Arnaud Doniec
1 c
and Ren
´
e Mandiau
2 d
1
CERI Syst
`
emes Num
´
eriques, Institut Mines-T
´
el
´
ecom (IMT) Lille-Douai, Villeneuve d’Ascq, France
2
LAMIH UMR CNRS 8201, Universit
´
e Polytechnique Hauts-de-France, Valenciennes, France
Keywords:
Agent-based Modeling, Traffic Simulator, Intermodality.
Abstract:
Today, large cities and peri-urban areas experience problems in the mobility of their population. Faced with
this problem, decision-makers must have reliable tools to help them to build and evaluate their policies of mo-
bility. Computer simulations especially traffic simulation tools are, therefore, the solution to better understand
(study) the problem and test different resolution scenarios. Unfortunately, there are numerous simulation tools
and the choice can be very difficult for traffic modelers. In this paper, we present, based on a generic method,
a comparison of the most popular traffic simulation tools in two steps: 1) a comparison part using a weighted
system of evaluation criteria to automatically select the candidate simulators. 2) a deeper study of the candi-
date simulators according to a simulation scenario corresponding to the study case. Finally, this paper presents
an application of this method for the selection of a simulator for the study of intermodal mobility behaviors
where MATSIM and SUMO were studied in deeper.
1 INTRODUCTION
Nowadays, transportation is one of the vital needs
of humans in the same way as access to water,
health care, and education. In addition, faced with
the issues of global warming and expensive living,
policymakers are increasingly focused on people’s
transportation systems to provide both economic and
customer-friendly solutions. In order to experiment
with their solutions, decision-makers use most often
traffic simulation tools(Pursula, 1999).
The initial motivation for this work was the study
of the capability to simulate intermodality
1
and to in-
tegrate new behaviors into the simulation. There is
a need to easily add such behaviors in a multimodal
simulation. Fortunately, recent developments in traf-
fic simulation tools allow simulating these kinds of
behaviors.
Modern traffic simulation tools are based on dif-
ferent principles and have two main origins: indus-
a
https://orcid.org/0000-0002-8865-9760
b
https://orcid.org/0000-0001-6875-7702
c
https://orcid.org/0000-0002-3843-6729
d
https://orcid.org/0000-0001-7722-9848
1
Intermodality is usually defined as the capability of us-
ing several transportation modes during the same trip.
trial and academic ones. Industrial simulators (e.g.,
Vissim, Aimsun), developed for commercial purposes,
are generally easier to use and offer user assistance.
However, they are less extensible and offer less fle-
xibility and limit the user to predefined cases. The
second group of simulators comes from research labs
(Lopez et al., 2018; Horni et al., 2016; Mandiau et al.,
2008). Developed as part of research work, these so-
lutions are usually less complete and not easy to use
for an uninitiated user.
Simulation tools offer different levels of traf-
fic modeling usually classified into three following
groups: macroscopic, microscopic, and mesoscopic.
In macroscopic models, vehicle flow is assimilated to
the runoff of a fluid in a pipe and modeled through
the equations of fluid mechanics. In contrast, in mi-
croscopic and mesoscopic approaches, each actor of
the traffic is respectively considered individually and
in small homogeneous groups. These simulations are
implemented through a behavioral approach: road
traffic is considered as an emergent phenomenon re-
sulting from interactions between road users modeled
as autonomous agents (or group) and a realistically
modeled infrastructure. Some works have even inves-
tigated the integration of these different levels inside
a same agent-based simulation (Mathieu et al., 2018).
In light of this diversity of traffic simulation tools,
Diallo, A., Lozenguez, G., Doniec, A. and Mandiau, R.
Comparative Evaluation of Road Traffic Simulators based on Modeler’s Specifications: An Application to Intermodal Mobility Behaviors.
DOI: 10.5220/0010238302650272
In Proceedings of the 13th International Conference on Agents and Artificial Intelligence (ICAART 2021) - Volume 1, pages 265-272
ISBN: 978-989-758-484-8
Copyright
c
2021 by SCITEPRESS – Science and Technology Publications, Lda. All rights reserved
265

the modeler
2
can have some difficulties in choosing
the appropriate simulator that meets his/her specifi-
cations or the requirements of a project. Therefore,
in this paper, we propose a simple method to quickly
compare different simulation tools as a first step of a
selection process. This comparison is based on fun-
damental criteria and those relating to the targeted
project. As a second step, the two selected solutions
SUMO and MATSim are investigated regarding an in-
termodal transport scenario.
The remainder of the paper is organized as fol-
lows. Section 2 presents the goal of this study and
provides an overview of related works on the compar-
ison of traffic simulators. Then, Section 3 describes
the approach used to compare and select simulators.
Section 4 presents the comparison results of SUMO
and MATSim. Finally, Section 5 concludes the paper.
2 PROBLEM STATEMENT
Comparison studies in literature of traffic simulators
can be split into two groups mainly depending on the
method used. These two approaches are described in
the two following subsections.
2.1 Qualitative Methods of Comparison
Qualitative approaches are based on some comparison
criteria in order to see the ability of software to meet
these criteria.
Ejercito et al. (Ejercito et al., 2017) performed
a comparison of traffic simulators in order to choose
the most reliable and suitable to allow researchers to
simulate road traffic in the EDSA (Epifanio de los
Santos Avenue) in Manila (Philippines). The simu-
lators studied were MATSim, SUMO, AIMSUN, and
PTV VISSIM. Several criteria were considered in this
work such as nature of software (e.g., free, open-
source, commercial), portability operating systems,
creation of road traffic networks and associated ve-
hicle models, and graphical simulation and quality
of graphical representation. The authors only focus
on how the different functionalities in the simulators
are defined based on the comparison criteria. There-
fore, conclusions drawn by the authors are not pre-
cise enough to guide the choice of a given modeler in
the selection of a traffic simulator for another specific
case.
Saidallah et al. (Saidallah et al., 2016) and Ghar-
iani et al. (Ghariani et al., 2014) start with a pre-
sentation of the simulators studied by highlighting
2
In the following, we will use the term modeler to des-
ignate a person who uses a traffic simulation software.
their different characteristics. Then, they perform a
comparative study (still qualitative) based on a set
of selected criteria such as general characteristics
(e.g., software category), integration of transit com-
ponents (e.g., roads, stops), and simulation models
(microscopic or macroscopic). The work in (Ghariani
et al., 2014) focused on the study of seven simulators
(SUMO, TRANSMIS, ARCHISIM, AIMSUN, Param-
ics, VISSIM, and CORSIM) according to their ability
to simulate public transport. The study carried out
in (Saidallah et al., 2016) focused on four simulators
(MATSim, SimTraffic, MITSIMLab, and TransMod-
eler) in addition to the seven previously mentioned.
The qualitative comparison framework proposed
by these authors (Saidallah et al., 2016; Ghariani
et al., 2014) is quite explicit. Through the summary
table, one is briefed about the functionalities that sim-
ulators can satisfy. However, this information is only
limited to the functionalities defined by the authors.
Moreover, some features have not been studied such
as portability, generation of traffic demand, and soft-
ware scalability.
The main drawback of the above-mentioned ap-
proaches (qualitative) is that they are subjective since
the evaluation criteria are too specific in most cases
to the project or to the modelers (authors). The re-
sults of the study just indicate whether the simulator
can meet these criteria or not. Thereby, conclusions
of these studies are general and difficult to tailor to a
particular modeler’s needs. Furthermore, a quantita-
tive evaluation of each simulator (as described in the
next section) should be added based on the conclu-
sions drawn from the qualitative comparison.
2.2 Quantitative Approaches of
Comparison
The quantitative approaches aim to supplement the
qualitative methods by proposing a notation to the
simulators studied. To our knowledge, only one study
has focused on this type of comparison by using a sys-
tem of classification to compare AIMSUN and VIS-
SIM(Xiao et al., 2005). The authors proposed in ad-
dition a weighting system to give a mark to each sim-
ulator. Unlike the studies above mentioned, the eval-
uation criteria are both qualitative (e.g., functional
capabilities and input/output features) and quantita-
tive (e.g., accuracy of the simulator). This system
takes into account the modeler’s priority by assigning
weights to each evaluation criterion. One of the main
limitations of this approach is the qualitative evalua-
tion performed by the authors. The conclusions drawn
are not explicit enough as in (Saidallah et al., 2016)
and (Ghariani et al., 2014). In addition, some criteria
ICAART 2021 - 13th International Conference on Agents and Artificial Intelligence
266

designated by the authors as quantitative such as the
accuracy of the simulator and the setting time are dif-
ficult to assess without studying the simulators a little
more in-depth. Finally, the system of classification is
quite difficult to reproduce and extend to other simu-
lators.
In general, the choice of the simulator depends on
some criteria (qualitative and/or quantitative) as spe-
cified in the works above mentioned. It will be in-
terested to have a classification system that will al-
low the modeler to perform a quick selection without
studying the simulators a little more in-depth. The
aim is to save time by avoiding in-depth study of sim-
ulators that are not likely to respond to the case study.
Considering the limitations of existing studies, it is,
therefore, necessary to propose a more intuitive eval-
uation approach to guide modelers in the choice of
their traffic simulation tools.
3 CRITERIA FOR EVALUATING
EXISTING PLATFORMS
This section describes the first step of our comparison
approach. It consists first in defining the comparison
criteria. Then, the most popular simulators are evalu-
ated against their ability to meet the comparison cri-
teria defined by the modeler. At the end of this step, a
restricted list of simulators is carried out for a deeper
study.
3.1 Definition of Our Criteria
We have grouped the comparison criteria into five cat-
egories: 1) Nature of software, 2) Creation of Road
Network and Transport Demand, 3) Simulation
realism, 4) Documentation and GUI, 5) Modeler’s
specifications.
A coefficient is assigned to each category of cri-
teria defining its importance for the modeler. We
propose a scale from 1-not important at all to 5-
highly mandatory. Then, a mark (mark
cat
) values
each simulator for each category of criteria. This
mark assesses the simulator’s ability to meet the crite-
ria/functionality in the category. Afterward, the score
ScoreSim assigned to a simulator is computed as a
weighted average (with mark
cat
value bounded to 10).
ScoreSim =
∑
cat∈[1..n]
mark
cat
× coeff
cat
∑
cat∈[1..n]
coeff
cat
(1)
with coeff
cat
corresponding to the coefficient assigned
to the category of criteria cat according to the mod-
eler’s specifications and n the number of the category
of criteria cat.
This approach allows the modeler to quickly eval-
uate several simulation tools using the same formula.
Thus, he/she can explore the functionalities of sev-
eral types of simulators at the same time. Moreover,
the modeler can designate a criterion or functionality
as “redhibitory”. Thus, any simulator that does not
satisfy this criterion will be systematically eliminated
for the rest of the study. A list of the most popular
simulators used in this study is described in the next
subsection.
3.2 Studied Traffic Simulators
Several simulation software have been considered to
test the comparison approach. They can be organized
into two groups defined as follows:
1. Microscopic Agent-based Road Transport
Simulators. These are specific simulation
platforms (intended only) for road traffic. The
simulators chosen are: MATSim (Multi-Agent
Transport Simulation Toolkit) - Version 0.10.1
(Horni et al., 2016), SUMO (Simulation of Urban
Mobility) - Version 1.0.1 (Lopez et al., 2018),
Aimsun Next (Advanced Interactive Microscopic
Simulator for Urban and Nonurban networks)
- Version 8.1.4
3
, and PTV Vissim (Planung
Transport Verkehr AG Verkehr In St
¨
adten -
SIMulationsmodell) - Version 10
4
.
2. Generic Multi-Agent System (MAS) Simula-
tors. Being generic, they can be adapted for mod-
eling several systems including road traffic. Our
choice fell on GAMA (GIS Agent-based Modeling
Architecture) - Version 1.8 (Grignard et al., 2013).
Although the above-mentioned simulation software
are not the only ones in the literature, they are those
which are the most used in their respective fields.
3.3 Evaluation based on Comparison
Criteria
Considering our case study which consists in know-
ing whether or not there is a suitable traffic simulator
to simulate intermodality policies, we have assigned
coefficients to each category of criteria as presented
in Table 1.
The results of the comparative study of simulation
software are presented in Tables 2 to 6 corresponding
to each category of criteria.
3
www.aimsun.com/aimsun-next (Oct. 25th 2018).
4
vision-traffic.ptvgroup.com/fr/accueil (Oct. 25th
2018).
Comparative Evaluation of Road Traffic Simulators based on Modeler’s Specifications: An Application to Intermodal Mobility Behaviors
267

Table 1: Assigning coefficients to criteria categories based
on the modeler’s priorities.
Category of criteria Coefficient
(Cat. 1) Nature of the software 4
(Cat. 2) Creation of road network and transport demand 5
(Cat. 3) Quality of visualization of the simulation 3
(Cat. 4) Documentation and user’s interface 4
(Cat. 5) Modeler’s specifications 5
Total of coefficient 21
Table 2: Evaluation of simulators according to the nature of
the software (Cat. 1).
Criterion
Simulator Open
source
Free Dev.
team
Single
acqu.
Win. Linux Mac
OS
Mark
MATSim X X X X X X X 10
SUMO X X X X X X X 10
Aimsun Next X X X X X 7
PTV Vissim X X X 4
GAMA X X X X X X X 10
Table 3: Evaluation of simulators according to the possibi-
lity of creation the road network and transport demand (Cat.
2).
Criterion
Simulator Visual
tool inte-
grated
5
Network
from
OSM
Transport
demand
PT net.
and
sched.
Mark
MATSim X X X 8
SUMO X X X X 10
Aimsun Next X X X ?
6
8
PTV Vissim X X X ? 8
GAMA X X 5
Table 4: Evaluation of simulators according to the quality
of visualization of the simulation (Cat. 3).
Criterion
Simulator 2D 3D Realism
7
Few memory
8
Mark
MATSim !
9
X 3
SUMO X X 5
Aimsun Next X X X X 10
PTV Vissim X X X X 10
GAMA X X X 8
5
Some simulators do not allow the creation of the road
network directly. In this case, one needs to use other soft-
ware for creating road traffic (details in Section 4).
6
Commercial software evaluation versions did not allow
us to test this functionality.
7
The criterion of realism strongly depends on the expec-
tations of the modeler. It can be decomposed at the macro-
scopic and microscopic levels. At the macroscopic level,
realism relates to the physical quantities observed: density,
Table 5: Evaluation of the simulators according to the qual-
ity of the documentation and the GUI (Cat. 4).
Criterion
Simulator On
line
PDF Forum Confe-
rence
Commu-
nity
Trai-
ning
GUI Mark
MATSim X X X X X X X 10
SUMO X X X X X 7
Aimsun Next X X X X 6
PTV Vissim X X X X X X 9
GAMA X X X X X X 9
3.4 Short Listing of the Solutions
Table 7 proposes an overview through the five cate-
gories. It makes it clear that no simulator is ideal to
meet all the needs and requirements of the modeler.
The simulators dedicated to traffic, outperform
our test with a score of up to 7.4. The delimitation
between commercial and OpenSource software is also
clear. Commercial software are well integrated into
the GIS solution to build and set up simulation and
provide qualitative GUI and simulation view. How-
ever, those solutions remain obscure considering the
possibility to enter into the simulation source code
and provide customized behaviors and simulation.
The simulators chosen to be more deeply inves-
tigated by implementing intermodality scenarios are
MATSim and SUMO. For this work, we were interes-
ted in the intermodal routing module in particular in
the cost function of the modal choice (intermodal) im-
plemented by these two simulators.
4 FOCUSING ON INTERMODAL
ROUTING PROBLEM FOR
MATSim vs SUMO
This second step of comparison consists in studying
more deeply the selected simulators on a road traffic
scenario. To compare the two simulation tools with
respect to the intermodal routing problem, the em-
phasis will put on the four aspects: 1) creation of a
complete multimodal transportation network, 2) def-
inition of the availability of transportation modes, 3)
flow, average speed, etc. At the microscopic level, the real-
ism relates to the observable behavior of users (car driver,
pedestrian) and the way they move (walking, car steering).
8
It is assumed that a need of less than 16 GB of RAM is
sufficient for a 3D display and realistic effects.
9
MATSim does not allow the visualize simula-
tion results. Another tool such Simunto VIA (see
https://www.simunto.com/via/) is used for this.
ICAART 2021 - 13th International Conference on Agents and Artificial Intelligence
268
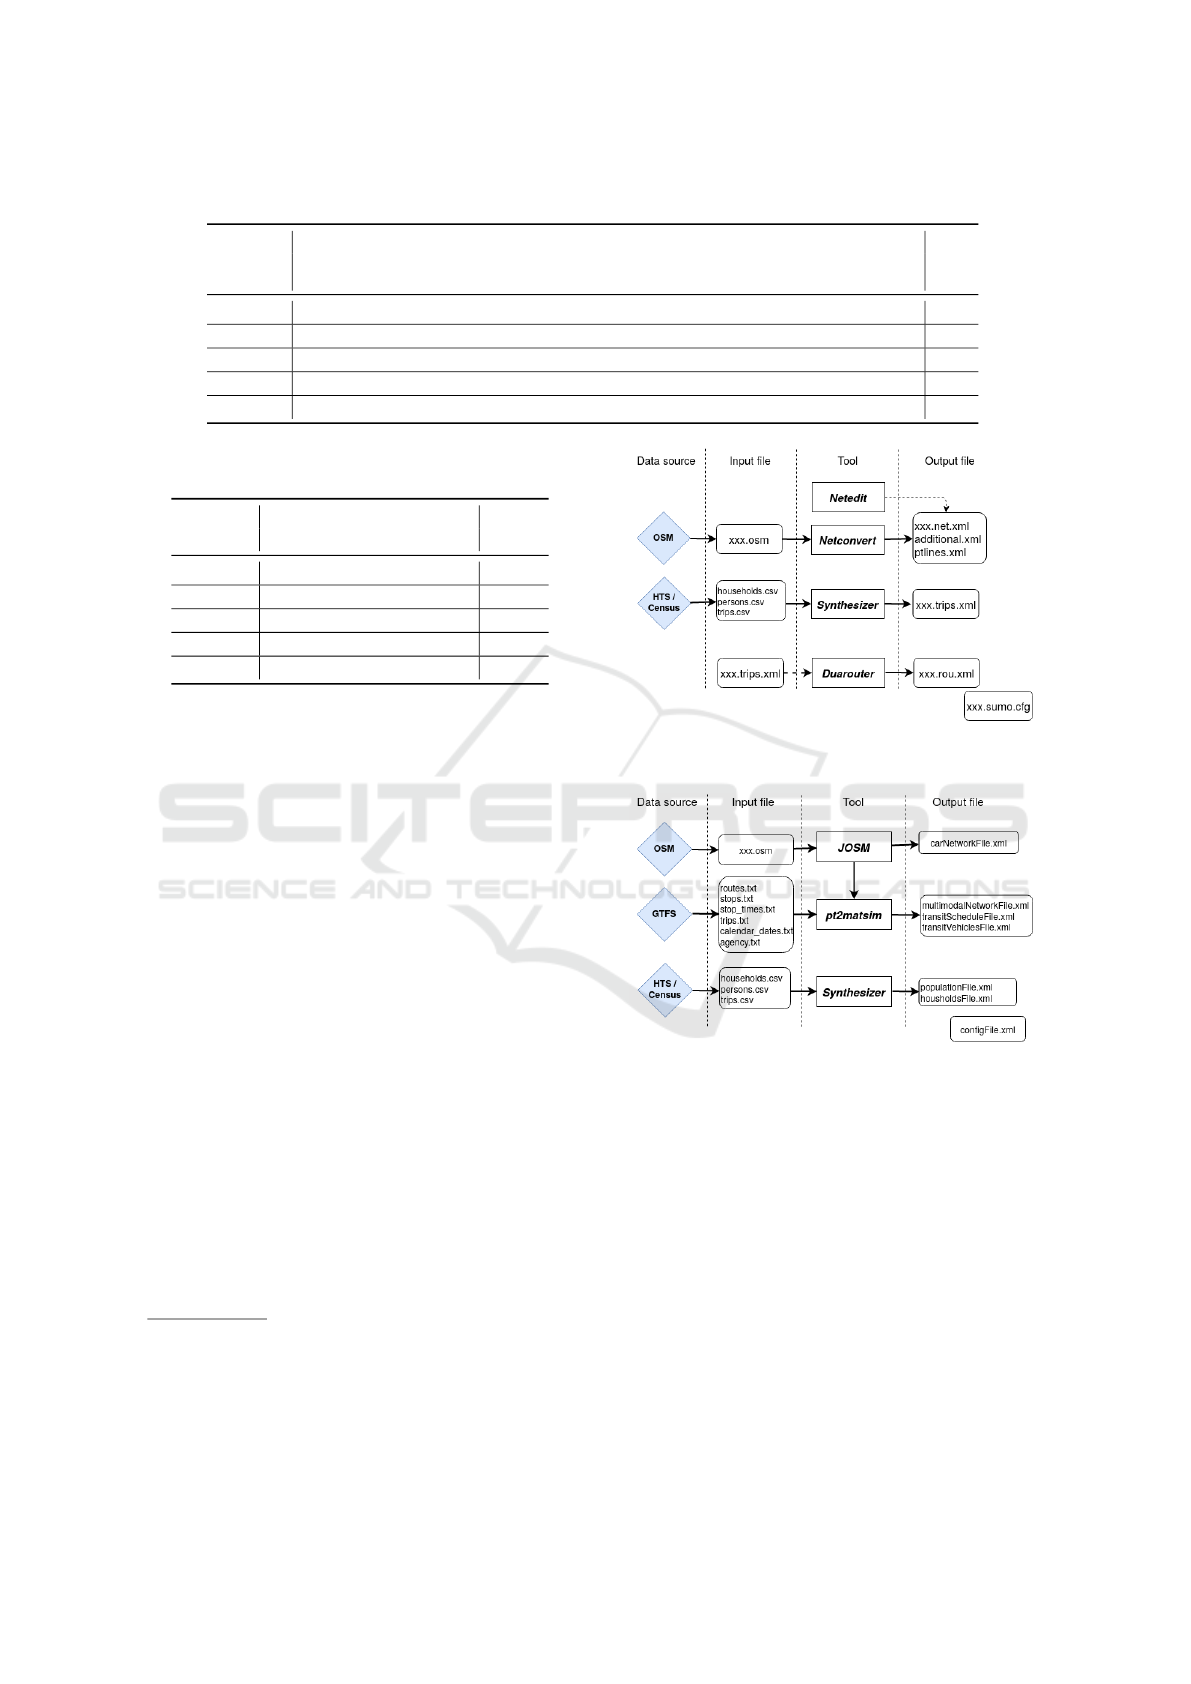
Table 6: Evaluation of simulators according to the modeler’s specifications (Cat. 5).
Criterion
Simulator Model mi-
cro./meso.
Scaling User and mode
characteristics
Statistics
output
Intermodality Calibration Dynamic
behaviors
API Source code
access
Mark
MATSim X X X X X X X 8
SUMO X X X X X X X X 9
Aimsun Next X X X X X X ? 7
PTV Vissim X X X X X X ? 7
GAMA X X X X 4
Table 7: Comparison of simulators according to chosen cri-
teria (first step).
Category of criteria
Simulator Cat.1 Cat.2 Cat.3 Cat.4 Cat.5 ScoreSim
SUMO 10 10 5 7 9 8.48
MATSim 10 8 3 10 8 8.05
Aimsun Next 7 8 10 6 7 7.48
PTV Vissim 4 8 10 9 7 7.48
GAMA 10 5 8 9 4 6.90
intermodal routing algorithm (the cost function of the
modal choice), 4) degree of difficulty in the definition
of new intermodal behaviors.
After a description of traffic simulation scenario
generation in MATSim and SUMO in the first subsec-
tion, the two other subsections detail these different
points for each simulator.
4.1 Traffic Simulation Scenario
Generation Framework
The use of both SUMO and MATsim relies on several
tools to generate simulation configurations from clas-
sical data format. Figures 1 and 2 present a global
framework of the generation of a traffic scenario from
OpenStreetMap (OSM)
10
and mobility data (usually
the Households Travel Survey (HTS) and/or the Cen-
sus of the population) in SUMO and MATSim respec-
tively.
The road network is generally produced from
the OSM data of the study area extracted from
OpenStreetMap. Moreover, it is possible to include
GTFS
11
data, allowing a better description for the
public transport supply in MATSim context. Details
on the network generation tools are presented in the
subsections dedicated to each simulator.
10
OpenStreetMap is an open data platform that
provides map information of roads, trails, etc.:
https:/https://www.openstreetmap.org/about
11
General Transit Feed Specification (GTFS) is a stan-
dard for transit schedules and geographic information:
https://gtfs.org/
Figure 1: General process to create traffic scenarios from
OSM and mobility data (HTS/Census) in SUMO.
Figure 2: General process to create traffic scenarios from
OSM and mobility data (HTS/Census) in MATSim.
The initial transport demand is generally created
from a synthetic agent population synthesizer. This
population reflects the mobility data, for example
from household travel surveys (HTS) and/or census
data. It should be noted here that this population is
not necessarily specific to the format of the simula-
tor. Therefore, from the mobility information of the
population generated, it is possible to create a traf-
fic demand in the simulator format (xxx.trips.xml in
SUMO and populationFile.xml in MATSim for exam-
ple). This demand can then be directly simulated
without defining travel routes. On the other hand,
it takes a long time with regard to the routing time.
Thus, the tool Duarouter allows creating a traffic de-
Comparative Evaluation of Road Traffic Simulators based on Modeler’s Specifications: An Application to Intermodal Mobility Behaviors
269

mand (xxx.rou.xml) with cleaned routes which can be
easily simulated by SUMO.
4.2 Intermodal Routing in SUMO
To perform intermodal routing, we need a multi-
modal network, the availability of several transporta-
tion modes to combine them, and the definition of a
cost function of the modal choice. These different
steps will be studied for each of the two simulators.
4.2.1 Creation of a Complete Multimodal
Transportation Network
The multimodal network is well modeled in SUMO.
Netconvert creates the road network for SUMO from
OpenStreetMap data. Netedit allows corrections on
the network created because some information may
be incorrect from the OpenStreetMap site, such as the
use of a traffic light instead of priority stop at an inter-
section. Each specific lane to a category of transporta-
tion mode can be modeled. SUMO also allows the co-
habitation of several transportation modes in the same
lane such as cars, buses, and motorcycles. Interac-
tions between pedestrians and motorists are also pos-
sible at zebra crossing at intersections. Traffic control
systems like traffic lights are also taken into account
in SUMO.
The public transport network is generated from
OSM data. Thus, the network only includes the stops
and lines listed on OpenStreetMap. Information on
transit schedule and the types of vehicles assigned to
each line are not taken into account. However, the
tool Netedit aims to complete and to modify the road
network generated from OSM data. This allows to
create a model of the network close to reality and to
add news elements of the road infrastructure to it.
4.2.2 Availability of Transportation Modes
The definition of the transportation modes available
or accessible by the traveler is essential to properly
model an intermodal transport supply. For example,
it would not be possible to use a bicycle or a car and
then take the train if the traveler does not know these
modes.
SUMO takes into account the transportation
modes available in an intermodal trip through the
modes attribute in the personTrip module, which will
contain the name of these modes. For example,
modes=“car public” means that the agent can use
the car, or public transport or a combination of both.
Walking is assumed to be available to all agents while
the other modes need to be supplied explicitly.
4.2.3 Cost Function of the Modal Choice
After defining the available transportation modes, the
modal choice cost function is used to determine the
mode(s) of transport to use to perform the trip. The
choice of one mode or the combination of modes
is generally based on several characteristics such as
the cost, the travel time, and some user’s socio-
demographic attributes such as age and social profes-
sional categories.
Currently, SUMO only takes into account the
travel time of the transportation modes. Thus, the
mode(s) chosen is/are determined by the one/those
which has/have the shortest travel time according to
the route calculated by Duarouter. To calculate the
travel time, Duarouter uses a shortest-path routing
algorithm such as Djikstra or A
∗
. The modeler can
choose the routing algorithm that suits him/her best.
The travel time of an edge is generally calculated in
the free-flow traffic according to the maximum speed
of the mode (car, bike, walking) and the speed limit
of the edge. Travel times by public transport are cal-
culated from the time of departure, the waiting time,
and the difference in intermediate times between suc-
cessive stops.
4.2.4 Difficulty for New Intermodal Behaviors
In SUMO, a person can be in three states during
his/her trip: riding, walking, or stopping. The rid-
ing state, through the attribute modes of the person-
Trip module, allows the use of multiple transporta-
tion modes to perform a trip. Therefore, it is possible
to define intermodal mobility behavior between the
origin and destination points (edges) by defining the
transportation modes available for an agent. However,
the availability of transportation modes is not the only
factor influencing the modal choice. The human di-
mension and the transport supply should be taken into
account. Such modifications cannot be carried out by
simply customizing the attributes of agents and the
transportation modes. Therefore, some adjustments
or additions to the source code may be necessary to
consider new intermodal mobility behaviors. How-
ever, the complexity of the SUMO source code makes
this operation very tedious.
4.3 Intermodal Routing in MATSim
This subsection presents the steps required to perform
intermodal routing in MATSim as presented above.
ICAART 2021 - 13th International Conference on Agents and Artificial Intelligence
270

Table 8: Main characteristics of agent, network and modal choice in SUMO and MATSim.
Agent’s behaviors Network Modal choice
Simulator riding walking stopping in
activity
crossing
interaction
multimodal transit
schedule
control
system
utility
function
multi-
criteria
trip-
based
tour-
based
shortest-
path
SUMO X X X X X X X X
MATSim X X X X X X X X X X X
4.3.1 Creation of a Complete Multimodal
Transportation Network
The multimodal network for MATSim is generated
with the pt2matsim module (Poletti et al., 2017).
Therefore, cars and buses can interact in the same
link. However, there is no dedicated lane for pedes-
trians and therefore no interactions between drivers
and pedestrians. To do this, pedestrians are tele-
ported between the origin and destination points at
a certain time duration normally corresponding to
their walking times. Some traffic control systems like
traffic lights are not modeled in MATSim. Adjust-
ments such as the definition of free speed and the re-
moving/adding link are possible via the tool JOSM
12
through an additional plugin (Neumann and Zilske,
2018). It should be noted that this plugin allows to
create a unimodal transportation network for private
cars.
4.3.2 Availability of Transportation Modes
MATSim takes into account the availability of trans-
portation modes when an agent performs a trip. Walk-
ing is still possible (teleportation in this case). The
modes must be defined either globally (parameter
mainMode in the QSim module) or individually for
each agent (mode attribute of the leg parameter in the
plan of a person). If a mode is not defined in QSim,
the agent using this mode will be teleported.
4.3.3 Cost function of the Modal Choice
To understand the modal choice cost function, it is
necessary to have an overview on the overall function-
ing of MATSim. Figure 3 presents the general MAT-
Sim simulation cycle.
Figure 3: MATSim simulation cycle (ref. (Horni et al.,
2016)).
The choice of transportation mode is performed in the
Decision making phase. This phase assigns a score to
12
https://josm.openstreetmap.de/
all plans of an agent in each simulation cycle (itera-
tion) based on a utility function. The score of a plan
depends on the utility of the activities carried out and
the utility for traveling (typically negative) to those
activities based on the transportation mode used. To
improve the score of a plan, several replanning strate-
gies are possible: changing the route, changing the
transportation mode or changing the starting time of
the activity. These strategies are configurable by the
modeler who can choose the percentage of agents that
will change plans between two iterations. In this case
study, we are interested in changing the transportation
mode. Currently, the utility function of the transporta-
tion mode is based on a single factor, the travel time
which is calculated at each end of the cycle. MATSim
is also based on shortest-path routing algorithms such
as Dijkstra to estimate travel times during the simula-
tion.
4.3.4 Difficulty in the Definition of New
Intermodal Behaviors
MATSim allows to simulate the daily movements of
a given population including commutes, leisure trip,
etc. Each agent is modeled taking into account his/her
capacity (e.g., age and possession of a driving li-
cense) to use a given transportation mode. The modal
choice is based on a utility function that takes into
account the human dimension. Thus, by customiz-
ing some attributes/parameters of utility function such
as marginal utility of money and marginal utility of
travel time, it is possible to reproduce certain basic
intermodality behaviors. On the other hand, to define
new behaviors it is necessary to modify some func-
tionalities in the source code. Fortunately, these func-
tionalities are modularly designed and MATSim offers
a lot of flexibility in the modification of its modules.
4.4 Discussion
Table 8 summarizes our analysis (agents, network and
modal choice). The multimodal network of SUMO is
better modeled than in MATSim. It should be noted at
this level the difficulty of correcting the SUMO mul-
timodal network for larger study areas. This can take
a long time to work without being sure of the final re-
sult. Li et al. (Li et al., 2018) showed, for example,
flow problems at intersections where vehicles could
Comparative Evaluation of Road Traffic Simulators based on Modeler’s Specifications: An Application to Intermodal Mobility Behaviors
271

get stuck without entering the roundabout, thus caus-
ing unrealistic congestions. Taking GTFS data into
account, MATSim multimodal network offers a more
realistic public transport supply. Integration of GTFS
data into SUMO are still in progress.
MATSim, thanks to its activity and agent-based ap-
proach, allows better modeling intermodal mobility
behaviors by taking into account, for example, the trip
purpose, the chains of daily activities, and some at-
tributes of the user such as car availability. The modal
choice is also based on a utility function that can con-
sider several criteria such as travel time and cost. This
choice can be performed upstream of the simulation
through a pairing with a discrete choice model (H
¨
orl
et al., 2019). However, due to a high abstraction level,
MATSim does not simulate microscopic interaction as
the pedestrian crossing. SUMO takes advantage if the
studies focus on a specific multimodal area such as
a town square with a train station, buses, bikes, car
parking plot. In addition, through the MATSim loop,
it is possible to better assess the travel behavior of
agents who, thanks to replanning, can modify their
habits. This is quite interesting because one can imag-
ine new users learning to define the routes as they
discover the road network and the state of the traf-
fic. SUMO also has an iteration module (dua-iterate),
but it only relies on travel times to make the choice of
transportation mode.
5 CONCLUSION
In this paper we evaluated different simulation plat-
forms with the aim of choosing the most suitable to
simulate intermodality policies. The paper first pre-
sented a state of the art of traffic simulators compar-
ison. These works can be divided into two groups
depending on the evaluation method used: qualitative
or quantitative. Based on these works, we proposed a
new comparison approach that is both qualitative and
quantitative and which takes into account criteria spe-
cific to the modeler. It consists first in evaluating the
simulators on their ability to meet the evaluation crite-
ria. From this step, a shortlist is retained for a deeper
study. Finally, the paper presented a case of study
where we evaluated five simulators: four specific to
traffic and one generic. We retained SUMO and MAT-
Sim and compared their capabilities to simulate the
intermodal mobility behaviors of a given population.
MATSim was selected as the most appropriate simula-
tion tool to reproduce intermodal mobility behaviors
on large scale.
As future works, we plan to focus our studies on
MATSim, working on embedding an intermodal mode
choice module. The aim will be to estimate the pa-
rameters of this model from actual mobility data such
as HTS and then to implement it inside MATSim.
REFERENCES
Ejercito, P. M., Nebrija, K. G. E., Feria, R. P., and Lara-
Figueroa, L. L. (2017). Traffic simulation software
review. In 8th Int. Conf. on Information, Intelligence,
Systems & Applications (IISA), pages 1–4.
Ghariani, N., Elkosantini, S., Darmoul, S., and Said, L. B.
(2014). A survey of simulation platforms for the
assessment of public transport control systems. In
14th Int. Conf. on Advanced Logistics and Transport
(ICALT), pages 85–90.
Grignard, A., Taillandier, P., Gaudou, B., Vo, D. A., Huynh,
N. Q., and Drogoul, A. (2013). Gama 1.6: Advancing
the art of complex agent-based modeling and simu-
lation. In PRIMA: Principles and Practice of Multi-
Agent Systems, pages 117–131.
H
¨
orl, S., Bala
´
c, M., and Axhausen, K. W. (2019). Pairing
discrete mode choice models and agent-based trans-
port simulation with matsim. In 2019 TRB Annual
Meeting Online.
Horni, A., Nagel, K., and Axhausen, K., editors (2016).
Multi-Agent Transport Simulation MATSim. Ubiquity
Press, London.
Li, J., Doniec, A., Boonaert, J., and Lozenguez, G. (2018).
Which traffic simulator is suitable for customized be-
haviors in multi-modal scenarios. In 21st Int. Conf.
on Intelligent Transportation Systems (ITSC), pages
3791–3796.
Lopez, P. A., Behrisch, M., Bieker-Walz, L., Erdmann, J.,
Fl
¨
otter
¨
od, Y.-P., Hilbrich, R., L
¨
ucken, L., Rummel, J.,
Wagner, P., and Wießner, E. (2018). Microscopic traf-
fic simulation using sumo. In 21st IEEE Int. Conf. on
Intelligent Transportation Systems (ITSC).
Mandiau, R., Champion, A., Auberlet, J., Espi
´
e, S., and
Kolski, C. (2008). Behaviour based on decision matri-
ces for a coordination between agents in a urban traffic
simulation. Appl. Intell., 28(2):121–138.
Mathieu, P., Morvan, G., and Picault, S. (2018). Multi-level
agent-based simulations: Four design patterns. Simul.
Model. Pract. Theory, 83:51–64.
Neumann, A. and Zilske, M. (2018). MATSim JOSMNet-
work Editor. Technische Universit
¨
at Berlin.
Poletti, F., B
¨
osch, P. M., Ciari, F., and Axhausen, K. W.
(2017). Public transit route mapping for large-scale
multimodal networks. ISPRS International Journal of
Geo-Information, 6(9):268.
Pursula, M. (1999). Simulation of traffic systems-an
overview. Journal of geographic information and de-
cision analysis, 3(1):1–8.
Saidallah, M., El Fergougui, A., and Elalaoui, A. E. (2016).
A comparative study of urban road traffic simulators.
In MATEC Web of Conferences, Vol. 81. EDP Sci-
ences.
Xiao, H., Ambadipudi, R., Hourdakis, J., and Michalopou-
los, P. (2005). Methodology for selecting microscopic
simulators: Comparative evaluation of aimsun and
vissim. Technical report, Intelligent Transportation
Systems Institute, University of Minnesota.
ICAART 2021 - 13th International Conference on Agents and Artificial Intelligence
272
