
Outlier Detection in Network Traffic Monitoring
Marcin Michalak
a
, Łukasz Wawrowski
b
, Marek Sikora
c
, Rafał Kurianowicz
d
,
Artur Kozłowski
e
and Andrzej Białas
f
Research Network Łukasiewicz, Institute of Innovative Technologies EMAG, ul. Leopolda 31, 40–189 Katowice, Poland
Keywords:
Anomaly Detection, Network Traffic Monitoring, Outlier Analysis, Data Mining.
Abstract:
Network traffic monitoring becomes, year by year, an increasingly more important branch of network infras-
tructure maintenance. There exist many dedicated tools for on-line network traffic monitoring that can defend
the typical (and known) types of attacks by blocking some parts of the traffic immediately. However, there may
occur some yet unknown risks in network traffic whose statistical description should be reflected as slow-in-
time changing characteristics. Such non-rapidly changing variable values probably should not be detectable by
on–line tools. Still, it is possible to detect these changes with the data mining method. In the paper the popular
anomaly detection methods with the application of the moving window procedure are presented as one of the
approaches for anomaly (outlier) detection in network traffic monitoring. The paper presents results obtained
on the real outer traffic data, collected in the Institute.
1 INTRODUCTION
Security is a very important aspect in many fields of
daily life, starting from building constructions (dur-
ing the both phases: development and exploitation),
through travelling (by plane, by train etc.) and many
more. As the Internet and Internet technologies be-
come more and more essential parts of our lives, it is
also critical to assure the safety and security in net-
work traffic.
There are plenty of tools dedicated to network traf-
fic monitoring (they are presented in Section 4) that
operate in real–time conditions. However, it is also
important to track low frequency changes in the traf-
fic.
The paper presents an anomaly detection approach
for finding anomalies in the network traffic monitoring
data, which deals with small dynamics. It is impor-
tant to note that not each detected anomaly must be a
dangerous situation. However, such results should be
presented to a network security officer for further in-
vestigation that will result in a final decision whether
a
https://orcid.org/0000-0001-9979-8208
b
https://orcid.org/0000-0002-1201-5344
c
https://orcid.org/0000-0002-2393-9761
d
https://orcid.org/0000-0003-3636-2081
e
https://orcid.org/0000-0003-1195-5198
f
https://orcid.org/0000-0002-5986-7886
the anomaly was a threat or not. The presented solu-
tion is part of a wider system, still under development,
called RegSOC: Regional Security Operation Centre
(Bialas et al., 2020). The system is dedicated for a
public institution as a non–commercial platform.
In the paper three methods are taken into consid-
eration: two of them base on multi–dimensional data
density (LOF — (Breunig et al., 2000), RKOF —
(Gao et al., 2011)) while the third one (GESD) comes
from the one–dimensional statistical analysis.
The paper is organized as follows: it starts from the
description of the context of the presented research,
especially the significant role of Security Operation
Centre; the section is followed by a short review of
well–known methods of outlier detection; afterwards
the motivation that led to the machine learning method
application, as the complement of real–time is ex-
plained; next part presents the selected methods of
anomaly detection and their application on real data
analysis; the paper ends with some conclusions and
perspectives of future works.
2 RESEARCH CONTEXT
RegSOC is a specialized Security Operations Centre
(SOC), mainly for public institutions. Each SOC is
based on three pillars: people, processes and tech-
nology. Highly qualified cybersecurity specialists of
Michalak, M., Wawrowski, Ł., Sikora, M., Kurianowicz, R., Kozłowski, A. and Białas, A.
Outlier Detection in Network Traffic Monitoring.
DOI: 10.5220/0010238205230530
In Proceedings of the 10th International Conference on Pattern Recognition Applications and Methods (ICPRAM 2021), pages 523-530
ISBN: 978-989-758-486-2
Copyright
c
2021 by SCITEPRESS – Science and Technology Publications, Lda. All rights reserved
523

different competences embraced by the proper man-
agement structure are important for SOC. The peo-
ple should be able to extent permanently their knowl-
edge and skills following the technological progress,
emerging attack methods and IT users’ behaviours.
SOC is based on well–defined processes fo-
cused on security monitoring, security incident man-
agement, threat identification, digital forensics and
risk management, vulnerability management, security
analysis, etc. The processes are foundation of the
SOC services offered to customers. The SOC pro-
cesses, run by the SOC personnel, use advanced soft-
ware and hardware solutions for security monitoring,
network infrastructure readiness, events collections,
correlation and analysis, security control, log man-
agement, vulnerability tracking and assessment, com-
munication, threat intelligence, and many others. The
SOC operations and technology are presented in many
publications, including the (Muniz et al., 2015) book.
The RegSOC project is aimed at the development
of certain components needed to create the RegSOC
system, including: the hardware and software equip-
ment working as network-based intrusion detection
systems (NIDS), able to operate as standalone au-
tonomous devices within a local administration do-
main, as well as integrated with RegSOC, the cyber-
security monitoring platform embracing software and
organizational elements, the procedural and organiza-
tional model of operation of the regional centres in co-
operation with the national cybersecurity structure.
Network traffic data are sampled, ordered and re-
searched to reveal potential known or unknown at-
tacks. Two basic approaches are used: rule-based
correlation and anomaly-based correlation. The first
approach is focused on the previously known threats
(signature attacks). Anomaly detection based on ma-
chine learning is able to detect both kinds of attacks,
especially if it is supported by the rule based system.
The effectiveness of such a mixed–mode system de-
pends on how deep and precise the knowledge about
network traffic acquired by the machine learning pro-
cess is. The context of the network traffic is extremely
important to distinguish what the normal behaviour
and what the suspected behaviour are. The research
presented in the paper concerns solutions to be imple-
mented in the specialized NIDS.
3 RELATED WORKS
Outliers (anomalies, abnormal observations) do not
have a formal definition. One of the proposals
(Grubbs, 1969) claims that “an outlying observation is
one that appears to deviate markedly from other mem-
bers of the sample in which it occurs” which success-
fully fulfills the intuitive feeling of this concept. How-
ever, in the literature some other propositions may
be found (Weisberg, 2014; Barnett and Lewis, 1994;
Hawkins, 1980).
For decades many outlier detection approaches
have been developed. Generally, most of the outlier
detection methods may be divided in two groups: sta-
tistical and density based. Statistical approaches anal-
yse only one dimension. Such an approach requires
— in the case of multidimensional data analysis —
further postprocessing of the obtained results. It is re-
quired to define when the object become an outlier:
whether at least one variable value is pointed to be
an outlying value, an assumed percentage of variables
behave in such a way or values of all variables are
pointed as outlying observations. As the members of
the first mentioned group the typical 3𝜎 test, Grubb’s
test (Barnett and Lewis, 1994) or finally the GESD ap-
proach (Rosner, 1983) may be presented.
The second group of methods base on local data
dispersion: objects from the region of their high den-
sity are mostly interpreted as normal (typical) obser-
vations while other (from the sparse region of the
space, very distanced from other objects) observations
are considered as outliers. Such an approach is used
in methods that base on k–nearest neighbours (Ra-
maswamy et al., 2000) , in several ranking methods
like LOF (Breunig et al., 2000) or RKOF (Gao et al.,
2011), partitioning algorithm (Liu et al., 2008) and
many more.
Apart from these two groups of outlier detec-
tion it is also worth to mention a completely differ-
ent approach that bases on Support Vector Machine
(Boser et al., 1992) and introduces the One–Class
SVM scheme (Schölkopf et al., 1999). Such an ap-
proach searches for the optimal separating hyperplane
that separates typical objects from the noise. How-
ever, the search is performed in the high–dimensional
projection of original variables. Moreover, one of the
state–of–the–art methods of density-based clustering
— DBSCAN (Ester et al., 1996) — can also be used
for the outlier detection: observations that did not be-
come the member of any created clusters may be in-
terpreted as outliers. On the other hand, the following
density based approach application may be invoked:
(Ramaswamy et al., 2000; Knorr and Ng, 1998; Byers
and Raftery, 1998).
4 MOTIVATION
Commonly applied Intrusion Detection Systems
(IDS) are based on rules which describe certain de-
ICPRAM 2021 - 10th International Conference on Pattern Recognition Applications and Methods
524

pendencies being identifiers of threats. Such rules are,
for example, the description of typical behaviour of
systems and users or signatures (patterns) of typical
threats. Based on these rules, systems such as Snort
(Snort IDS, 2020), Suricata (Suricata IDS, 2020) or
Bro IDS (Zeek (BRO IDS), 2020) detect previously
identified and described threats. If a system detects
a deviation from normal (safe) conditions, simultane-
ously the character of this deviation is identified, e.g.
increased number of logging trials, scanning computer
ports in the network, communication with the use of
untypical ports, errors in the structure of packages.
The disadvantage of such solutions lies in the ne-
cessity to identify and characterize the threats in ad-
vance – without that the systems would be helpless.
The lack of protection against new and unknown types
of attacks is a major problem and may lead to danger-
ous situations, particularly when the attack is directed
at a specific industrial branch or a specific technical
solution. An example of such an attack was the one
on banks which used the website of Poland’s Finan-
cial Supervision Authority (Niebezpiecznik, 2020b).
The process of its detection was very long and had not
been successful until the observation and analysis of
untypical traffic in banking networks were launched.
Another example may be an attack on the terminals
of Internet and cable TV operators (Niebezpiecznik,
2020a), which was a branch-type attack but an un-
typical one. The attackers used a newly identified
backdoor (method implemented by a manufacturer or
attacker by which users are able to bypass security
measures and gain high–level access) in the terminals
software. The attack resulted in significant damage
(firmware damage) of the infrastructure and financial
losses.
A solution to this problem may be systems which
detect anomalies with the use of their own patterns
based on previous analysies of web traffic (conducted
when the attack does not occur). Such an approach en-
ables to make automatically a functioning profile for
a network specific for a given client and then try to
detect untypical behaviours (attacks). Thanks to the
automatic formation of a traffic pattern, the system be-
comes a self-learning one and adapts itself to changes
in the operations of the network and the behaviours of
its users.
In such solutions it is possible to use AI algorithms
and expert systems whose task would be to conduct
preliminary assessment and classification of detected
anomalies. It is important to note, however, that such
an approach is not simple as it will require to select
proper algorithms and key parameters. An example
of such a key parameter may be a time window for
analyzing data and the analysis frequency.
Proper selection of such parameters will allow to
minimize the detection of false threats which might
result from untypical behaviours of the users or from
different events in the real world. An example may be
an increased web traffic during working hours or regu-
lar, but not frequent, updates of software and systems.
In such cases the detected anomalies, e.g. sharp rise
of web traffic from 7 a.m. or untypical data exchange
of a group of computers with an unknown host, may
turn out to be typical operations of an organization,
such as the start of daily work or periodical updates of
working stations software.
The time of detection will be certainly another im-
portant aspect. Due to the manner and range of the
analysis, which requires a certain amount of comput-
ing power, such systems surely will not provide real-
time detection (contrary to signature systems). Yet in
this case, when the goal of the operation is to detect
untypical and slow changing events, it seems natural
that to obtain reliable results of such detection some
time will be needed and this time may be counted in
days. However, such a long time does not necessarily
translate into a big delay in this case – the mentioned
attack on the Financial Supervision Authority [4] was
detected, according to the experts’ estimations, after a
few weeks or even months.
5 SELECTED METHODS OF
OUTLIER DETECTION
Local Outlier Factor (LOF) (Breunig et al., 2000) is
a method of ranking points due to their possibility
of being anomalies in the data. The rank position
depends on the LOF coefficient (factor) value calcu-
lated for each point separately. The factor value de-
pends on the local density of data around the consid-
ered point. Finding the factor value also requires to
provide two parameters: 𝑘, which is the number of
considered neighbours for the point, and 𝑘 − 𝑑𝑖𝑠𝑡𝑎𝑛𝑐𝑒
which refers to the distance to the 𝑘th closest neigh-
bour. Based on these two parameters for each point a
local reachability density (lrd) is calculated. Finally,
the factor of each point is found on the basis of its and
his neighbours lrd.
The interpretation of such a defined factor is very
easy: typically, points with 𝐿𝑂𝐹 ≤ 1 should not be
considered anomalies, on the other hand, as the 𝐿𝑂𝐹
value exceeds 1, it becomes more probable that the ob-
servation is really an outlier (however, there is no cor-
relation between the factor value and the mentioned
probability).
In the experiments the R software (R Core Team,
2013) implementation of the LOF algorithm was used
Outlier Detection in Network Traffic Monitoring
525

(Madsen, 2018).
Another factor that ranks objects due to their atyp-
icality is Robust Kernel–based Outlier Factor (RKOF)
(Gao et al., 2011). Instead of LOF mentioned above,
the method bases on the weighted neighbour density
in the point rather than on the average neighbour den-
sity. As the authors claim, such a modification im-
proves the possibility of the outliers detection even if
their number is comparable to the typical objects num-
ber in some neighbourhood.
The interpretation of obtained factors remains the
same as above: observations with 𝑅𝐾𝑂𝐹 < 1 should
not be considered outliers, while the other ones (with
𝑅𝐾𝑂𝐹 > 1) seem not to be the typical observations.
In experiments, also the R software was used with
the package that implements this method (Tiwari and
Kashikar, 2019).
The generalized extreme studentized deviate
(GESD) test (Rosner, 1983) is used to detect outliers
for univariate data. This procedure assumes in a null
hypothesis that there are no outliers while an alterna-
tive hypothesis claims the existence of up to 𝑟 outliers.
GESD performs 𝑟 separate tests and calculates a test
statistic 𝑅 for each observation 𝑖. The test statistic is
compared with critical value 𝜆
𝑖
. The number of out-
liers is determined by finding the largest observation
for which 𝑅
𝑖
> 𝜆
𝑖
.
In experiments, the GESD method was applied for
two variables and two variants of outliers were con-
sidered. In the first case an anomaly was identified if
it occurred for the first or second variable (GESD1).
Secondly, the observation was treated as an outlier if
it was identified in both cases (GESD2). The GESD
method is implemented in the R package (Dancho and
Vaughan, 2019).
6 EXPERIMENTS
6.1 Network Data
The network traffic was monitored between 25th of
March and 12th of May 2019. The total number of
collected records was over 22,000,000. The raw data
format consisted of the following variables: date and
time of the session ending, source IP address, destina-
tion IP address,source port number, destination port
number, the total number of bytes sent during the ses-
sion.
As the preprocessing step the data were aggregated
in two ways: grouped by a minute and grouped by
an hour. During the aggregation the additional de-
rived variables were calculated as: dateTime — date
and time of the aggregation slot, dayOfWeek (dOW)
— number of the week day, weekOfYear (wOY) —
number of the week of the year, hourOfDay (hOD)
— number of an hour of the day, workingDay (wD)
— Boolean variable saying whether the day is dif-
ferent than Sunday, nOfPackets — number of packets
sent during the aggregation slot, sizeOfPackets — to-
tal size of packets sent during the aggregation slot.
The total amount of records aggregated by a
minute totalled 67,578 while the number of hourly
aggregated records totalled to 1,127. Such numbers
confirm that there were no long intervals of missing
data (from the technical network traffic monitoring
reasons) or intervals of real no traffic in the network.
6.2 Methodology
We focused on only two variables available in the data:
number of packets (nop) and size of packets (sop). In
Fig. 1 the values of these variables are presented. That
means that the anomaly detection was performed in
the two-dimensional space of the mentioned variables.
We carried out the experiments in two modes: the
global one and with a moving window (called just
“moving”). The goal of the first approach was to learn
the gathered data better, while the goal of the sec-
ond approach was to check how the mentioned meth-
ods may become useful in practical applications. In
the global mode the anomaly detection was performed
within all available data. However, in the case of
the moving approach the anomaly detection was per-
formed only on a subset of recent observations from
which only the latest observations were taken into con-
sideration as possible anomalies. Such an analysis
is possible in R with runner package (Kałędkowski,
2020).
Let us consider the a set of 𝑛 following observa-
tions. Here ℎ is the number of observations called
“history” and 𝑝 is the number of observations called
“present”. The time series of all observations is de-
noted as {𝑎}
𝑛
1
(it seems natural to assume that 𝑛 ≫
ℎ + 𝑝). Now let us start from the moment 𝑖 = ℎ + 𝑝.
We perform the outlier analysis of {𝑎}
ℎ+𝑝
1
, however,
only the results for {𝑎}
ℎ+𝑝
ℎ+1
time series observations are
transferred to the final processing. The “present” hori-
zon may be interpreted as the local window of data
analyzed due to the occurrence of some anomalies.
However, on the other hand it may also be a time be-
tween generating two following reports and the time
interval when new data arrives. So in the next step,
at the 𝑝 + 1 moment the {𝑎}
ℎ+𝑝+𝑝
𝑝+1
series is analyzed
and the results of the {𝑎}
ℎ+𝑝+𝑝
ℎ+𝑝+1
samples analysis are
reported. With such definition, the report of possible
anomalies in the network traffic is generated in any 𝑝
ICPRAM 2021 - 10th International Conference on Pattern Recognition Applications and Methods
526

Figure 1: Two time series referring to the values of the number of packages (blue series) and the total size of packages (red
series), aggregated hourly (upper chart) and by a minute (lower chart).
time intervals.
As the provided analysis is not assumed to be a
real–time one (as it was explained in Section 4) we
assumed two different values of ℎ and 𝑝 for minutely
and hourly aggregated data. In the intuitive way the
minutely aggregated data analysis provides the hour
report of last 60 minutes of network traffic monitor-
ing, while the hourly aggregated data analysis reflects
a daily report interpreting the data aggregated within
last 24 hours.
In general, for a given set of 𝑛 observations in a
time series and assumed values of ℎ and 𝑝, the fol-
lowing number of consecutive windows may be cal-
culated as the lower round of the following quotient:
𝑤 = ⌊
𝑛−ℎ
𝑝
⌋. Table 1 presents values of all analysis pa-
rameters for two sets of data.
6.3 Results
LOF and RKOF algorithms were applied on six vari-
ables: number of the week day, number of the week of
the year, number of the hour of the day, working day,
number of packets and size of packets. The crucial
argument in these methods is the number of nearest
neighbours — for data aggregated within a minute we
considered 60 neighbours while for hourly aggregated
data — 24. Instead of a conventional threshold we
used distribution quantiles of the obtained LOF and
RKOF values.
Table 1: History and present parameters values for moving
approach experiments.
agg. samples history present windows
time 𝑛 ℎ 𝑝 𝑤
minute 67 578 1 440 60 1 102
hour 1 127 168 24 39
To utilize the GESD method, we firstly decom-
posed the time series and thus we derived the remain-
ders of the number of packets and size of packets. As
the GESD method is a univariate technique, the ob-
servation was treated as an anomaly if it was detected
as an outlier in two dimensions: the number and size
of packets. As it was already mentioned, due to the
univariate character of this method, anomalies were
indentified in two ways. The GESD1 approach — the
observation was an outlier for the number or size of
packets. The GESD2 approach — the observation was
treated as an outlier for the number and size of pack-
ets. The analysis was conducted in the global mode
and window mode.
All presented methods generate the ranking that
points at the level of possibility of being an outlier —
the higher rank, the more untypical the object is. Such
a situation allows to limit the number of reported ob-
servations per cyclic window. It may occur that all
(or almost all) objects from the 60–minute aggregated
data should be reported and analyzed before the next
report is generated. That led us to limit the number
of reported objects up to top ten (from the ranking
point of view) observations when the report is gen-
erated hourly and up to top 5% when the report is gen-
erated daily. These limits were consulted with domain
experts and such a limitation assures not more than 10
outliers per hour or not more than 38 outliers per day.
Fig. 2 features the result of the global data anal-
ysis with the RKOF algorithm. The observation con-
sidered an outlier is marked with a black short line in
the upper part of each chart. What is obvious there
are more found outliers in minute aggregated data.
However, a more proper approach is the one based
on a moving window. Further experiments were per-
formed with all four methods. The values of ℎ and 𝑝
Outlier Detection in Network Traffic Monitoring
527
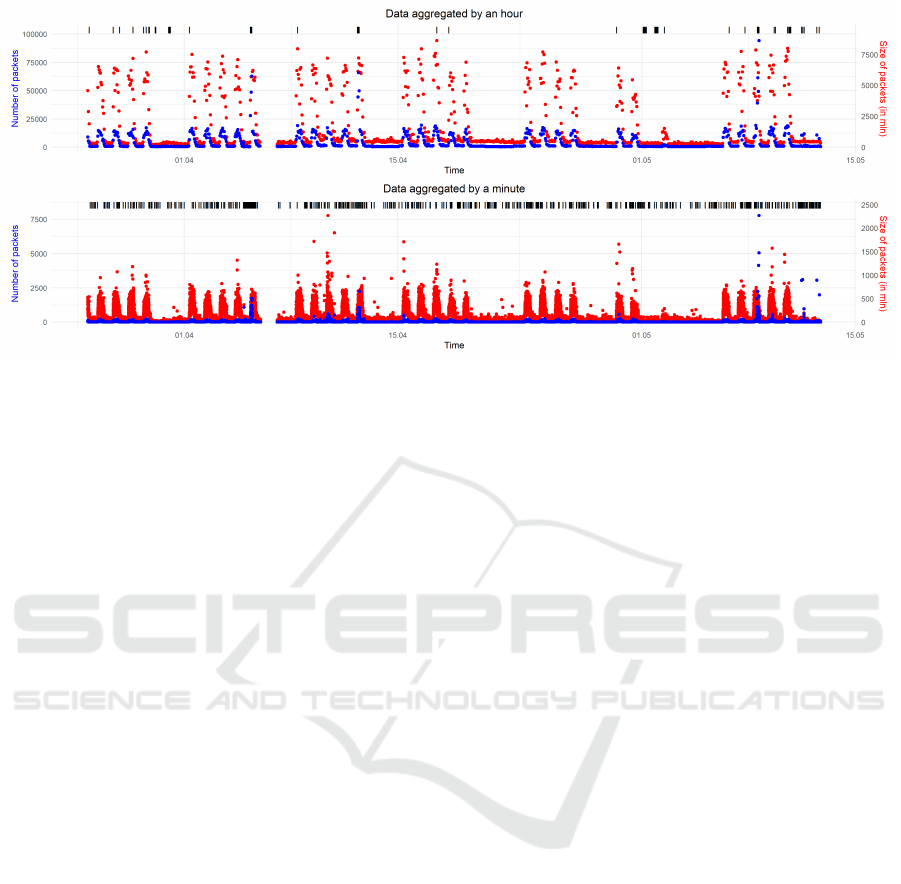
Figure 2: Two time series referring values of number of packages (blue series) and total size of packages (red series), aggregated
by minute (upper chart) and by hour (lower chart) with anomalies identified by RKOF in global mode.
were already presented in Table 1. The results for all
methods are presented in Fig. 3.
The chart is based on the way of outliers marking
in Fig. 2 — the marks on the upper part of that chart
are now one line of the dots placed on the proper Y
axis coordinate. Because some observations could be
recognized as anomalies by more than one method,
the number of methods is represented by the colour of
dots for the same X. The colour meaning is explained
in the legend below, e.g. a red dot means that three
methods claimed the observation as an outlier.
6.4 Discussion
According to hourly aggregated data the most of
observations were not signalled as outliers by any
method — 786 of 936 — and only 93 observations
were reported by at least two methods. Only once all
methods reported an outlier and only twice three meth-
ods (except GESD2) did it. In general, RKOF was
suggesting an outlier together with LOF — just once
with GESD1 (LOF was only signalling with RKOF).
What is intuitive, GESD2 was not reporting if GESD1
was not. Such behaviour reflects the common nature
of ranking–based methods (LOF, RKOF) which is dif-
ferent than GESD–based.
According to minute-aggregated data over 96% of
66,120 of them were not signalled as outliers, while
631, 1,742, 22, and 44 were reported by 1, 2, 3, and 4
methods respectively. This time at least two methods
pointed at an anomaly 1,808 times. Similarly to the
previous situation, in case of three methods warning,
GESD2 was the one that did not signal an alarm —
only in two cases from 22 RKOF was more permis-
sive. Interestingly, only once GESD1 was consistent
with LOF — in all remaining two methods–signalled
alerts GESD1 was consistent with GESD2 and RKOF
was consistent with LOF.
Let us now focus on the different way of results
analysis. In the paper we are looking for some anoma-
lies with respect to the number of packets/total size of
packets values. In Fig. 4 the hourly aggregated data
are presented and the X axis represents the number of
packets sent in the single aggregation time while the Y
axis represents the total size of sent packets. Colours
used for points have the same meaning as in Fig. 3.
Typical observations lie more or less on the
straight line which reflects the nearly constant ratio
of the number of packets and their total size. More-
over, there are no typical observations that violate this
simple rule. There are also a dozen points that are
surely anomalies and which happened to be detected
by at least two methods. However, some observations
reported as outliers are also close to the line — espe-
cially all objects detected by only one method.
In Fig. 5 the minutely–aggregated data analysis
results are presented in the same way. The linear de-
pendence between the packet size and number is not so
visible. Typical observations tend to satisfy the ratio
condition, however, the extension of the line covers
points that are reported as anomalies, by two meth-
ods in general. There is a “cloud” of observations
over the line — these are anomalies found by a single
method. Objects selected by three or four methods are
not so visible, as they are overlapped by 1 and 2–meth-
ods found anomalies. This suggests, that observations
from the same region of the space are usually detected
by one or more methods.
ICPRAM 2021 - 10th International Conference on Pattern Recognition Applications and Methods
528
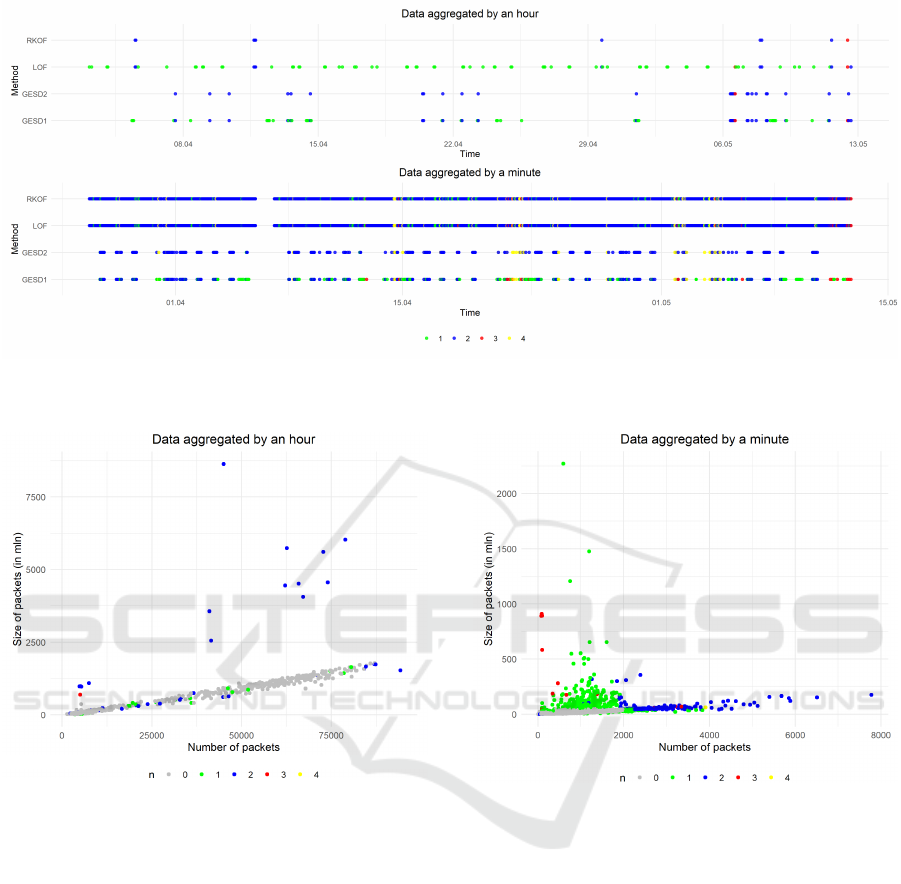
Figure 3: Two time series referring to anomalies found by each method (Y axis) in the data aggregated by a minute (upper
chart) and by an hour (lower chart); the colours of the dots refers to how many methods found the same observation as an
anomaly in the window mode.
Figure 4: Hourly aggregated data in two–dimensional space
and number of methods pointing at them as outliers.
7 CONCLUSIONS AND FURTHER
WORKS
In the paper the outlier analysis approach for net-work
traffic data anomaly detection was presented. Based
on real data an off–line analysis was performed, while
an on–line analysis was modelled with the moving
window methodology. Four algorithms of anomaly
detection were used and two variants of reporting fre-
quency were checked.
The presented solution is designed to be flexible in
terms of the degree of the historic data analysis, report
generating frequency, maximal number of anomalies
per one report. As the solution bases on parameterized
methods, the values of these parameters influence sig-
nificantly the report contents.
Figure 5: Minute aggregated data in two–dimensional space
and number of methods pointing at them as outlier.
In the research only two variables were taken into
consideration. In our future works we plan to extend
the model by the data that are the input for anomaly
detection methods. Some of the new variables have
been already defined in Sec. 6.1. It is also intuitive to
consider different sets of method parameters for dif-
ferent types of the day (e.g. working day and day off).
Moreover, our future works will focus on exper-
iments in a closed model environment in which it
will be possible to introduce some anomalies to net-
work traffic and to check how presented methods re-
port these anomalies. It is also under development to
couple the analytical software in R with data stored
in Elastic-search environment to assure on–line data
analysis and reporting.
Outlier Detection in Network Traffic Monitoring
529

ACKNOWLEDGEMENTS
RegSOC — Regional Center for Cybersecurity.
The project is financed by the Polish National
Centre for Research and Development as part of
the second CyberSecIdent — Cybersecurity and e-
Identity competition (agreement number: CYBERSE-
CIDENT/381690 /II/NCBR/2018).
REFERENCES
Barnett, V. and Lewis, T. (1994). Outliers in statistical data.
3rd ed. John Wiley & Sons Ltd.
Bialas, A., Michalak, M., and Flisiuk, B. (2020). Anomaly
detection in network traffic security assurance. Ad-
vances in Intelligent Systems and Computing, 987:46–
56.
Boser, B. E., Guyon, I. M., and Vapnik, V. N. (1992). A
training algorithm for optimal margin classifiers. In
Haussler, D., editor, Proc. of the 5th Annual Workshop
on Computational Learning Theory (COLT’92), pages
144–152. ACM Press.
Breunig, M. M., Kriegel, H.-P., Ng, R. T., and Sander,
J. (2000). LOF: Identifying density-based local out-
liers. In Proceedings of the 2000 ACM SIGMOD In-
ternational Conference on Management of Data, page
93–104.
Byers, S. and Raftery, A. E. (1998). Nearest-neighbor clut-
ter removal for estimating features in spatial point pro-
cesses. Journal of the American Statistical Associa-
tion, 93(442):577–584.
Dancho, M. and Vaughan, D. (2019). anomalize: Tidy
Anomaly Detection. R package version 0.2.0.
Ester, M. et al. (1996). A density-based algorithm for dis-
covering clusters in large spatial databases with noise.
In Proc. of the 2nd Int. Conf. on Knowledge Discov-
ery and Data Mining, KDD’96, page 226–231. AAAI
Press.
Gao, J., Hu, W., Zhang, Z. M., Zhang, X., and Wu, O.
(2011). RKOF: Robust kernel–based local outlier de-
tection. In Advances in Knowledge Discovery and
Data Mining, pages 270–283.
Grubbs, F. E. (1969). Procedures for detecting outlying ob-
servations in samples. Technometrics, 11(1):1–21.
Hawkins, D. (1980). Identification of outliers. Mono-
graphs on applied probability and statistics. Chapman
and Hall.
Kałędkowski, D. (2020). runner: Running Operations for
Vectors. R package version 0.3.7.
Knorr, E. M. and Ng, R. T. (1998). Algorithms for mining
distance-based outliers in large datasets. In Proc. of
the 24rd Int. Conf. on Very Large Data Bases, VLDB
’98, page 392–403.
Liu, F. T., Ting, K. M., and Zhou, Z. (2008). Isolation for-
est. In 2008 Eighth IEEE International Conference on
Data Mining, pages 413–422.
Madsen, J. H. (2018). DDoutlier: Distance & Density-
Based Outlier Detection. https://CRAN.R-project.org/
package=DDoutlier.
Muniz, J., McIntyre, G., and AlFardan, N. (2015). Security
Operations Center: Building, Operating, and Main-
taining Your SOC. Cisco Press.
Niebezpiecznik (2020a). Alcatel–Lucent attack (in Polish).
link, Accessed 2020-06-01.
Niebezpiecznik (2020b). How the Poland’s Financial Su-
pervision Authority attack was performed? (in Pol-
ish). link, Accessed 2020-06-01.
R Core Team (2013). R: A Language and Environment for
Statistical Computing. R Foundation for Statistical
Computing, Vienna, Austria. http://www.R-project.
org/.
Ramaswamy, S., Rastogi, R., and Shim, K. (2000). Effi-
cient algorithms for mining outliers from large data
sets. SIGMOD Rec., 29(2):427–438.
Rosner, B. (1983). Percentage points for a generalized esd
many-outlier procedure. Technometrics, 25(2):165–
172.
Schölkopf, B., Williamson, R., Smola, A., Shawe-Taylor, J.,
and Platt, J. (1999). Support vector method for nov-
elty detection. In Proceedings of the 12th Interna-
tional Conference on Neural Information Processing
Systems, NIPS’99, page 582–588, Cambridge, MA,
USA. MIT Press.
Snort IDS (2020). www.snort.org.
Suricata IDS (2020). www.suricata-ids.org.
Tiwari, V. and Kashikar, A. (2019). OutlierDetection: Out-
lier Detection. R package version 0.1.1.
Weisberg, S. (2014). Applied Linear Regression. Wiley,
Hoboken NJ, fourth edition.
Zeek (BRO IDS) (2020). www.zeek.org.
ICPRAM 2021 - 10th International Conference on Pattern Recognition Applications and Methods
530
