
Automated Model for Tracking COVID-19 Infected Cases till Final
Diagnosis
Mohamed A. Gomaa
1 a
, Mustafa Wassel
1 b
, Rouzan M. Abdelmawla
1 c
, Nihal Ibrahim
1 d
,
Khaled Nasser
1 e
, Nermin A. Osman
2 f
and Walid Gomaa
1,3,∗ g,∗
1
Faculty of Engineering, Alexandria University, Egypt
2
Biomedical Informatics and Medical Statistics Department, Medical Research Institute, Alexandria University, Egypt
3
Department of Computer Science and Engineering, Egypt Japan University of Science and Technology, Alexandria, Egypt
Keywords:
Corona Virus Disease 2019, Pneumonia, COVID-19, Deep Learning, Convolution Neural Network (CNN),
Chest Radiology, X-ray, CT-Scan, Medical Imaging, Polymerase Chain Reaction (PCR).
Abstract:
The COVID-19 pandemic is now devastating. It affects public safety and well-being. A crucial step in the
COVID-19 battle will be tracking the positive cases with convenient accuracy of diagnosis. However, the
time of pandemics shows the emergent need for automated diagnosis to support medical staff decisions in
different steps of diagnosis and prognosis of target disease like medical imaging through X-rays, CT-Scans, etc.
Besides laboratory investigation steps, we propose a system that provides an automated multi-stage decision
system supported with decision causes using deep learning techniques for tracking cases of a target disease
(COVID-19 in our paper). Encouraged by the open-source Data sets for COVID-19 infected patients’ chest
radiology, we proposed a system of three Consecutive stages. Each stage consists of a deep learning binary
classifier tailored for the detection of a specific COVID-19 infection feature from chest radiology, either X-ray
or CT-scan. By integrating the three classifiers, a multi-stage diagnostic system was attained that achieves an
accuracy of (87.980 %), (78.717%), and (84%) for the three stages, respectively. By no means a production-
ready solution, our system will help in reducing errors caused by human decisions, taken under pressure, and
exhausting routines, and it will be reliable to take urgent decisions once the model performance achieves the
needed accuracy.
1 INTRODUCTION
Active monitoring of affected patients is a crucial
phase in the battle against COVID-19, ensuring that
any exposed patient will seek prompt diagnosis and
care, as well as be isolated to reduce the spread of the
contagious Virus. The primary screening tool used
to identify COVID-19 cases is the polymerase chain
reaction (PCR) test, which can diagnose COVID-19
RNA from respiratory specimens (Hammoudi et al.,
a
https://orcid.org/0000-0001-7594-1137
b
https://orcid.org/0000-0002-2048-7624
c
https://orcid.org/0000-0001-6328-132X
d
https://orcid.org/0000-0002-5246-2106
e
https://orcid.org/0000-0001-8886-7044
f
https://orcid.org/0000-0001-7845-1854
g
https://orcid.org/0000-0002-8518-8908
∗
All authors contributed equally
2020). Although PCR testing is the gold standard
because it is highly reactive, it is a time-consuming,
laborious, and complicated manual method that is in
short supply (Wang and Wong, 2020).
An alternative screening method that has also been
used for COVID-19 screening has been the radiog-
raphy test in which chest X-ray imaging, e.g., X-ray
or computed tomography (CT) imaging, is performed
and analyzed by radiologists for visual indicators as-
sociated with COVID-19 viral infection. Early stud-
ies have shown that patients reveal malformations in
chest radiography that are characteristic of those in-
fected with COVID-19, with some suggesting that the
X-ray examination could be used as a primary tool for
the screening of COVID-19 in epidemic areas (Wang
and Wong, 2020),(Acharya and Satapathy, 2020) and
(Xu et al., 2020).
With the massive increase in the number of infec-
tions and suspect patients, it is arduous to perform
Gomaa, M., Wassel, M., Abdelmawla, R., Ibrahim, N., Nasser, K., Osman, N. and Gomaa, W.
Automated Model for Tracking COVID-19 Infected Cases till Final Diagnosis.
DOI: 10.5220/0010237401430154
In Proceedings of the 14th International Joint Conference on Biomedical Engineering Systems and Technologies (BIOSTEC 2021) - Volume 5: HEALTHINF, pages 143-154
ISBN: 978-989-758-490-9
Copyright
c
2021 by SCITEPRESS – Science and Technology Publications, Lda. All rights reserved
143

polymerase chain reaction (PCR) testing on all these
people. Notably, the prevalence of influenza becomes
significantly greater amid the active flu season (Ham-
moudi et al., 2020) and (Xu et al., 2020).
Empowered by the need for better processing of
radiography, a variety of deep-learning techniques
have been developed, and tests have shown to be very
encouraging in terms of precision in the identifica-
tion of COVID-19-infected patients (Xu et al., 2020),
(Wang et al., 2020) and (Hammoudi et al., 2020).
In this paper, we propose an Automated Model for
Tracking COVID- 19 Infected Cases till Final Diag-
nosis, which is a pipeline for automatic detection of
pneumonia from chest radiography images using the
Convolution deep neural network
1
. We use different
data sets to train and validate the system pipeline to-
wards the automatic differentiation between various
pneumonia diseases and the novel COVID-19 virus.
The purpose of the model pipeline is developing an
assisting protocol for the medical staff that they can
use to decide if the suspect patient needs to do the
COVID-19 testing or other treatment protocol. The
remarkable added value of our system is the use of
CNN to fasten the process of chest radiology analy-
sis.
The paper is structured according to this. Firstly,
Section 2 provides a brief description of the contri-
butions made by other researchers in this area. Sec-
tion 3 addresses the methods used to construct the
proposed automated model for tracking COVID- 19
infected cases up until the final diagnosis, the sys-
tem design and phases of the pipeline, the layout of
the architecture for each stage of the system pipeline,
and the data-set used per step. Section 4 describes the
specifics of deployment, training parameters for sys-
tem stages, and a description of the results obtained
from the technique of Class Activation Map (CAM).
Section 5 describes and examines the findings of tests
performed to determine the feasibility of the planned
pipeline. Finally, conclusions are seen, and further
directions are explored in Section 6 and Section 7.
2 RELATED WORK
Image processing and machine learning methods of-
ten have broad precision health applications. Various
COVID-19 based research is increasingly being per-
formed to illustrate some of the principles and actual
evidence regarding this epidemic. Many image classi-
fication, assessment, and decision-making techniques
relating to COVID-19 and radiography examinations
1
Codes and Models are available upon request
are outlined below.
In (Khalifa et al., 2020), a prediction of x-ray
pneumonia chest dependent on generative adversar-
ial networks (GAN) was introduced, with a fine-tuned
deep transfer learning for a small data collection. Us-
ing GAN positively improves the proposed robustness
of the system and makes it resistant to the issue of
overfitting, which also helps to produce more images
from the data collection.
In (Mahmud et al., 2020), a novel architecture
of profound neural networks is suggested based on
depth-wise dilated convolutions. For the initial train-
ing level, large databases comprising non-COVID
pneumonia X-rays are utilized that are easily adapted
to use smaller COVID-19 X-rays databases. The
suggested stacking algorithm mutually converges fea-
tures generated from various X-ray resolutions. The
medical analysis is conducted by evaluating the acti-
vation model depending on the gradients.
In (Farag et al., 2020), an end-to-end parallelized
learning model has been developed that is capable
of taking advantage of multiple X-ray data sets of
Pneumonia-like infections in a single neural archi-
tecture, executing three tasks simultaneously; iden-
tification, segmentation, and localization. The MTL
general encoder and the classification algorithm head
are pre-trained on the standardized data set to be
allowed to identify 14 viral infections COVID-19
among them.
In (Rahman et al., 2020), an automatic diagnosis
of bacterial and viral pneumonia using an x-ray vi-
sion model has been developed. It includes a compre-
hensive update on the gains achieved in the success-
ful diagnosis of pneumonia. Four separate deep Con-
volutional Neural Network (CNN) pre-trained models
were tested. In this review, the authors recorded three
classification schemes: normal vs. pneumonia, bac-
terial vs. viral pneumonia, and normal, bacterial, and
viral pneumonia.
In (Fang et al., 2020), the objective of this study
was to equate the response of chest CT with those of
viral nucleic acid assay at the preliminary patient di-
agnosis. The findings endorsed the need for chest CT
for COVID-19 screening in patients with the clinical
and epidemiological highest correlation with COVID-
19 infection, particularly once the results of PCR tests
are negative.
In (Yang et al., 2020), a data collection of COVID-
19 CT containing 349 healthy COVID-19 CT images
from 216 patients was obtained. Besides, the utility
of this collected data has been checked for the devel-
opment of COVID-19 diagnostic models by labora-
tory studies. Also, an approach focused on multi-task
learning as well as comparison self-supervised learn-
HEALTHINF 2021 - 14th International Conference on Health Informatics
144
ing has been developed to increase diagnostic perfor-
mance to a clinically meaningful degree.
In (Li and Xia, 2020), the research was pro-
posed to assess the risk of misdiagnosis of coron-
avirus (COVID-19) radiologists and to examine the
efficiency of chest CT in the diagnosis and monitor-
ing of COVID-19. The CT features of COVID-19 are
documented and compared to the CT features of other
viruses in order to familiarise radiologists with poten-
tial CT trends.
3 METHODOLOGY
AI technologies have been promoting remote opera-
tions and helping to deal with the shortage of qualified
radiologists. With the rapid development of computer
technology, digital image processing technology has
been widely used in the medical field, including or-
gan segmentation and image enhancement and repair,
providing support for subsequent medical diagnosis.
Deep learning technologies, such as the Convolution
Neural Network (CNN) with a strong capacity for
nonlinear modeling, often have extensive applications
in medical image processing.
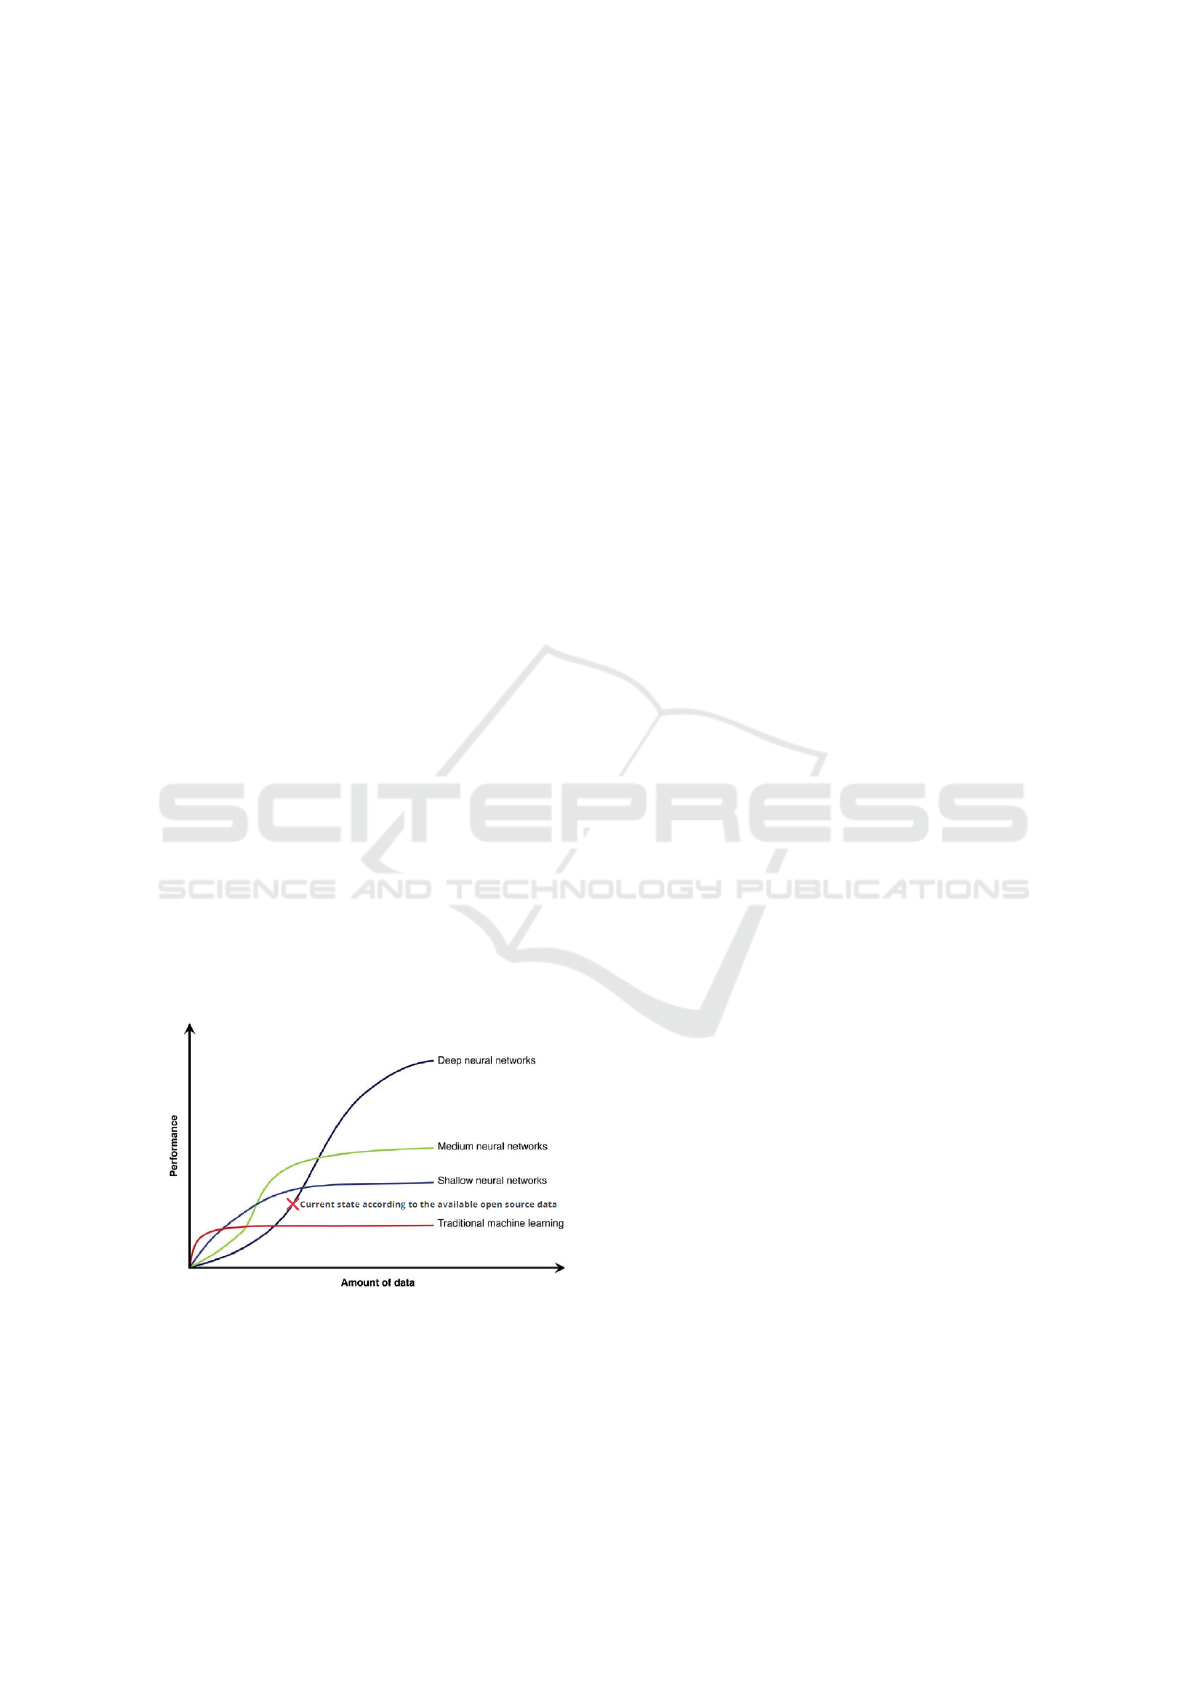
At this point, several AI-based devices and X-ray
image databases are private resources. Deep learning
performance and accuracy increase with the increase
of the amount of the user data to train the model [Fig-
ure 1]. The intended Automated Model for tracking
COVID- 19 infected cases till the final diagnosis is
composed of three main consequent steps where the
pipeline of the system was designed and inspired by
the open-source COVID-19 Chest X-ray and CT data-
sets.
Figure 1: Deep Neural Network Data and Performance
trade Off.
The CT-scanners emit X-rays. Various tissue
types absorb X-rays in different proportions, and the
resultant contrasts offer accurate representations of
anatomy and disease. Absorbed radiation can sever
chemical bonds in tissues that will destroy DNA and
cause cancer because the cells are unable to rebuild
themselves (Schmidt, 2012).
That is why respiratory infections can be more
immediately apparent in CT images than in X-ray
images of the chest. However, the identification of
COVID-19 from chest X-ray images is most often
studied as they reflect generic tools that are frequently
examined, unlike CT-scans.
The main reason for using X-ray along with CT-
scans images, especially in early-stage diagnostics,
backs to the fact of the high risk and cost of CT-scans
images. Therefore, Automatic detection must under-
take a range of identification and classification pro-
cedures to differentiate between COVID-19 and other
viral or bacterial infections.
3.1 Pipeline
The model is composed of several steps of classifica-
tion. It mimics human performance with an additive
higher process speed. As mentioned earlier, it acts as
a helping hand to the medical staff, so it uses the same
steps used by humans. The system pipeline is shown
in [Figure 2]. It is divided into three stages. Firstly,
the radiography is classified for either having a Pneu-
monia or being normal having Pneumonia. It will go
to the next classifier to decide if this infection is bac-
terial or viral. If it were bacterial, this patient would
need to subject to suitable treatment. If not bacteria,
he will use the third classifier to find out if it COVID-
19 or other viral infections. The result of the third
classifier will nominate the patient whether to subject
to the PCR testing or rest for 14 days.
3.2 First Stage
COVID-19 is a respiratory disorder. The virus will
move across the lung tissue of the individual, causing
inflammation. According to the World Health Organ-
isation (WHO), extreme pneumonia is the most fre-
quent condition of moderate COVID-19, which is a
dangerous lung inflammation (Diaz et al., 2020). It
may be fatal to certain people, particularly the elderly
and those with respiratory disorders. Respectively, an
efficient classifier was developed to automatically de-
tect if a query chest X-ray image is Normal or Pneu-
monia.
3.2.1 Architecture Design
In this stage, we construct the initial network design
prototype [Figure 3] to make one of the following
Automated Model for Tracking COVID-19 Infected Cases till Final Diagnosis
145
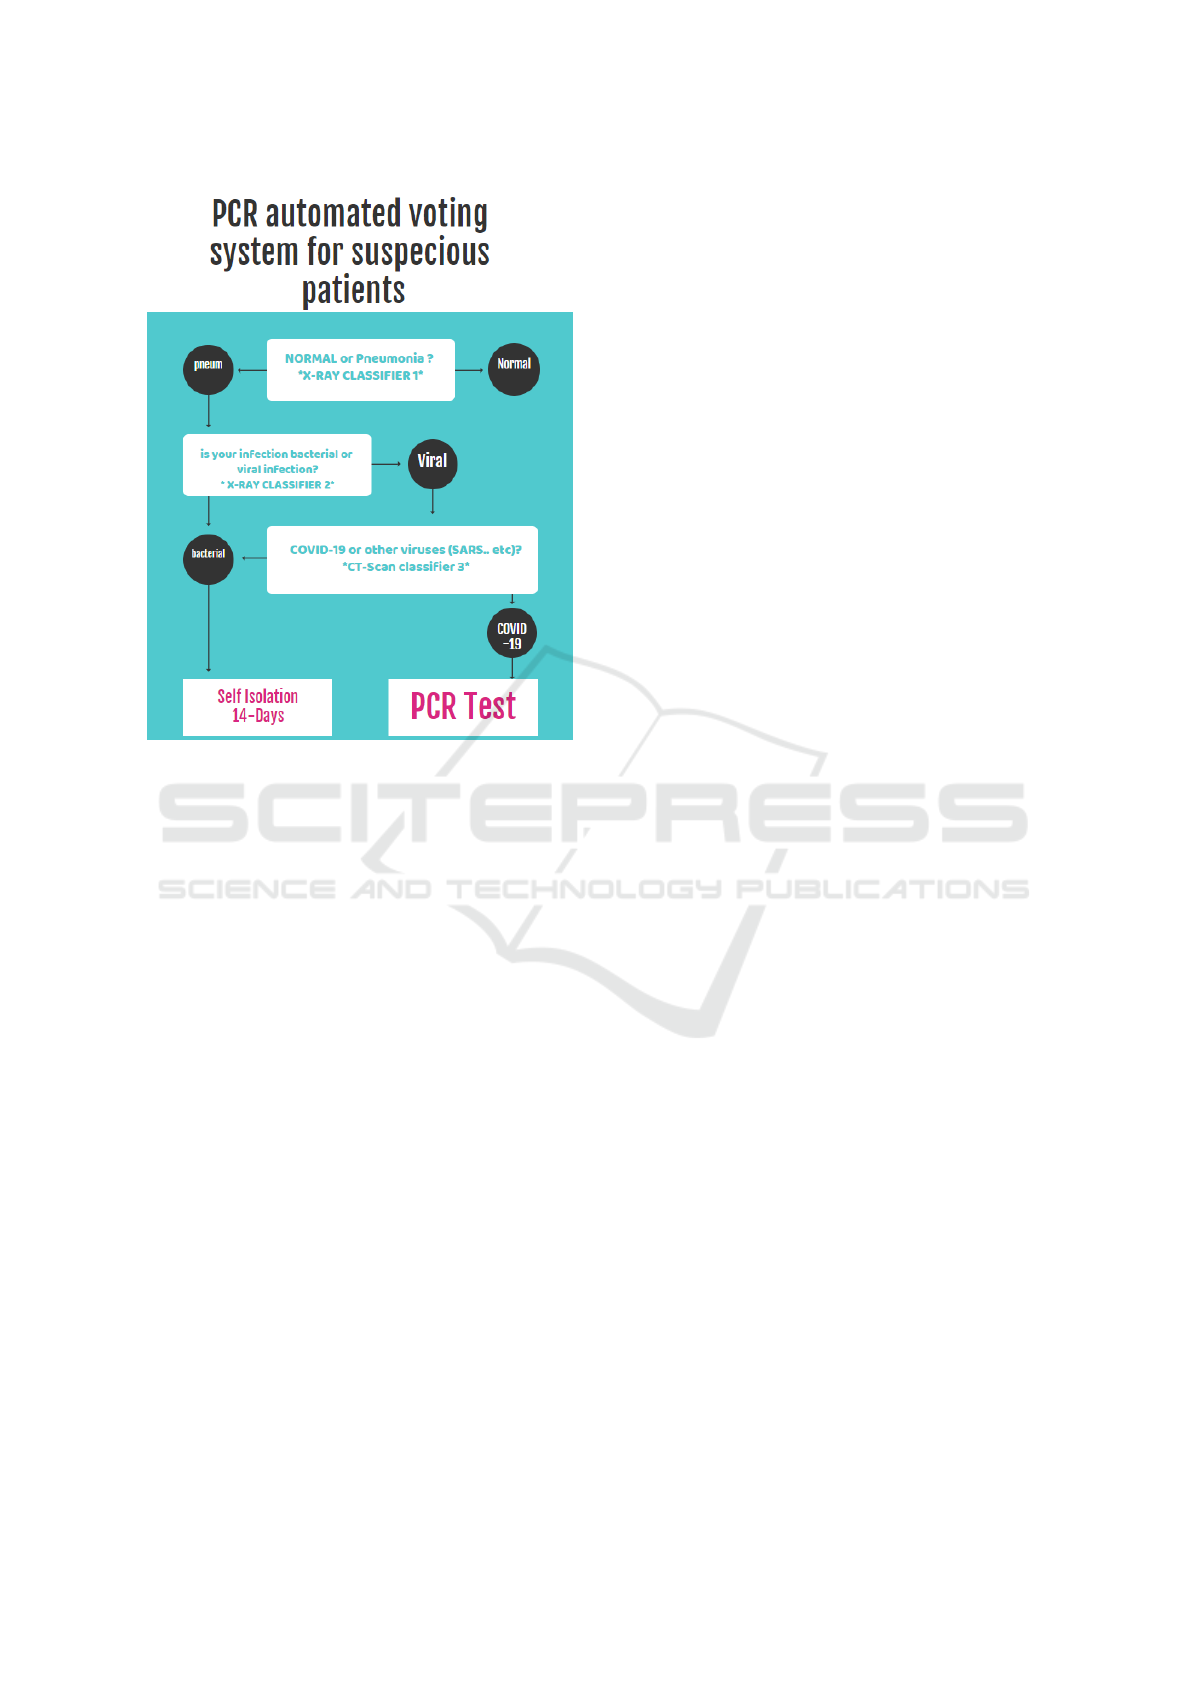
Figure 2: Automated Tracking System pipeline.
two predictions a) Normal, b) Pneumonia. The ra-
tionale for choosing this network design is that it can
aid clinicians in deciding who should be prioritized
for second-stage testing for COVID-19 case confir-
mation.
It can be observed that the First stage Classifier
network architecture makes heavy use of Spatial Sep-
arable Convolutions, convolutions that can be sepa-
rated across their spatial axes, thus yield the same re-
sult with fewer multiplications, and hence you require
fewer computational resources. Thus, it will perform
classification in the early stage with the simplest yet
efficient network for Pneumonia and normal cases.
3.2.2 Data Features
The use of X-ray is due to the easiness of detecting
pulmonary symptoms from X-ray despite its cause.
The network acts as the radiologist looking for white
spots in the lungs (called infiltrates) that identify an
infection [Figure 4b]. This test will also help deter-
mine if you have any complications related to pneu-
monia such as abscesses or pleural effusions (fluid
surrounding the lungs) [Figure 4] (Rajpurkar et al.,
2017).
3.2.3 Data Set Sources
For our experiment’s first stage, we exploited
Chest X-ray images from covid-chestxray-data-
set at: https://www.kaggle.com/praveengovi/
coronahack-chest-xraydataset. This data set is
related to Automated methods to detect and classify
human diseases from medical images. Novel Ma-
chine Learning Algorithms and neural networks help
reduce the Corona Virus detection time and aids the
physicians to drive the consultation in better ways.
This data set contains 5,910 unique X-ray images
collected from public sources as well as through
indirect collection from hospitals and physicians.
3.2.4 Data Augmentation
The practice of data augmentation is an effective way
to increase the size of the training set. Augmenting
the training examples allow the network to ‘see’ more
diversified, but still representative, data points during
training.
Due to the unbalanced nature of the given classes
and the small size of our data set, also to improve our
classifier quality to escape away from overfitting, we
have created our part of data based on the real data
set using data augmentation. We extend the original
data set by taking an image from the original data set
and apply some random functions to get random ef-
fects on each image. We have utilized the following
techniques: flipping, rotating, brightness change, and
zooming. These techniques can be used to get the de-
sired amount to balance classes.
Note: by applying this augmentation, we make
sure to create a small portion of data to the other
class to make the classifier get used to this augmen-
tation data. The augmentation must be created for all
classes, not just the unbalanced classes but not with
the same percentage.
The original data set has the distribution as shown
in [Figure 5a], the ratio of two classes was 1 : 2.75
normal to pneumonia images, after augmentation, we
have to work to decrease the large difference between
them [Figure 5b] as the results were 1 : 1.5 normal to
pneumonia.
3.2.5 Data Set Distribution
The data set is composed of 5,910 unique X-ray im-
ages divided into two categories, namely Normal and
Pneumonia. The Pneumonia images contribute 73%
of the data set and normal images represent 27%. The
data was spilled into a train and test sets with ration
HEALTHINF 2021 - 14th International Conference on Health Informatics
146
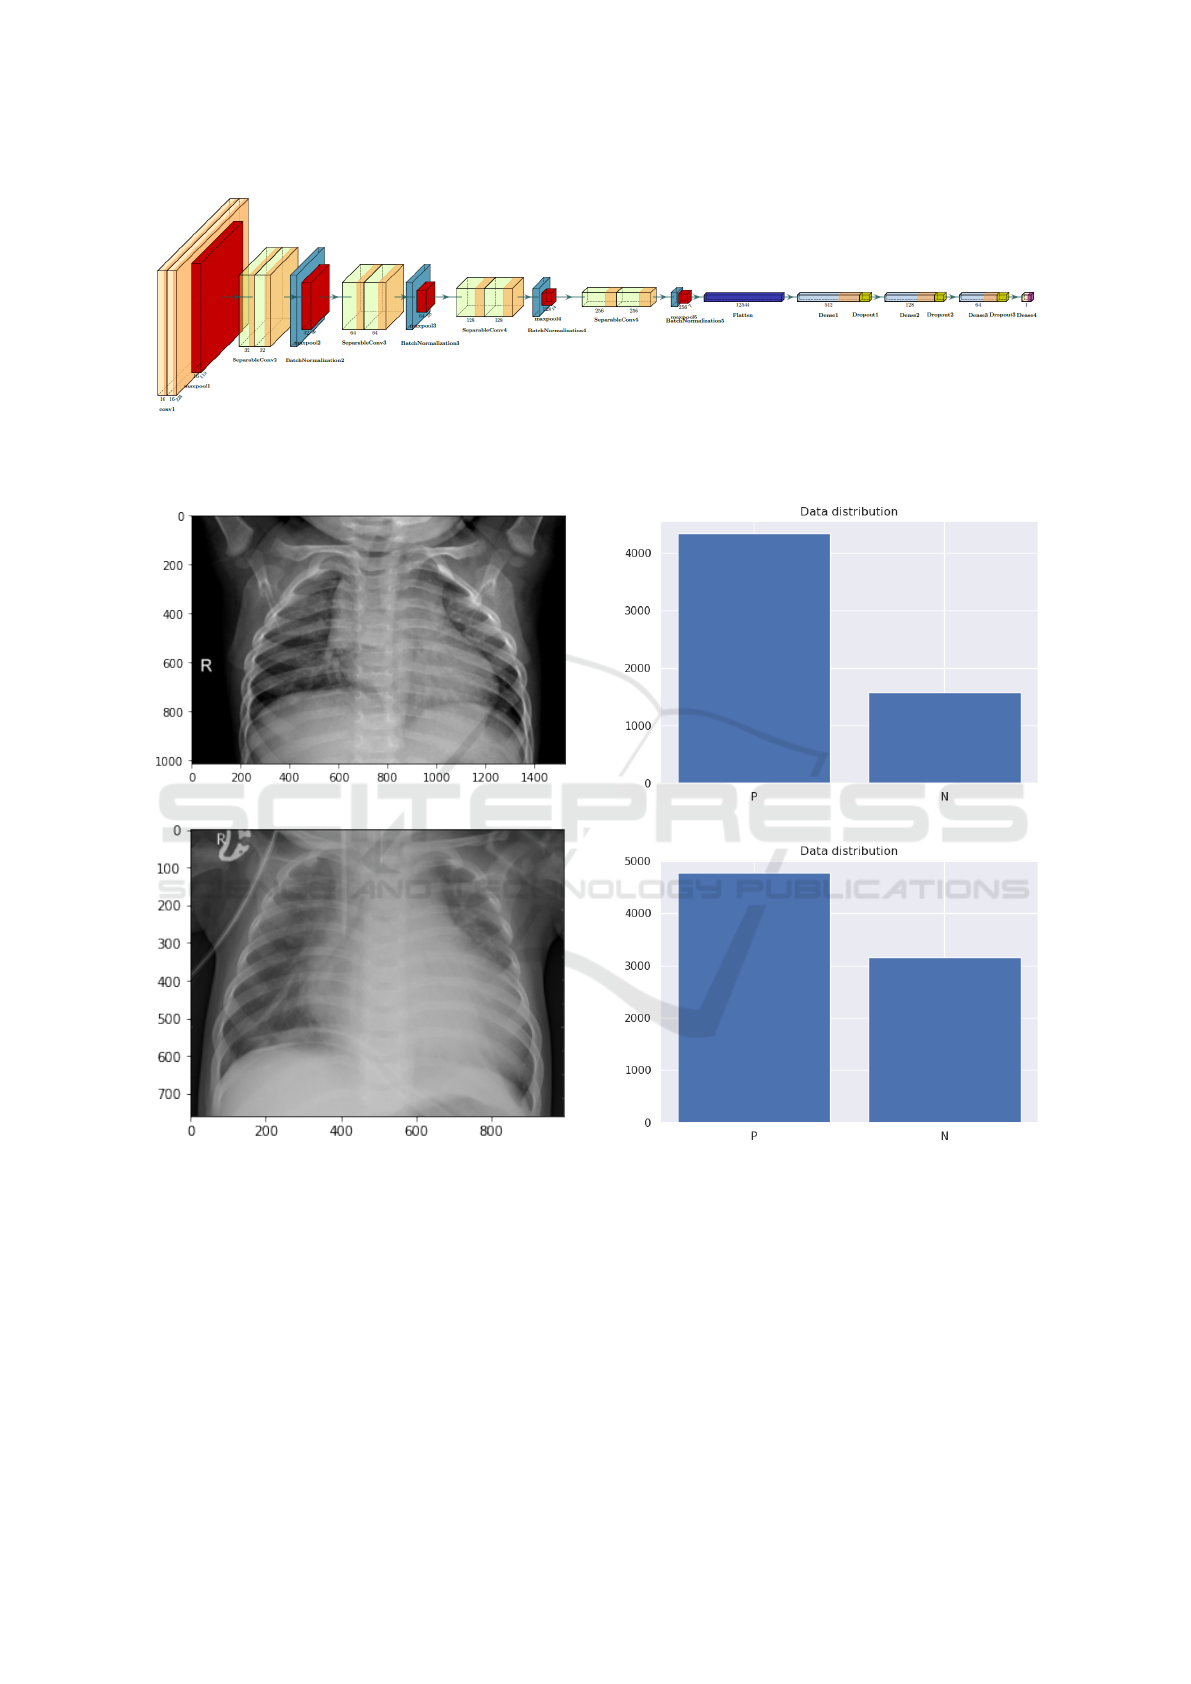
Figure 3: First stage classifier, sequential long-range connectivity can be observed as it is dedicated to pulmonary symptoms
detection from chest radiography images. The heavy use of the Spatial Separable Convolutions in the network architecture is
observed, which makes strong balance between computational efficiency and representation capacity.
(a) Normal Non-infected Lung.
(b) Pneumonia infected Lung.
Figure 4: Example chest radiography images of: (a) Normal
Lung, and (b) Pneumonia infected Lung were white spots in
the lungs (called infiltrates) that identify an infection appear.
90% training to 10% testing sets. The full data set dis-
tribution after augmentation indicated is in[Table 1].
3.3 Second Stage
Having detected Pneumonia infection, the next step
is to make sure the cause of the inflammation as
COVID-19 may share symptoms with other Bacterial
(a) Data set before augmentation.
(b) Data set after augmentation.
Figure 5: Example of covid-chestxray-data-set: (a) Data set
before augmentation, and (b) Data set after augmentation
where the number of normal class samples increased appar-
ently.
and viral infections. Generally speaking, The WHO
estimate that around 1.4 millions of children lost their
life due to the failure of detecting this lung disease at
its early stage (Acharya and Satapathy, 2020). Addi-
tionally, in the case of the COVID-19 pandemic, the
early diagnostics of viral infection play a major role
in reducing contagious spread.
Automated Model for Tracking COVID-19 Infected Cases till Final Diagnosis
147
Table 1: Data distribution of first stage.
Total Normal Pneumonia
5,910 1,576 4,334
Train 5,286 1,342 3,944
Test 624 234 390
Viral pneumonia and bacterial pneumonia are the
two types that can cause severe damages to the human
respiratory system (Hammoudi et al., 2020). Differ-
ent types of clinical management are required for the
cure of these infections. Antibiotics are used to re-
cover the bacterial infected pneumonia while viral in-
fected patients need different medication and support-
ive care for the recovery of the disease. Therefore, we
propose an accurate automated deep learning-based
method to identify the different types of pneumonia
diseases (viral/bacterial) with X-ray imaging.
3.3.1 Architecture Design
Having proved its effectiveness in the early stage, we
used the same network architecture used before [Fig-
ure 3]. The features to be detected in the second clas-
sification of the pipeline are similar to that of the first
classification step, which grantee the same architec-
ture works well for the next task as well.
The fewer computational resources and small
model parameters discussed earlier in the paper make
it an appropriate choice for this step of classification
for easily distinguishing viral pneumonia and bacte-
rial pneumonia.
3.3.2 Data Features
In the proposed stage, our main intention after identi-
fying pneumonia is to classify into its particular type
that is either viral pneumonia or bacterial pneumo-
nia. In the radiography image, in bacterial pneumonia
[Figure 6a], the alveoli become filled with the secre-
tion of the white inflammatory fluid while in the vi-
ral pneumonia [Figure 6b], the chest is infected with
the white spots (Acharya and Satapathy, 2020). Viral
and bacterial pneumonia infections are distinguished
by analyzing the amount of white substance that is
spread across the chest X-ray image.
3.3.3 Data Set Sources
We have used the same Kaggle data set used in the
early stage classifier for the training and testing of
the diseases. we exploited Chest X-ray images from
covid-chestxray-data-set at: https://www.kaggle.com/
praveengovi/coronahack-chest-xraydataset. Upon in-
vestigating the data set, it was decided to use it once
more for the second stage classifier, as the data-set
(a) Bacterial pneumonia infection.
(b) Viral Pneumonia infection.
Figure 6: Example of chest radiography images of: (a) viral
Pneumonia infected Lung filled with secretion of the white
inflammatory fluid , and (b) viral Pneumonia infected Lung
with white spots.
was already labeled with the particular type of Pneu-
monia (bacterial/viral). That is, due to its compatibil-
ity with the second stage classifier, which is used for
labeling pneumonia infection into two classes; bacte-
rial pneumonia and viral pneumonia.
3.3.4 Data Set Distribution
The data set is composed of 4, 334 X-ray pneumo-
nia images categorized previously. It is divided into
two classes: bacterial pneumonia and viral pneumo-
nia. The data-set has 47% of bacterial pneumonia im-
ages to 53% of viral pneumonia. It is split into 90%
training and 10% testing sets. The full data set distri-
bution is indicated in [Table 2].
HEALTHINF 2021 - 14th International Conference on Health Informatics
148
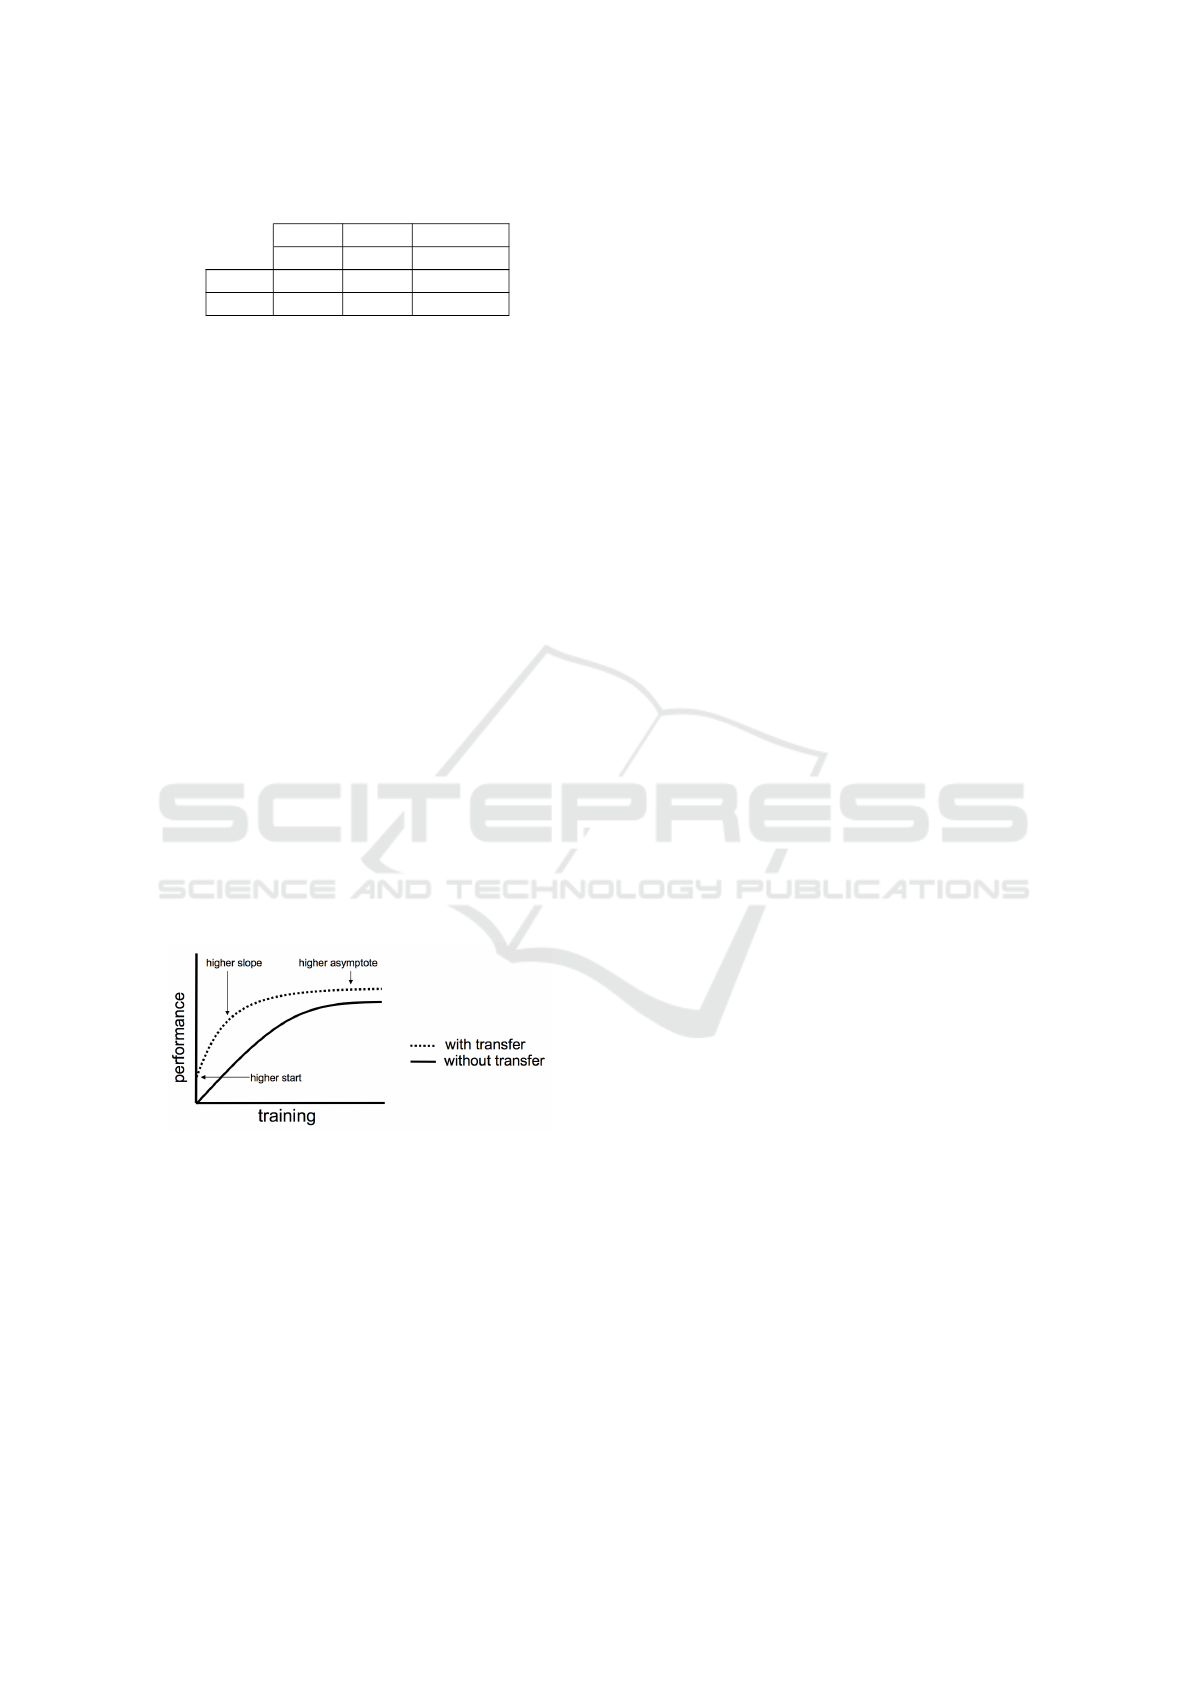
Table 2: Data distribution of second stage.
Total viral Bacterial
4,334 1,555 2,777
Train 3,942 1,407 2,535
Test 390 148 242
3.4 Third Stage
The reason for the usage of the CT-scan images in
this advanced step of the process despite the risks dis-
cussed before is that if a suspect patient reached this
step, then there is a severe need for a high accuracy
scanning method to decide the type of viral infection.
That is why the third step of the pipeline depends
on the high accuracy of CT-scan images in detecting
COVID-19.
3.4.1 Architecture Design
Exposure to publicly accessible COVID-19 related
lung CT databases for deep learning studies is quite
restricted. Few open-access X-ray image collections
of the chest are freely available. To minimize the
training data gap, although the supply of COVID-19
open-source CT-scan imagery is limited, we turn to
learn transfer. Transfer Learning is a Machine Learn-
ing technique whereby a model is trained and devel-
oped for one task, then is re-used on a second related
task. Transfer Learning is usually applied when there
is a new data-set smaller than the original data-set
used to train the pre-trained model [Figure 7](Mahbub
et al., 2018).
Figure 7: Illustration of who transfer Learning might im-
prove the learning performance. (Figure reproduced and
adapted from (Tatiana et al., 2013))
Several pre-trained models were tested until ade-
quate results were obtained. Inception-v3 is a convo-
lutional neural network that is 48 layers deep. You
can load a pre-trained version of the model trained
on more than a million images from the ImageNet
database. Inception-v3 consists of two parts; Feature
extraction part with a convolutional neural network.
Classification part with fully-connected and softmax
layers (Szegedy et al., 2016). VGG-19 is a convo-
lutional neural network that is 19 layers deep. You
can load a pre-trained version of the model trained
on more than a million images from the ImageNet
database. VGG19 is a variant of the VGG model,
which in short consists of 19 layers (16 convolution
layers, 3 fully connected layers, 5 MaxPool layers,
and 1 SoftMax layer). We can understand VGG as
a successor of the AlexNet (Simonyan and Zisser-
man, 2015). DenseNet-201 is a convolutional neu-
ral network that is 201 layers deep. You can load
a pre-trained version of the model trained on more
than a million images from the ImageNet database.
The DenseNets needs fewer parameters than a con-
ventional CNN counterpart because redundant func-
tion maps need not be taught (Huang et al., 2017).
COVID-Net is a deep convolutional layer neural net-
work architecture designed to detect COVID-19 cases
from chest CT-scan images, which are open source
and usable to the general public. It was trained on
chest x-ray data collection utilized to train COVID-
Net, which we refer to as COVIDx and consists of
16,756 chest x-ray images from two open-access data
in 13,645 patient cases (Wang and Wong, 2020).
3.4.2 Data Features
The CT-scan imaging of COVID-19 [Figure 8b],
presents several distinct manifestations according to
previous studies. The symptoms include focused
ground glass shadows primarily scattered in bilateral
lungs, numerous consolidation shadows followed by
a ’halo symbol’ of adjacent ground glass shadows in
both lungs, mesh shadows, inflating signals within the
lesions, numerous consolidations in varying sizes and
grid-shaped high-density shadows (Bernheim et al.,
2020).
3.4.3 Data Set Sources
CT scans are promising in providing accurate, fast
screening, and testing of COVID-19. There have been
several works studying the effectiveness of CT scans
in screening and testing COVID-19, and the results
are promising. However, owing to questions regard-
ing privacy. The CT scans used in such works are not
published (Yang et al., 2020).
To address this issue, we built our CT-COVID19-
data-set from several resources. We first col-
lected only COVID-19 labeled images from covid-
chestxray-dataset at: https://github.com/ieee8023/
covid-chestxray-dataset which is an open data-set of
chest X-ray and CT images of patients which are pos-
itive or suspected of COVID-19 or other viral and
bacterial pneumonia. Second, we used COVID-19
and non COVID-19 images from COVID-CT data-
set at: https://github.com/UCSD-AI4H/COVID-CT
Automated Model for Tracking COVID-19 Infected Cases till Final Diagnosis
149
(a) Non-COVID-19 infection.
(b) COVID-19 infection.
Figure 8: Example of chest CT-scan radiography images
of: (a) Non-COVID-19 infection viral Pneumonia infection,
and (b) COVID-19 viral Pneumonia infection with focused
ground glass shadows primarily scattered in bilateral lungs.
which contain CT-scans positive for COVID-19 and
is open-sourced to the public. It was confirmed by a
senior radiologist in Tongji Hospital, Wuhan, China,
who has performed diagnosis and treatment of a large
number of COVID-19 patients during the outbreak of
this disease between January and April. Finally, we
used Confirmed cases CT-scans from kaggle COVID-
19 CT scans data-set at: https://www.kaggle.com/
andrewmvd/covid19-ct-scans which is a data-set con-
taining 20 CT scans as well as segmentation of lungs
and infections made by experts. This data-set required
prepossessing as the 20 CT scans exist in form of sev-
eral layers. We prepossessed it to flatten the layers
and use the layers that only show infection.
3.4.4 Data Set Distribution
Our CT-COVID19-dataset composed of 1,255 CT-
scan images. It contains images from the three
used data-sets mentioned previously. From the first
data set, we used one non-COVID-19 image and 22
COVID-19. For the second data set, We took 389 non-
COVID-19 images and 349 COVID-19. Concern-
ing the third data set, which contains only COVID-
19 images after the pre-processing, it contributes 494
COVID-19 images.
The distribution of the final 1,255 image data-set
is 63.24% of COVID-19 images and 36.76% non-
COVID-19 images. It was split into training and test-
ing sets with the ratio 90% to 10%. The full data-set
distribution is indicated in [Table 3].
Table 3: Data distribution of third stage.
Total Non COVID COVID
1,255 390 865
Train 1,130 348 782
Test 125 42 83
4 IMPLEMENTATION DETAILS
Due to the mission-critical nature of clinical applica-
tions stating the experiment timing is crucial in the
evaluation of the current state. The experiments were
conducted during the period between May 2020 and
September 2020. The different used data-sets were
obtained, manipulated, and downloaded during the
pandemic outbreak between January 2020 and April
2020.
The proposed pipeline was constructed and tested
using the TensorFlow Backend Keras Deep Learn-
ing Software. The three pipeline stages were trained
and tested with differently tuned hyperparameters un-
til sufficient results were reached. We use the hyper-
parameters in [Table 4] for training along with using a
learning rate policy where the learning rate decreases
when learning stagnates for a period of time.
Table 4: Training hyperparameters.
Stage 1
st
2
st
3
st
optimizer adam adam adam
learning rate 2e-5 2e-5 1e-5
number of epochs 50 100 100
batch size 64 64 32
factor 0.3 0.3 0.1
patience 2 2 3
4.1 Class Activation Map (CAM)
We propose a simple technique to expose the implicit
attention of Convolutional Neural Networks on the
image. It highlights the most informative image re-
gions relevant to the predicted class. This technique
will change the output of not only the image. Now
HEALTHINF 2021 - 14th International Conference on Health Informatics
150
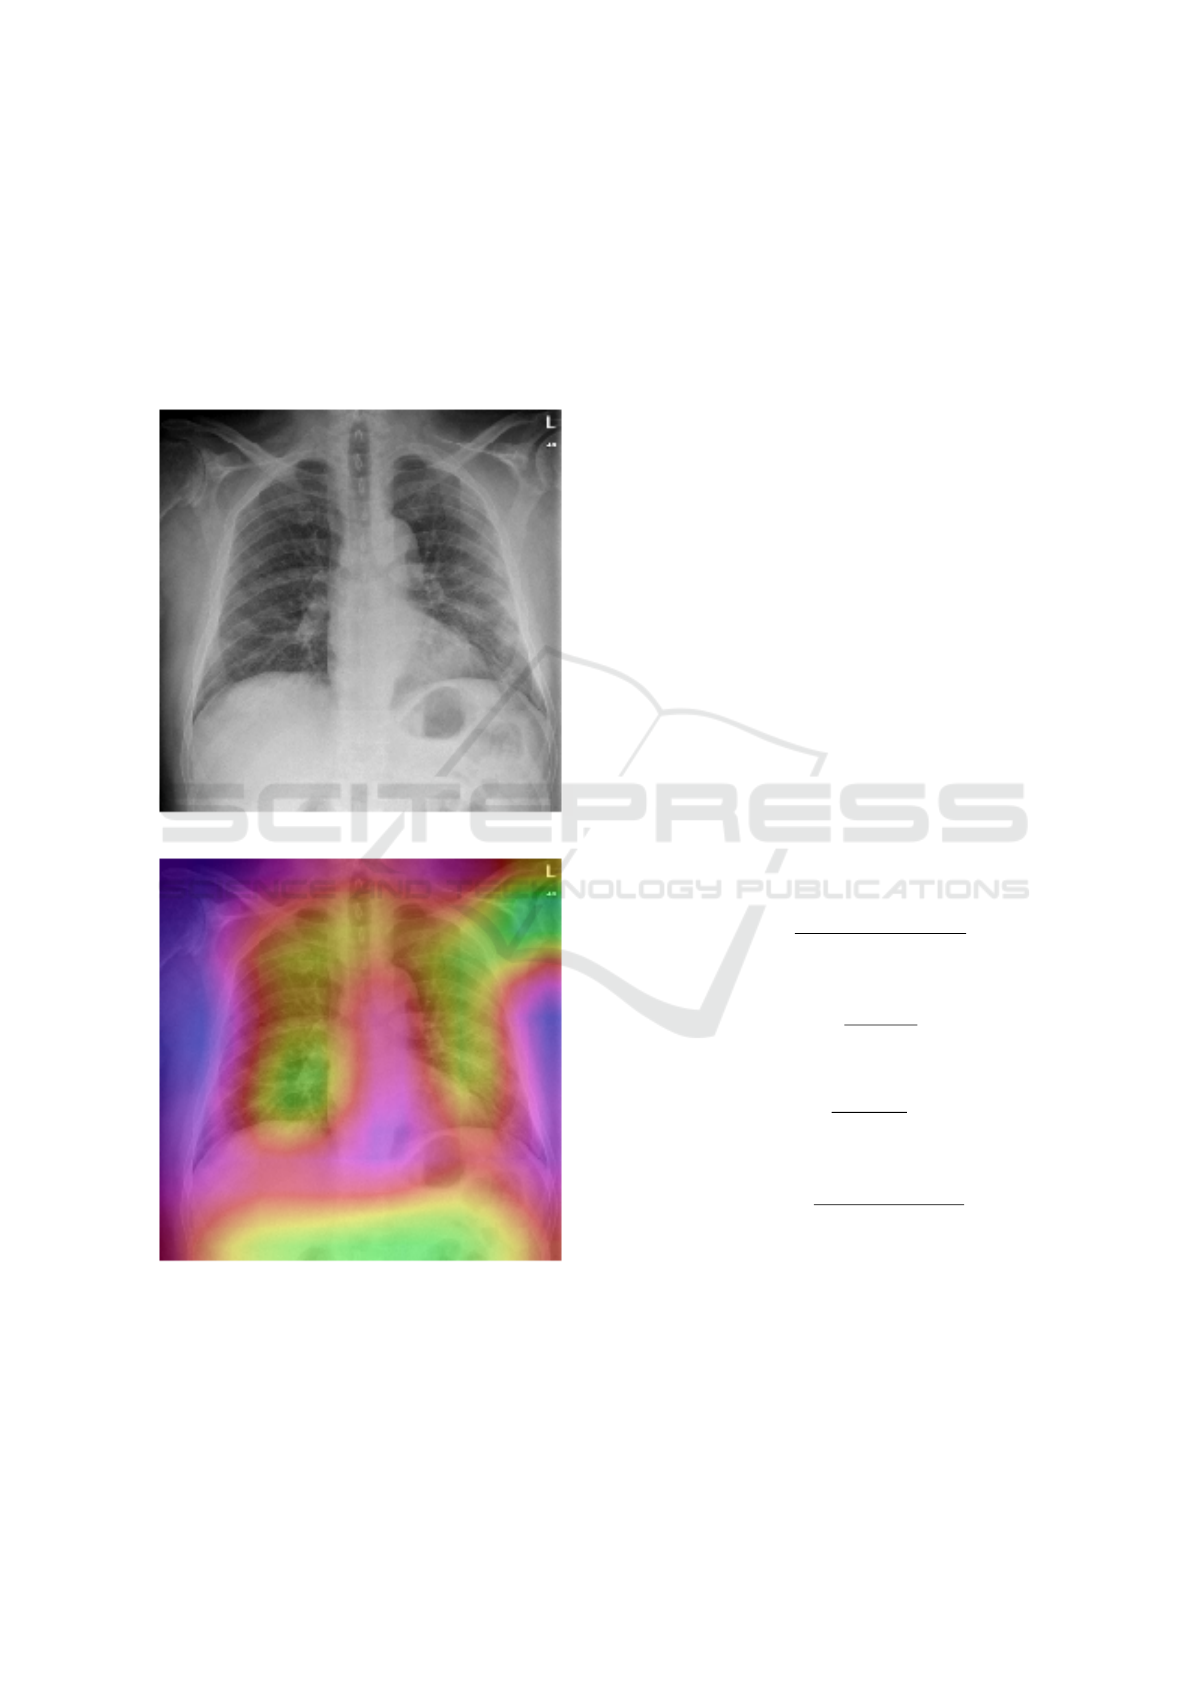
we have a heat map [Figure 9b] indicating the regions
which have a considerable impact on the classification
decision making .
The procedure of applying this technique is to di-
vide into two steps, first save the weights of the last
convolution layer, the layer just before the dense lay-
ers, and add average pooling to this layer, second use
the saved weights to visualize this impact on the input
image.
(a) Original Pneumonia Infection.
(b) Pneumonia infection with CAM.
Figure 9: Example chest radiography images of: (a) original
Pneumonia infected , and (b) Pneumonia infected with the
effect of CAM.
5 EXPERIMENTAL RESULTS
The confusion matrix is used towards measuring the
prediction correctness. Prediction correctness of the
algorithm is expressed in this 2D array, which repre-
sents a list of numbers that reports the number of false
positives, false negatives, true positives, and true neg-
atives. These values are defined as the following:
• True positives (TP): These are cases in which we
predicted yes (they have the disease), and they do
have the disease.
• True negatives (TN): We predicted no, and they
don’t have the disease.
• False positives (FP): We predicted yes, but they
don’t actually have the disease.
• False negatives (FN): We predicted no, but they
actually do have the disease.
Accuracy is the most common and easy metric to
use when measuring the output of a model. The ac-
curacy of a method determines how correct the val-
ues are predicted. The precision indicates the repro-
ducibility of the measurement or how many of the pre-
dictions are correct. Recall shows how many of the
accurate results are discovered. F
1
-score uses a com-
bination of precision and recall to calculate a balanced
average.
These metrics are often computed from a confu-
sion matrix for a binary classifier. We can redefine
accuracy as:
Accuracy =
T P + T N
T P + T N + FP + FN
(1)
Then we can check out precision as:
Precision =
T P
T P + FP
(2)
Also we can check out recall as:
Recall =
T P
T P + FN
(3)
Finally, We can check out F
1
-score as:
F
1
− score = 2
Precision.Recall
Precision + Recall
(4)
One more tool used to describe system perfor-
mance is the receiver operating characteristic (ROC)
curve. It is created by plotting the True Positive
Rate against False Positive Rate when you adjust
the threshold for granting observations to a particular
class.
[Table 5] presents the performance for classifica-
tion of normal and pneumonia cases by using the pro-
totype architecture shown in [Figure 3]. It has reached
Automated Model for Tracking COVID-19 Infected Cases till Final Diagnosis
151

best performance with an average classification accu-
racy of 87.98%. The Classification test metrics are
presented in [Table 6]. Additionally, [Figure 10a]
Shows the ROC. The ROC curve of the first stage with
threshold=0.5.
Table 5: First classifier confusion matrix.
Actual
Pneumonia Normal
Predicted
Pneumonia 329 14
Normal 61 220
Table 6: First classifier test metrics.
Accuracy Precision Recall F1-score
87.980% 95.918 % 84.359% 89.768
Similarly, [Table 7] presents performance for clas-
sification of bacterial pneumonia and viral pneumo-
nia cases with classification accuracy of 78.717% and
with test metrics shown in [Table 8]. Additionally,
[Figure 10b] Shows the ROC curve of second Stage
with threshold=0.5.
Table 7: Second classifier confusion matrix.
Actual
Viral Bacterial
Predicted
Viral 68 3
Bacterial 80 239
Table 8: Second classifier test metrics.
Accuracy Precision Recall F1-score
78.717% 95.774 % 45.946% 62.100
Next, the VGG-19 model showed High sensitiv-
ity to CT-scan images of the COVID-19 test set since
it detects COVID-19 infection with accuracy of 84%.
[Table 9] shows a particularly robust pneumonia de-
tection of COVID-infected patients and satisfying test
metrics shown in [Table 10] in third stage test metrics.
Table 9: Third classifier confusion matrix.
Actual
COVID
Non-
COVID
Predicted
COVID 40 18
Non-
COVID
2 65
Table 10: Third classifier test metrics.
Accuracy Precision Recall F1-score
84% 97% 78% 87
Finally, we now take a profound exploration into
the results of test metrics. It can be observed that the
classifiers can achieve sufficient accuracy and good
Precision, which is indicated in the very few false pos-
itive detections. Taking into consideration that many
false positives will raise the pressure on the health-
care system due to the need for extra PCR tests and
additional treatment.
6 CONCLUSIONS
In this research work, we have demonstrated a novel
approach to identify and classify the various types
of pneumonia disease. We have used different data-
sets and specific features that are relevant to the in-
fection. Compared to our intention, we have trained
our pipeline models with detecting specific features
at each stage, which makes the intended automated
Model for Tracking COVID- 19 Infected Cases till
Final Diagnosis a robust aiding tool for the medical
stuff. The system will lead to accelerating the devel-
opment of highly accurate yet practical deep learning-
based solutions for detecting COVID-19 cases from
chest radiography images that will help accelerate de-
ciding the suitable treatment protocol and limit the
contagious spread.
7 FUTURE WORKS
Future studies should improve the precision of the
differentiation between COVID-19 viral and non-
COVID-19 viral pneumonia when adequate amounts
of COVID-19 chest CT-scan images are accessible,
which would enable the precise detection of infected
patients with COVID-19, even in a non-epidemic set-
ting. Also, the robustness of the existing framework
must be validated by PCR and clinical tests field train-
ing. However, our method has given added opportuni-
ties for new clinicians to identify the particular form
of pneumonia at an early level.
ACKNOWLEDGEMENTS
We would like to thank all of those who contributed
to this work with their helpful discussion and advice.
Special Thanks To Dr.Nermin Nabile from the fac-
ulty of Medicine Alexandria University; for her med-
ical aspects advice as well, Dr. Rania ElSharkawy;
Vice President of Alexandria University for Commu-
nity Service and Environment; for her helping during
system pipeline design also, for her continuous sup-
port.
HEALTHINF 2021 - 14th International Conference on Health Informatics
152
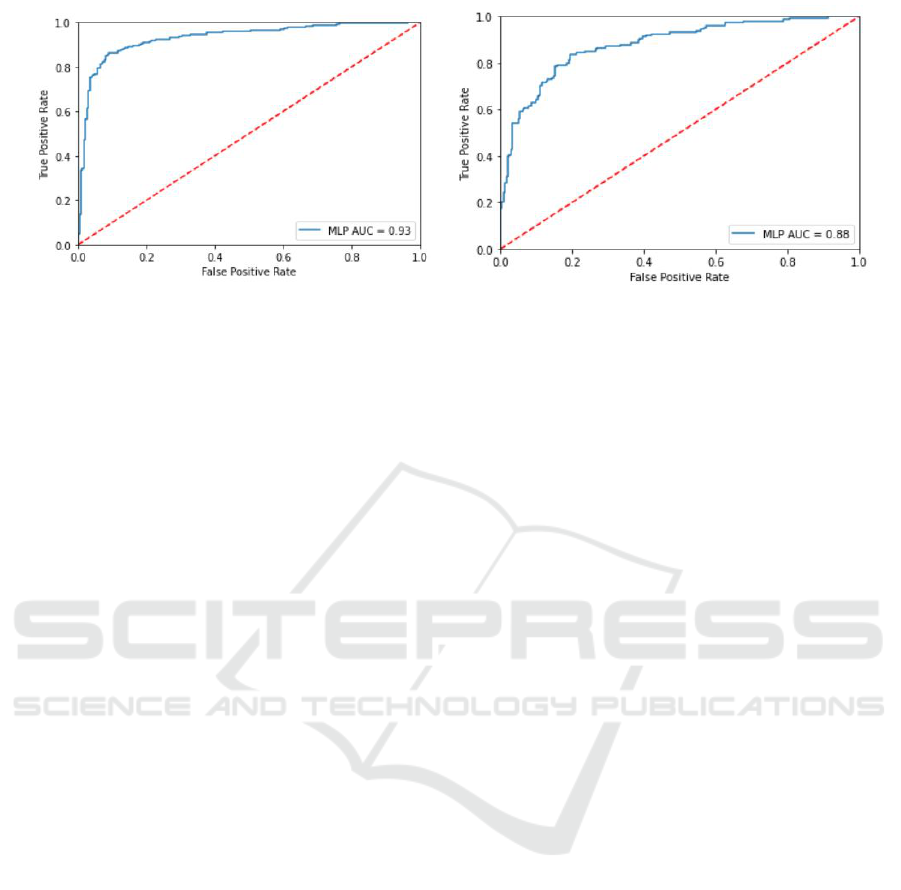
(a) ROC For first stage. (b) ROC For Second stage.
Figure 10: ROC curves representing the performance of the proposed models (a) Normal vs Pneumonia (b) Bacterial Vs Viral
Pneumonia.
REFERENCES
Acharya, A. K. and Satapathy, R. (2020). A deep learn-
ing based approach towards the automatic diagnosis
of pneumonia from chest radio-graphs. Biomedical
and Pharmacology Journal, 13(1):449–455.
Bernheim, A., Mei, X., Huang, M., Yang, Y., Fayad, Z.,
Zhang, N., Diao, K., Lin, B., Zhu, X., Li, K., Li, S.,
Shan, H., Jacobi, A., and Chung, M. (2020). Chest ct
findings in coronavirus disease-19 (covid-19): Rela-
tionship to duration of infection. Radiological Society
of North America (RSNA), 295(3):685–691.
Diaz, J. V., Baller, A., Banerjee, A., Bertagnolio, S.,
Bonet, M., Bosman, A., Bousseau, M.-C., Bucagu,
M., Chowdhary, N., Cunningham, J., Doherty, M.,
Dua, T., Ford, N., Grummer-Strawn, L., Hanna, F.,
Huttner, B., Jaramillo, E., Kerkhove, M. V., Kim,
C., Kolappa, K., Kortz, T., Lincetto, O., Mills, J.-A.,
Moja, L., Norris, S., Oladapo, O., Olumese, P., van
Ommeren, M., Penazzato, M., Portela, A., Reis, A.,
Relan, P., Rogers, L., Rollins, N., Smith, I., Sobel, H.,
Solon, M. P., Sumi, Y., Thorson, A., Trivedi, K., Vito-
ria, M., Weise, P., Were, W., and Zignol., M. (2020).
Clinical management of COVID-19. World Health Or-
ganization.
Fang, Y., Zhang, H., Xie, J., Lin, M., Ying, L., Pang, P.,
and Ji, W. (2020). Sensitivity of chest ct for covid-19:
Comparison to rt-pcr. Radiological Society of North
America (RSNA), 296(2):E115–E117.
Farag, A. T., El-Wahab, A. R. A., Nada, M., Elhakeem,
M., Mahmoud, O., Rashwan, R. K., and Sallab, A. E.
(2020). Multichexnet: A multi-task learning deep net-
work for pneumonia-like diseases diagnosis from x-
ray scans. ArXiv, abs/2008.01973.
Hammoudi, K., Benhabiles, H., Melkemi, M., Dornaika, F.,
Arganda-Carreras, I., Collard, D., and Scherpereel, A.
(2020). Deep learning on chest x-ray images to detect
and evaluate pneumonia cases at the era of covid-19.
ArXiv, abs/2004.03399.
Huang, G., Liu, Z., and Weinberger, K. Q. (2017). Densely
connected convolutional networks. 2017 IEEE Con-
ference on Computer Vision and Pattern Recognition
(CVPR), pages 2261–2269.
Khalifa, N., Taha, M., Hassanien, A., and Elghamrawy,
S. M. (2020). Detection of coronavirus (covid-
19) associated pneumonia based on generative ad-
versarial networks and a fine-tuned deep transfer
learning model using chest x-ray dataset. ArXiv,
abs/2004.01184.
Li, Y. and Xia, L. (2020). Coronavirus disease 2019
(covid-19): Role of chest ct in diagnosis and man-
agement. American Journal of Roentgenology (AJR),
214(6):1280–1286.
Mahbub, H., Jordan, B., and Diego, F. (2018). A study on
cnn transfer learning for image classification. Annual
UK Workshop on Computational Intelligence.
Mahmud, T., Rahman, M. A., and Fattah, S. A. (2020). Cov-
xnet: A multi-dilation convolutional neural network
for automatic covid-19 and other pneumonia detec-
tion from chest x-ray images with transferable multi-
receptive feature optimization. Computers in Biology
and Medicine, 122.
Rahman, T., Chowdhury, M. E. H., Khandakar, A., Islam,
K. R., Islam, K. F., Mahbub, Z. B., Kadir, M. A., and
5, S. K. (2020). Transfer learning with deep convolu-
tional neural network (cnn) for pneumonia detection
using chest x-ray. Applied Sciences, 10(9):3233.
Rajpurkar, P., Irvin, J., Zhu, K., Yang, B., Mehta, H., Duan,
T., Ding, D., Bagul, A., Langlotz, C., Shpanskaya,
K., Lungren, M. P., and Ng, A. Y. (2017). Chexnet:
Radiologist-level pneumonia detection on chest x-rays
with deep learning. ArXiv.
Schmidt, C. W. (2012). Ct scans: Balancing health risks and
medical benefits. Environmental Health Perspective,
120(3):a118–a121.
Simonyan, K. and Zisserman, A. (2015). Very deep con-
volutional networks for large-scale image recognition.
CoRR, abs/1409.1556.
Szegedy, C., Vanhoucke, V., Ioffe, S., Shlens, J., and Wojna,
Z. (2016). Rethinking the inception architecture for
computer vision. 2016 IEEE Conference on Computer
Automated Model for Tracking COVID-19 Infected Cases till Final Diagnosis
153

Vision and Pattern Recognition (CVPR), pages 2818–
2826.
Tatiana, T., Francesco, O., and Barbara, C. (2013). Learn-
ing categories from few examples with multi model
knowledge transfer. IEEE transactions on pattern
analysis and machine intelligence, 36.
Wang, L. and Wong, A. (2020). Covid-net: A tailored
deep convolutional neural network design for detec-
tion of covid-19 cases from chest x-ray images. ArXiv,
abs/2003.09871.
Wang, W., Xu, Y., and Gao, R. (2020). Detection of sars-
cov-2 in different types of clinical specimens. The
Journal of the American Medical Association (JAMA),
323(18):1843–1844.
Xu, X., Jiang, X., Ma, C., Peng, Li, X., Shuangzhi, Yu, L.,
Chen, Y., Su, J., Lang1, G., Li, Y., Zhao, H., Xu, K.,
Ruan, L., and Wu, W. (2020). Deep learning system
to screen coronavirus disease 2019 pneumonia. Engi-
neering.
Yang, X., He, X., Zhao, J., Zhang, Y., Zhang, S., and Xie,
P. (2020). Covid-ct-dataset: A ct scan dataset about
covid-19. ArXiv, abs/2003.13865.
HEALTHINF 2021 - 14th International Conference on Health Informatics
154
