
UX Design and Evaluation of Warning Alerts for Semi-autonomous Cars
with Elderly Drivers
Luka Rukonic
1 a
, Marie-Anne Pungu Mwange
2 b
and Suzanne Kieffer
1 c
1
Institute for Language and Communication, Universit
´
e Catholique de Louvain, Louvain-la-Neuve, Belgium
2
AWTC Europe, Avenue de l’Industrie 19, Braine-L’Alleud, Belgium
Keywords:
Video Prototypes, Formative Evaluation, Autonomous Driving, Senior Drivers, User-centred Design.
Abstract:
This paper presents a study on user experience (UX) design and evaluation of warning systems intended for
older adults in semi-autonomous cars. We used combinations of visual, auditory, and speech modalities to
design the warning alerts and created three low-fidelity, video-based prototypes. We conducted user tests with
elderly drivers, both in the lab and remotely, within a test-and-refine approach involving three experiments.
The methods used for data collection included Wizard of Oz, standard questionnaires and interviews. We
collected qualitative user feedback and self-reported ratings of user experience and cognitive load. We report
on the iterative development of our design solution, findings from these user studies, and our methodological
insights, that UX researchers and practitioners could use in similar settings.
1 INTRODUCTION
As the automotive industry is making progress to-
wards driving automation, drivers are embracing
many technological advancements. Several publica-
tions discuss how to enhance the driver-car interaction
and help drivers adapt to the different levels of au-
tonomous driving (Str
¨
omberg et al., 2019; Debernard
et al., 2016). However, elderly drivers have often been
left out of scope (Young et al., 2017) although they
represent a growing market for the automotive indus-
try. In 2017, people above 65 accounted for almost
one-fifth of the European population (Eurostat, 2017),
and by 2050, they might account for one-sixth of the
total population (United Nations, 2019). One of the
few studies focused on elderly drivers (Schmargen-
dorf et al., 2018) shows that despite concerns about
security issues, system failures or hacking attacks, el-
derly drivers have a large interest for Autonomous Ve-
hicles (AVs). Specifically, the benefits associated with
AVs include increased safety, shorter traveling times,
and more comfortable driving. Furthermore, accord-
ing to R
¨
odel et al. (2014), seniors are much more fa-
vorable toward future autonomous cars compared to
younger drivers. Therefore, it is vital to ensure that
the design of automotive Human Machine Interfaces
a
https://orcid.org/0000-0003-1058-0689
b
https://orcid.org/0000-0003-2971-6347
c
https://orcid.org/0000-0002-5519-8814
(HMI) caters to their specific needs and gives them a
sufficient amount of trust to adopt the technology.
During the quest toward automation, the automo-
tive industry has developed various Advanced Driver
Assistance Systems (ADAS) that are already available
in modern cars to bring more safety, comfort and plea-
sure while driving (Insurance Institute for Highway
Safety (IIHS), 2020). Amongst them, Lane Keeping
Assistant (LKA) and Adaptive Cruise Control (ACC)
allow the driver to supervise the driving rather than di-
rectly controlling the car. This enables the first level
of autonomy according to the Society of Automotive
Engineering (SAE). Next are levels 2 and 3 that let
the car perform takeovers and make complex deci-
sions, but require the driver to always be aware of the
road situation and be ready to drive when requested.
If the vehicle fails to cope with the road situation,
the takeover request will be issued and the driver will
need to take back the control (SAE, 2018). Zhou et al.
(2019) identified four topics pertinent to the takeover
situations in autonomous driving: (1) drivers being
aware of whether the vehicle can continue operating
safely in given conditions; (2) the system’s capabil-
ity of warning drivers for any dangers or conditions
requiring the driver to take over; (3) automation capa-
bility awareness; (4) warning effectiveness.
This paper focuses on topics 3 and 4 and reports
how we designed and tested warning alert systems
in semi-AVs with the goal of ensuring that elderly
Rukonic, L., Mwange, M. and Kieffer, S.
UX Design and Evaluation of Warning Alerts for Semi-autonomous Cars with Elderly Drivers.
DOI: 10.5220/0010237000250036
In Proceedings of the 16th International Joint Conference on Computer Vision, Imaging and Computer Graphics Theory and Applications (VISIGRAPP 2021) - Volume 2: HUCAPP, pages
25-36
ISBN: 978-989-758-488-6
Copyright
c
2021 by SCITEPRESS – Science and Technology Publications, Lda. All rights reserved
25

drivers of level 2 or level 3 cars are well informed
of the danger while driving. To achieve this goal, we
created and tested low-fidelity video-based prototypes
and explored different combinations of modalities to
notify the driver of the surrounding events: visual,
non-verbal auditory and voice outputs. We adopted
an iterative test-and-refine approach, which allowed
us to rapidly set up user tests and improve the proto-
types between iterations. During three successive ex-
periments, we collected and analyzed data about the
user experience (UX), the cognitive load and the par-
ticipants’ subjective responses to the proposed proto-
types.
2 RELATED WORK
The contribution from the human-computer interac-
tion (HCI) community to AVs for elderly drivers fo-
cuses on safety features but remains insufficient (Rhiu
et al., 2015). We try to fill this gap building on prior
studies applied to danger awareness. Specifically,
we selected the most common modalities used to in-
form senior drivers reported in the literature: voice
messages, beep sounds, and visual messages. Se-
nior drivers have difficulties detecting tactile stimuli
and they pay more attention to the road than younger
drivers when they are engaged in secondary tasks
even when the car is driving in semi-autonomous
mode (Huang and Pitts, 2020). Additionally, we used
the words ”Danger”, ”Warning” and ”Notice” to con-
vey urgency as a function of the distance from the
critical road situation, as Baldwin and Lewis (2014)
reported that the perceived urgency of the word ”Dan-
ger” was higher than the words ”Warning” and ”No-
tice”. Finally, using more annoying sounds results in
faster reaction times in handover and takeover situa-
tions (Kutchek and Jeon, 2019). These studies also
recommend keeping the duration of the sounds short,
not to delay the driver’s reaction.
Most studies use advanced driving simulators to
perform experiments and rely on quantitative data col-
lected from a larger sample of participants (Gerber
et al., 2019; Koo et al., 2015; Kutchek and Jeon, 2019;
Politis et al., 2015). In this work, we used a video-
based driving simulation that allowed us to conduct
tests remotely during the coronavirus outbreak. Video
prototypes were previously used to examine drivers’
memory for auditory alerts (Nees et al., 2016), to
check whether owner’s manuals can help drivers bet-
ter understand car’s automation capabilities (Boel-
houwer et al., 2019), as a design technique for human-
vehicle interactions (Pettersson and Ju, 2017), and the
HMI design for highly automated driving (Richard-
son et al., 2018). In addition, we decided to focus on
a thorough qualitative analysis collected on a smaller
sample of users. We made this choice in hope of hav-
ing a better understanding of underlying user needs
that will be used in the future development of proto-
types and allow for the collection of behavioral data.
3 METHODOLOGY
We performed three experiments (designated in the
following XP1, XP2, XP3) within a formative UX
design approach in order to (1) investigate elderly
drivers’ subjective responses about the proposed dan-
ger alert system and (2) explore the application of
voice interaction in the context of warning effective-
ness in semi-autonomous cars. The formative ap-
proach allowed us not only to receive early feedback
to be incorporated into the prototype of the future
system, but also to identify the target users’ needs.
Furthermore, we relied on cost-efficient prototyping
methods, namely video prototyping and Wizard of Oz
(WOz) to quickly iterate on our design solutions in an
industrial setting.
In addition, we wanted to identify which of the
following seven types of alerts would provide users
with the best possible warning: (C1) speech only
(VB), (C2) sound only (S), (C3) visual-only (V), (C4)
speech + sound (VB + S), (C5) speech + visual (VB
+ V), (C6) visual + sound (V + S), and (C7) speech +
sound + visual (VB + S + V). We used C1; C3-C7 in
XP1 and XP2, and C1-C6 in XP3. We eliminated C2
from XP 1 and XP2 because we assumed that the sole
use of beeping sounds with no additional information
regarding the upcoming danger would not be useful
to drivers. We reintroduced it in XP3 because we as-
sumed this might trigger the interaction between the
car and the driver. We removed C7 from XP3 as this
condition was judged too complex by the participants
from XP1 and XP2.
3.1 Data Collection Methods
We used questionnaires and interviews as data collec-
tion methods. We used the user experience question-
naire (UEQ), a standard instrument for evaluating UX
constructed and validated by Laugwitz et al. (2008),
which measures the perceived UX across six scales:
Attractiveness (AT), Perspicuity (PS), Dependability
(DP), Efficiency (EF), Novelty (NV), and Stimulation
(ST). PS, DP, and EF measure the pragmatic attributes
of UX, ST and NV the hedonic attributes of UX. At-
tractiveness is considered separately. UEQ helps to
determine the areas of improvement, indicating what
HUCAPP 2021 - 5th International Conference on Human Computer Interaction Theory and Applications
26

experiental qualities need improvement to impact UX
the most (Schrepp et al., 2014). NASA-Task Load In-
dex (NASA-TLX) is a post-task six-dimensional scale
designed to assess the subjective workload of the par-
ticipants while performing a task. It is widely used
due to its easy administration and a relatively wide
range of application domains such as aviation, mili-
tary, automobile drivers, and healthcare (Hart, 2006).
Most studies report its use in relation to interface
design and evaluation. NASA-TLX consists of two
parts. In the first part, the participants need to identify
the sources of workload to obtain the weights for each
of the six scales. In the second part, participants rate
the workload of the task on each of the six subscales.
In XP3 we added a Single Ease Questionnaire (SEQ)
to measure the ease of use of the warning system.
We modeled the first two experiments similarly to
Frison et al. (2019), in which the authors used the
laddering technique defined by Reynolds and Gutman
(1988) to probe the participants to discover the under-
lying psychological needs while driving an automated
vehicle. We used the laddering technique to ask ques-
tions about participants’ understanding of warnings,
their opinion about them, and the further clarifica-
tion of ratings in the standard questionnaires adminis-
tered to them. The quantitative data collected through
UEQ, SEQ and TLX helped us explain the qualitative
findings gained from the interviews in more detail and
explore the thoughts and attitudes of participants as a
part of the iterative UX design process.
3.2 Participants
We recruited senior drivers, older than 50, through a
recruiting agency. They were all active drivers, with
more than 20 years of driving experience, interested
in AVs, and reported frequent use of ADAS (LKA,
AAC) and GPS systems. Six participants (1 female)
aged between 64 and 75 (M=68.5, SD=3.819) partic-
ipated in XP1. They were all in good health and did
not have any type of physical disabilities. Six condi-
tions (C1, C3-C7) were presented to each participant,
resulting in 36 trials overall.
Six participants (2 females) aged between 52 and
75 (M=66.5, SD=7.251) participated in XP2. Five
had participated to XP1, one had not. We recruited
the same participants for two reasons. First, we work
in a formative approach where we frequently design
and evaluate system prototypes with a small sample
of users. Second, for organizational purposes, we did
not have to go through the recruitment process again,
which included finding new participants and conduct-
ing interviews with them.
Six participants (2 females) aged between 55 and
69 (M=61.17, SD=5.269) participated in XP3. They
were all different from the participants in experi-
ments 1 and 2. We divided the participants into two
groups. One group only saw the conditions contain-
ing visual warnings (C3,C5,C6), while the second
group only saw the conditions without visual warn-
ings (C1,C2,C4), resulting in 18 trials overall.
3.3 Procedure
Figure 1: The experimental procedure.
Fig. 1 shows the experimental procedure. First, the
researcher explained to participants the study proce-
dure without revealing the underlying research ques-
tions. After signing a consent form, participants an-
swered a few demographic questions and filled out
a questionnaire regarding their attitude towards AVs
Boelhouwer et al. (2019). XP1 took place in a lab
room where the participants sat in front of a big-
screen TV, next to which a smaller screen-sized laptop
was placed, simulating the car’s infotainment screen
and displaying the visual warning messages. Speech
messages and beep sounds were played through a set
of stereo speakers placed behind the TV. In exper-
iments 2 and 3, we used a remote testing method,
where the participants and the researcher were on dif-
ferent physical locations, the researcher moderating
the session using an online tool for remote user re-
search. We videotaped each session.
We instructed participants to imagine they were
driving an AV with a limited ability to deal with
on-road situations and the situation might request a
takeover. However, no driver response was ever re-
quired. Thus, their task was to pay attention to and
understand the road situation and warning alerts, sim-
ilar to what they would have done in an SAE level 3
car. The experiment began after explaining the sce-
nario to the participants. After each condition, the
researcher would ask questions such as ”What hap-
pened in the video?”, ”What do you think about the
warning alerts?”, ”What were you focused on during
the drive?” or similar follow-up questions to better un-
derstand the participant’s reasoning. Afterward, the
researcher administered the NASA-TLX. In XP3, the
SEQ rating sheet preceded the NASA-TLX. At the
end of the session, participants completed the UEQ.
UX Design and Evaluation of Warning Alerts for Semi-autonomous Cars with Elderly Drivers
27
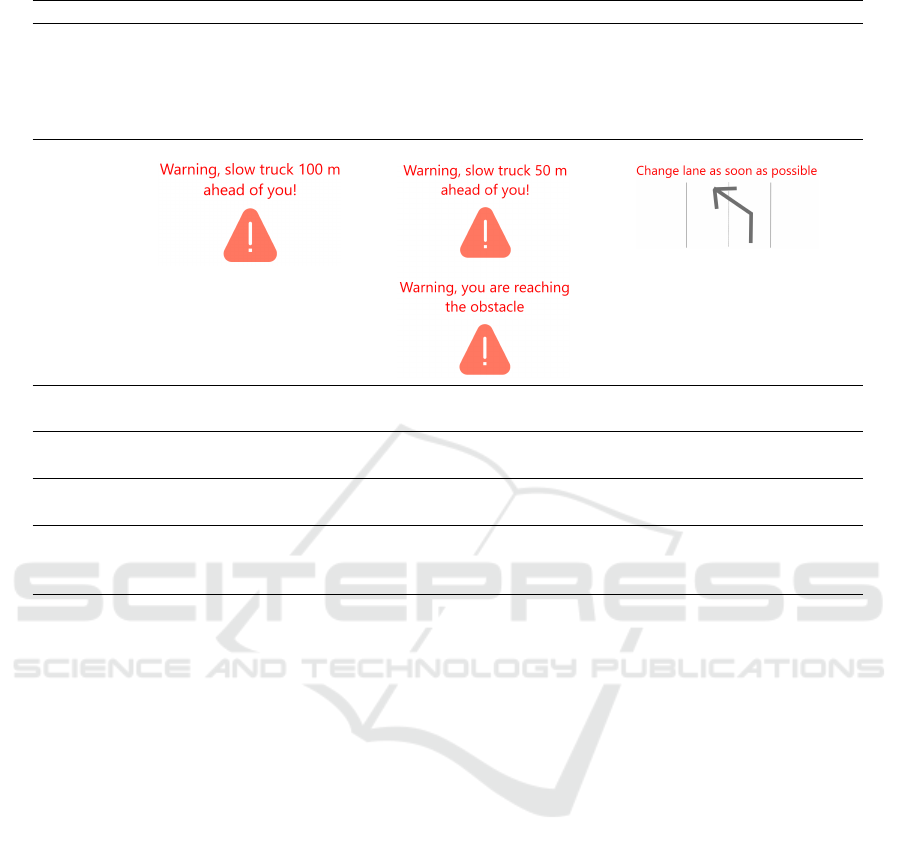
Table 1: Design of warnings for experiment 1.
Condition Low Urgency (LU) Medium Urgency (MU) High Urgency (HU)
C1 (VB) Voice message: ”Hey,
there is a slow truck on
the road in 100 m. Pay
attention!”
Voice messages: ”Be vig-
ilant, a slow truck in
the right lane in 50 m.”;
”Warning! You are ap-
proaching an obstacle!”
Voice message: ”Slow
down and change the lane
as soon as possible.”
C3 (V)
C4
(VB+S)
Voice message as in C1 +
beep sound
Voice message as in C1 +
beep sound
Voice message as in C1 +
beep sound
C5
(VB+V)
Voice message as in C1 +
visual warnings as in C3
Voice message as in C1 +
visual warnings as in C3
Voice message as in C1 +
visual warnings as in C3
C6 (V+S) Visual warnings as in C3 +
beep sound
Visual warnings as in C3 +
beep sound
Visual warnings as in C3 +
beep sound
C7
(VB+V+S)
Voice message as in C1 +
Visual warnings as in C3 +
beep sound
Voice message as in C1 +
Visual warnings as in C3 +
beep sound
Voice message as in C1 +
Visual warnings as in C3 +
beep sound
4 EXPERIMENT 1
In all conditions, we used the same video prototype
simulating a car equipped with ADAS functions such
as LKA, AAC and autonomous overtake. Such simu-
lation corresponds to SAE level 3 of automation. The
driving scenario consisted of highway driving, where
the car warned the driver about an obstacle ahead,
overtook a long truck in the right lane by going to the
left lane and subsequently returned to the right lane.
The video lasted 80 seconds. We reused a part of the
video from the public dataset made available by the
DR(eye)VE project (Palazzi et al., 2018).
4.1 Warnings
The warnings (Table 1) involved three levels of ur-
gency similarly to Politis et al. (2015): low-urgency
(LU) at the beginning of the scenario, medium-
urgency (MU) before reaching the obstacle and high-
urgency (HU) immediately before reaching the obsta-
cle. The video followed a low-medium-high sequence
of urgency. The level of urgency is defined as a func-
tion of the distance between the car and the obstacle or
a dangerous event. The warnings were not repeated.
We wrote the voice alert messages which were then
produced using a Text-To-Speech (TTS) system. We
used a warm-toned male voice, speaking with a stan-
dard British accent, conveying authority but also em-
pathy. We worked with developers to write the con-
tent of the messages using informal language. As
the prototype also involved sound alerts, we down-
loaded a beep sound from http://freesound.org avail-
able under Creative Commons license, free for any-
one to use, modify, and distribute. The visual warn-
ings consisted of textual messages along with the
commonly used red triangle, which is known to be the
most recognized sign by drivers (Luoma and R
¨
am
¨
a,
2001). Sometimes, a descriptive image of the upcom-
ing car operation was added, such as lane change.
In our warning design approach, we thought about
the driver’s awareness of the situation. Therefore,
the sequence of warnings should prepare the driver
well enough and in advance for the upcoming dan-
ger. Thus, HU warning messages already assume the
driver is aware of the situation, and only give them a
last alert or notice about the following action. In fact,
that is why the triangle is omitted in HU.
HUCAPP 2021 - 5th International Conference on Human Computer Interaction Theory and Applications
28

4.2 Quantitative Results
Figure 2 shows the mean UEQ scores per dimension.
The prototype scored lowest on the pragmatic qual-
ities, namely, DP (1.08), and EF (1.88). These low
scores can be attributed to a lack of direct interaction
with the prototype. The prototype scored higher on
AT (2.08), PS (2.17), ST (2.17) and NV (1.92) Ac-
cording to the UEQ benchmark, values above +2 are
considered very positive, and below -2 as very nega-
tive. Although the values we obtained are high, except
for DP, our sample is probably too small to achieve
high precision with respect to the benchmark. A high
PS score tells us that the warnings are easy to get fa-
miliar with, while AT signifies that participants’ im-
pression of the system was positive.
4.3 Qualitative Results
We performed an exploratory thematic analysis of the
data collected during interviews (Table 2). Generally,
participants reported that the voice messages were too
friendly and too long, referring to other systems using
polite words such as please or having a friendly tone,
which they do not appreciate. Timely and coherent
warning about the upcoming danger should suffice.
This finding is in line with previous research on au-
tonomous car’s voice alerts where a higher level of
assertiveness results in faster reaction times and con-
veys a higher level of perceived urgency (Wong et al.,
2019). Thus, we decided to shorten the voice alerts
and make them more assertive.
Participants often mentioned that visual warnings
are distracting and contain too much text. When us-
ing voice and visual warnings together, the text in
visual warnings should correspond to the content of
the voice messages. That reduces the workload while
comparing what is being said and what is being shown
on the screen. The beep sound is considered use-
ful for preparatory purposes and drawing the driver’s
attention before hearing or seeing the actual warn-
ing. But, the beep should be followed by the warn-
ing without a delay. Additionally, the beep sound
was not very pleasant. The participants consistently
reported that the warnings should give precise infor-
mation about the upcoming event. In our case with
a slow-moving truck, the warning mentioning an ob-
stacle ahead makes the drivers think about static ob-
jects on the road that impede the traffic flow, which
increases confusion and stress. Finally, there should
be a difference between warning messages and simple
informative messages.
5 EXPERIMENT 2
XP2 aimed to fix some issues in the design of warn-
ings, confirm the findings from XP1 and collect par-
ticipants’ feedback once again. We built a new pro-
totype based on a video that we recorded ourselves.
Using a front-mounted camera in the car, we recorded
several situations while driving on the highway. We
selected the situation displaying the roadworks in the
left-most lane of a three-lane highway. Lane change
was required. The video lasted 80 seconds. We used
the same six conditions (C1, C3-C7), resulting in 36
trials overall. We added the TLX: after the first con-
dition, participants identified the sources of workload;
after each condition, participants filled out a TLX rat-
ing sheet. Finally, we used remote testing setting with
videoconferencing instead of a lab setting.
5.1 Improved Warnings
We synchronized visual warnings with other modal-
ities and moved them from a separate screen to the
video screen, thus simulating a Head-Up Display
(HUD). We assumed this would make it more effi-
cient for the drivers to see the visual warnings, com-
pared to when they are displayed aside (e.g. on a car’s
infotainment screen). We also reduced the amount of
text included in visual warnings. In addition, we se-
lected another beep sound, which had a duration of
2.797 seconds. Finally, we rewrote the voice alerts to
be more informative and direct, but less friendly. We
used the same voice as in XP1 (Table 3).
5.2 Quantitative Results
Compared to XP1, AT, PS, and DP scores increased
to 2.194, 2.208, and 1.50, respectively. EF, ST, and
NV decreased to 1.75, 1.54, and 1.58, respectively
(Figure 2). A t-test revealed no significant differences
between mean scores for all scales between XP1 and
XP2 (α < .10). The DP score is the lowest in both ex-
periments, 1.083 and 1.50 respectively. The EF score
is second lowest in both experiments. This could be
attributed to the properties of the experimental design.
The participants were only watching the video and ob-
serving the situation, thus scoring low on feeling in
control and ease of use. Therefore, the results reflect
the lack of control and interaction between the car and
the driver, as well as imply that participants need to
make a lot of effort to understand the warnings.
We calculated the means of the unweighted TLX
scores for each subscale and the overall TLX score
(Table 6). Mental demand and temporal demand were
the dominant sources of workload in XP2. Condi-
UX Design and Evaluation of Warning Alerts for Semi-autonomous Cars with Elderly Drivers
29
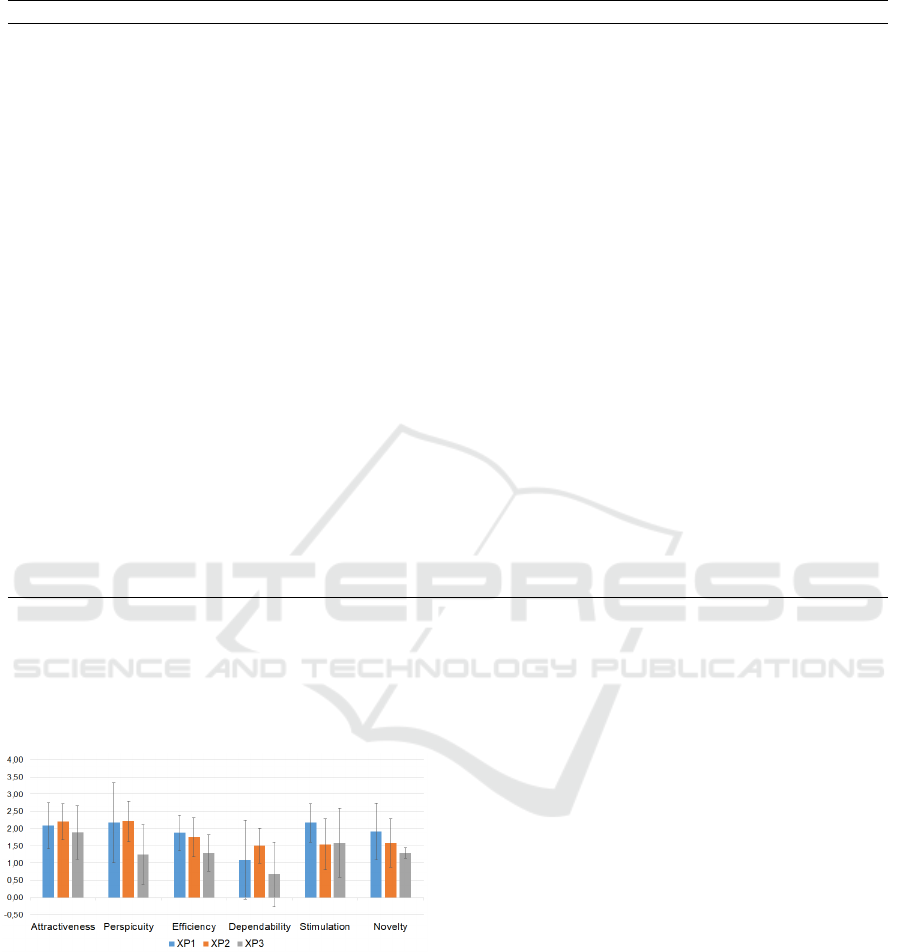
Table 2: Thematic analysis of the participants feedback in experiment 1.
Theme Code Frequency Condition Participant
Attention Beep draws attention 5 C3, C7 P4, P5, P6
Attention Visuals can easily be missed 3 C3, C6 P2, P3, P4
Attention Delay between the beep and visual warnings 2 C6 P5
Attention Visual warnings are distracting 2 C3 P4, P6
Attention Simple to follow with voice and visuals 1 C5 P3
Attention Voice warnings allow me to focus on the road 1 C1 P4
Attractiveness Voice is too friendly 3 C1, C5 P2, P5
Attractiveness Voice would interrupt music 1 C6 P2
Content Truck is not an obstacle 3 C1, C7 P2
Cognitive Load Too much information 4 C4, C7 P2, P3, P5
Cognitive Load Voice messages are too long 3 C1, C4, C7 P6
Cognitive Load System talks too much 2 C1, C4 P2
Cognitive Load Visuals and voice are too demanding 2 C5 P4, P5
Cognitive Load Concurrent reading and listening is difficult 2 C5,C6 P2
Cognitive Load Listening is easier than reading 1 C5 P2
Preference Beep and voice is preferred 2 C6, C7 P6
Preference Voice warnings not necessary 1 C7 P3
Preference Voice warnings are preferred 1 C3 P4
Preference Visual warnings and beep are preferred 2 C1,C3,C5 P3,P4
Stress Beep is annoying 4 C1, C4, C6 P2, P4
Stress Voice warnings become annoying on long-term 2 C4, C6 P3
Stress Beep is stressing 1 C4 P4
Usefulness Voice warnings are useful 2 C1, C5 P4
Usefulness Visual warnings are not useful 3 C3 P6
Usefulness Beep sound is confusing 1 C6 P3
tions containing visual warnings have a higher mean
TLX score (34.6), compared to the conditions with-
out visual warnings (29.1). Unimodal combinations
(C1,C3) and multimodal combinations (C4-C7) have
a mean score of 31.3 and 33.5, respectively.
Figure 2: Mean UEQ scores between XP1, XP2 and XP3.
5.3 Qualitative Findings
Table 4 summarizes the thematic analysis of the
participants’ subjective feedback. Most participants
found the beep warning useful and pleasant and
agreed that it drew their attention and worked well
in combination with other modalities. Similarly, par-
ticipants agreed that voice warnings were useful and
concise, although sometimes lacking dynamics or be-
ing bothersome. In fact, there is a concern that voice
warnings might be intrusive, disturbing for some
drivers, which could lead to a loss of interest for them.
One participant expressed concerns related to the inte-
gration of voice warnings with other voice-based sys-
tems already present in the car.
Most participants found visual warnings distract-
ing, which is also reflected in TLX scores when visual
warnings are present. Some stated that listening is
easier and some that visual warnings are easy to miss
while driving. Even after we decreased the amount
of text, the visuals still required a high level of at-
tention. Participants stated that visual warnings could
serve well as a backup in situations where they would
miss the voice warning, to check it manually. This
finding is in line with previous research reporting that
text-only warnings are the longest to process and are
the least preferred by participants (Cao et al., 2009).
Two participants expressed the need for a repeat op-
tion. This additional feature might be useful in the
case drivers would miss the alert, e.g., while listening
to the radio or talking to other passengers in the car.
HUCAPP 2021 - 5th International Conference on Human Computer Interaction Theory and Applications
30
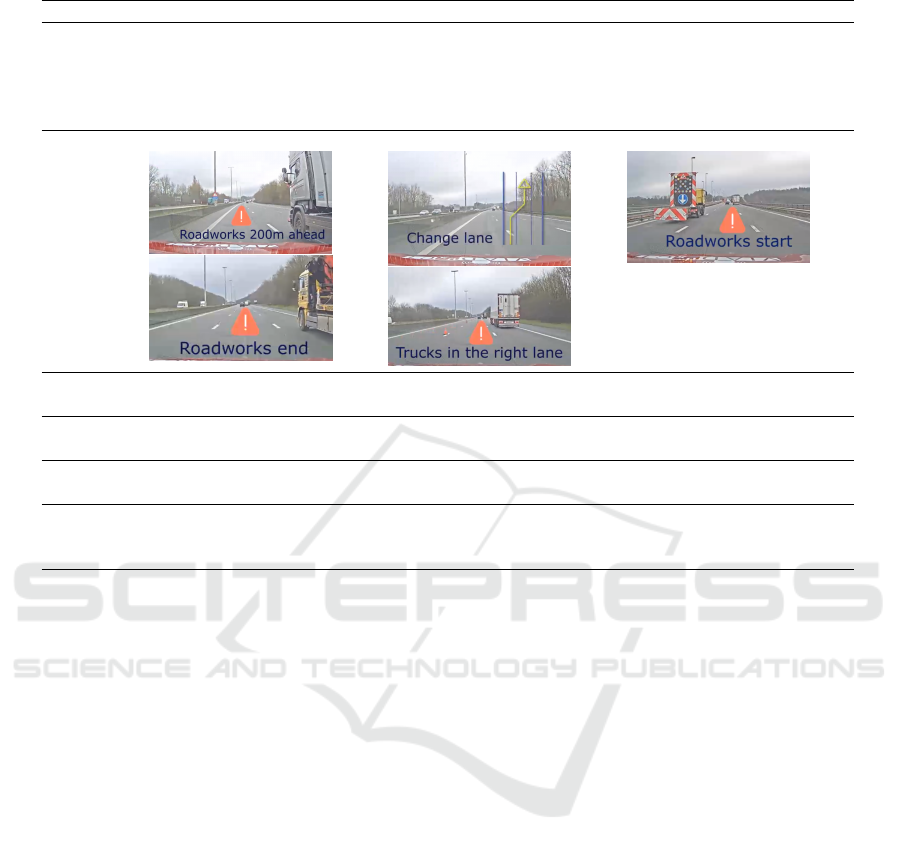
Table 3: Design of warnings for experiment 2.
Condition Low Urgency (LU) Medium Urgency (MU) High Urgency (HU)
C1 (VB) Voice message: ”Notice!
There are roadworks in the
left lane in 200m. Pay at-
tention!”
Voice messages: ”Warning!
I am going to the middle
lane now.”; ”Notice! Pay
attention to the truck in the
right lane.”
Voice message: ”Warning!
You are approaching the
roadworks in the left-most
lane. Be careful!”
C3 (V)
C4
(VB+S)
Voice message as in C1 +
beep sound
Voice message as in C1 +
beep sound
Voice message as in C1 +
beep sound
C5
(VB+V)
Voice message as in C1 +
visual warnings as in C3
Voice message as in C1 +
visual warnings as in C3
Voice message as in C1 +
visual warnings as in C3
C6
(V+S)
Visual warnings as in C3 +
beep sound
Visual warnings as in C3 +
beep sound
Visual warnings as in C3 +
beep sound
C7
(VB+V+S)
Voice message as in C1 +
Visual warnings as in C3 +
beep sound
Voice message as in C1 +
Visual warnings as in C3 +
beep sound
Voice message as in C1 +
Visual warnings as in C3 +
beep sound
6 EXPERIMENT 3
XP3 aimed to investigate if and how drivers inter-
act with warning alerts assuming they are driving an
SAE level 3 car. The driving context consisted of
city driving with medium traffic density. The con-
ditions C1-C6 were shown to the participants. In
a between-subjects design, half of the participants
were exposed to conditions without visual warnings
(C1,C2,C4), and half to the conditions with visual
warnings (C3,C5,C6). We also administered the SEQ
after each condition to evaluate the users’ task diffi-
culty on a 7-point scale. We simulated the vocal sys-
tem of the car with a WOz, a prototyping method in-
volving a human operator (wizard) to simulate one or
more parts of the system while the user is interacting
with it. WOz is relevant in the early design stages
of systems involving speech and gestures, as it allows
the exploration of different design alternatives. WOz
is often used to study the design of automotive user
interfaces (Pettersson and Ju, 2017), commuter expe-
rience in autonomous cars (Krome et al., 2017), and
for real-time observation and interaction prototyping
in vehicles (Martelaro and Ju, 2017). We developed
a simple web application coupled to a TTS module to
simulate the voicebot. The first author moderated the
session, while the second was in the role of a wizard,
invisible to the participants.
6.1 Interaction Design
We instructed participants that their task was to mon-
itor the road and follow the warning alerts. The wiz-
ard supported the following tasks: alerting the driver
about the obstacles ahead, repeating the warning, ex-
plaining the warning to the driver, and explaining why
is the car making certain manoeuvres. They had to
start each new interaction sequence with the keyword
”Tony”, which was the name of the voice assistant.
We told participants to use natural language when in-
teracting and to try to stay within the limits of the
supported tasks. However, the wizard still tried to
address participants’ requests that were out of scope
whenever possible. This led us to even more discov-
eries. To better understand whether drivers would in-
teract with their car about the warnings, we counted
the number of times participants triggered interaction
(”pull requests”). We hypothesized that there would
be more pull requests when participants are exposed
to unimodal conditions, such as C1 and C3. The video
lasted 5 minutes.
UX Design and Evaluation of Warning Alerts for Semi-autonomous Cars with Elderly Drivers
31

Table 4: Thematic analysis of the participants’ feedback for experiment 2.
Theme Code Frequency Condition Participant
Adaptation Attention to voice alerts could fade over time 1 C1 P4
Attractiveness Beep is pleasant 3 C4,C6 P2,P4,P5
Attractiveness Voice messages are too long 2 C1,C4 P5
Attractiveness Voice messages are concise and friendly 1 C4 P4
Attractiveness The voice messages lack dynamics 1 C1 P6
Attractiveness Voice is friendly 1 C7 P6
Attention Beep draws attention 6 C1,C3-C6 P1,P3,P4,P6
Attention Reading is distracting 2 C3 P1
Attention Voice messages are disturbing 2 C1,C7 P4
Attention Repeating the warnings would be distracting 1 C1 P4
Attention The beep announces an event 1 C6 P4
Attention Beep signifies importance 1 C4 P1
Completeness Visual warnings only are not sufficient 3 C3,C6 P6
Completeness Voice message is enough 1 C1 P2
Customization Repeat option is needed 4 C1,C4,C6,C7 P1,P6
Customization On-demand explanation is needed 1 C1 P3
Comfort Voice messages are tiring 1 C1 P4
Cognitive Load Visual warnings are distracting 9 C1,C3,C5,C6 P1,P2,P4,P6
Cognitive Load Listening is easier 5 C1,C3,C5-C7 P1,P2
Cognitive Load Too much information 3 C7 P2,P5,P6
Cognitive Load Voice messages are lighter to process 1 C5 P4
Cognitive Load Voice warnings are too detailed 1 C5 P1
Cognitive Load Visual messages are concise 1 C6 P5
Integration Mix of voice and visual warnings is heavy 1 C5 P5
Interruption Only critical alerts can interrupt the music 2 C3,C4 P3,P6
Interruption Annoying if voice alert interrupts music 1 C5 P4
Interruption Beep interruption is better 1 C5 P4
Perception Position of the visual warnings is not good 3 C3,C5 P2
Perception Visuals-only are too easy to miss 2 C3 P6
Perception Voice warnings are easy to miss 1 C4 P4,P6
Preference Beep and visual message is the best 4 C1,C3,C7 P3,P4,P5
Preference Beep and voice message is the best 2 C5,C7 P2
Reassurance Warnings make me feel safe . 3 C3,C4,C7 P3,P6
Reassurance Visual warnings are a good backup 2 C5 P3, P6
Stress Warnings make me feel uneasy 1 C7 P6
Stress Warnings are too close to the road event 1 C7 P3
Stress Missing the warning is stressful 1 C1 P6
Stress Voice messages are stressful 1 C5 P6
Stress Missing the warning is dangerous 1 C6 P6
Usefulness Sound and visual message when driving 1 C1 P3
Usefulness Warnings give a lot of helpful information 1 C7 P6
Usefulness Visual description of lane change is useful 1 C6 P1
Visual Design Visual warnings are clear 3 C3 P1,P4
6.2 Warnings
Assuming that the drivers would interact with the sys-
tem, we decided to include the condition C2. But we
excluded the condition C7 because using three modal-
ities proved to be too complex in the two previous
experiments. Furthermore, the new scenario did not
include the HU level, but only LU and MU. This de-
cision was made because HU situations would not
give enough time to the participant to interact with
the car. Conditions C1,C4,C5 contained voice warn-
ings that were always pushed to the driver. LU voice
warnings all started with the word ”notice”, and con-
sisted of traffic jam alerts (”Notice! Queue of cars in
50 meters. Slowing down.”), side hazards (”Notice!
Stopping to give priority.”), and lane change (”Notice!
HUCAPP 2021 - 5th International Conference on Human Computer Interaction Theory and Applications
32
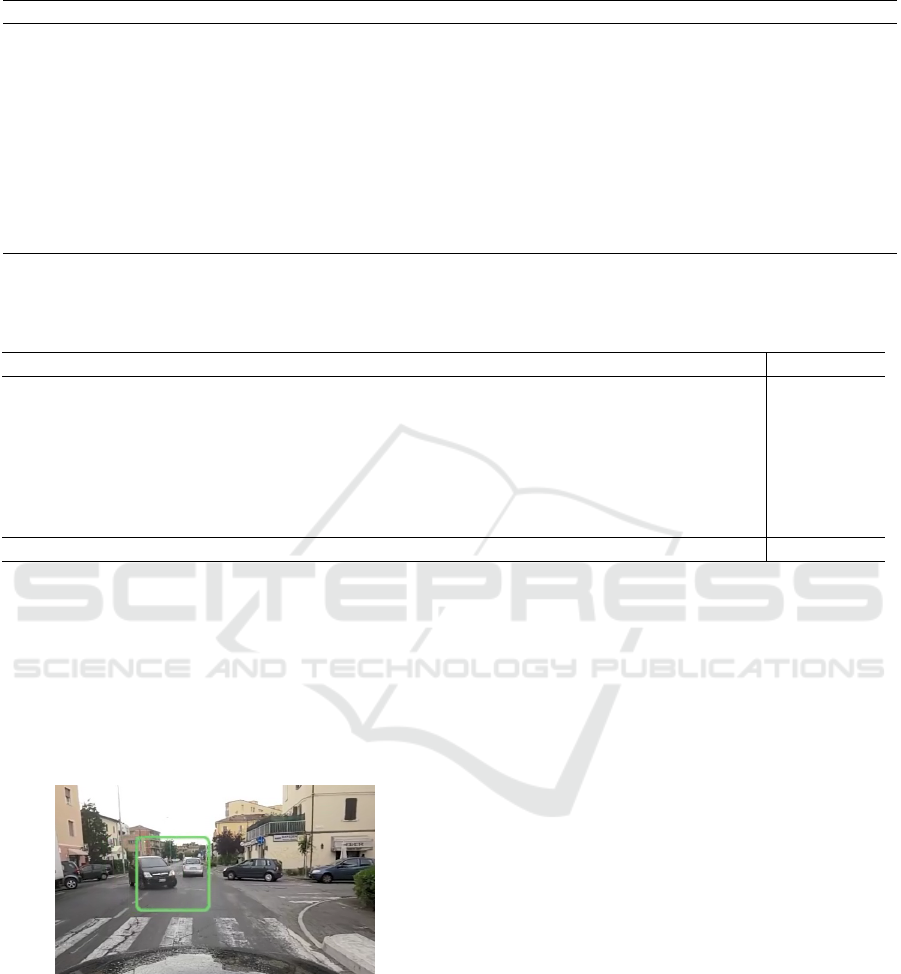
Table 5: Thematic analysis of the participants’ feedback for experiment 3.
Theme Code Frequency Condition Participant
Responsiveness System not responsive to commands 5 C1,C4,C5 P1,P4-P6
Responsiveness System not responding fast enough 4 C1-C3,C6 P1,P2,P4
Driving style Disapproving with driving style 9 C1-C3,C5 P1-P3,P5
Confusion Understanding of warnings 3 C1,C2 P3
Preference Voice notifications are preferred 3 C6 P4,P5
Preference Beep is needed 2 C4,C6 P4,P5
Adaptability Reaction to negative feedback is needed 8 C2-C6 P1,P2,P4-P6
Trust Voice notifications are reassuring 5 C2,C3,C4 P1,P2,P4,P6
Learnability Voice messages allow to get to know the system 5 C3,C6 P2,P3,P5,P6
Comfort Voice messages are interrupting 3 C3,C4 P1,P3,P6
Table 6: NASA-TLX Subscale Scores. MD = Mental Demand; PD = Physical Demand; TD = Temporal Demand; P =
Performance; E = Effort; F = Frustration; M = Mean; CD = Condition.
MD PD TD P E F M
CD XP2 XP3 XP2 XP3 XP2 XP3 XP2 XP3 XP2 XP3 XP2 XP3 XP2 XP3
C1 35 52,5 21,7 16,7 35,8 35 30 11,7 23,3 16,7 28,3 20 29 25,4
C2 - 56,7 - 15 - 41,7 - 15 - 48,3 - 38,3 35,8
C3 46,7 75 32,5 45 35 87,5 39,2 87,5 25,8 80 22,5 90 33,6 77,5
C4 35 51,7 20,8 15 40,8 50 34,2 26,7 21,7 30 22,5 25 29,2 33,1
C5 44,2 66,7 18,3 33,3 40 56,7 37,5 35 39,2 40 26,7 26,7 34,3 43,1
C6 48,3 65 30,8 33,3 45,8 63,3 22,5 46,7 30,8 60 27,5 43,3 34,3 51,9
C7 58,3 - 29,2 - 50 - 34,2 - 37,5 - 26,7 - 39,3 -
M 44,6 61,3 25,6 26,4 41,2 55,7 32,9 37,1 29,7 45,8 25,7 40,6 33,3 44,5
Slowing down to change the lane.”). MU voice warn-
ings started with the word ”warning” and consisted
of pedestrian alerts (”Warning! Pedestrian crossing
the road!”), collision avoidance (”Warning! Slowing
down to avoid collision.”), and side hazards (”Warn-
ing! Car on the right!”). We used green (LU) and
orange (MU) bounding boxes (Fig. 3) to highlight the
obstacle visually.
Figure 3: Bounding boxes as visual warnings used in XP3.
6.3 Quantitative Results
Regarding the interaction, we measured a similar
number of pull requests in both experimental groups.
Specifically, the group exposed to visual warnings
and the group exposed to non-visual warnings had
5.33 and 5.57 pull requests on average, respectively.
Again, visual warnings were positively correlated to
the higher cognitive load. The mean TLX score in the
group containing visual warnings is generally higher
(53.3), compared to the mean TLX score in a group
without visual warnings (31.5). Mental demand, tem-
poral demand, and effort were the dominant sources
of workload (Table 6). The prototype used in XP3
scored higher on overall cognitive load compared to
XP2. Also, we calculated the mean scores of the
SEQ for each condition. The analysis revealed that
it was easier to monitor the road situation and fol-
low the warnings when there were no visual warnings
(SEQ 5.78), compared to when the visual warnings
are used (SEQ 4.89). Pearson’s correlation shows that
the TLX and SEQ scores are negatively correlated,
r(7)= -.79, p<.05 for the group with visuals, and r(7)=
-.72, p<.05 for the group without visuals.
Regarding UEQ, ATT score was 1.89 which con-
firms that participants generally liked the prototype.
However, DP decreased significantly, indicating that
users did not feel in control. Also, compared to XP2,
EF also decreased significantly, confirming our find-
ing that the system’s reaction time was a little slow.
Low PS score tells us that participants had difficul-
ties getting familiar with the system, which is also
reflected in the qualitative findings and confirmed by
the fact that participants often tried unsupported tasks.
Therefore, improving the pragmatic aspects of the
prototype and evaluating it in a more immersive con-
UX Design and Evaluation of Warning Alerts for Semi-autonomous Cars with Elderly Drivers
33

text, would perhaps result in better UX. ST remained
almost unchanged with a score of 1.58, meaning that
participants found the system relatively fun to use.
Although NV decreased to 1.29, we could conclude
that the prototype scored well on hedonic qualities.
6.4 Qualitative Results
Table 5 presents the main findings from the thematic
analysis. Generally, it was unclear for the partici-
pants how they should interact with the car. First,
because they might not be used to voice interaction.
Second, because they did not know what they should
ask. However, participants still tried some unsup-
ported features and commented on the car’s driving
style, often requested the car to slow down, tried con-
trol the speed or change the route. Lack of control
frustrated some participants. They also expected the
car to react to their negative feedback and thought that
the car would learn based on it. Participants often
asked why is the car making certain decisions, such
as taking turns or giving way to other cars from side
streets. Occasionally, they would not understand the
warnings and would ask for an explanation from the
car. In all conditions, except C4, there was one par-
ticipant that did not record any interaction with the
car. Additionally, some participants would just re-
spond with simple ”okay” or ”thank you” when they
heard the warning. This might indicate that at least a
third of drivers are not willing to use their voice as a
primary communication modality with their car.
7 DISCUSSION
We used the same experimental design in XP1 and
XP2. We improved the prototype in XP2 based on the
feedback received in XP1 and recruited the same par-
ticipants to evaluate the changes. This choice resulted
in receiving similar user feedback in both experi-
ments. However, regardless of whether we performed
the experiment remotely or in the lab, the results
were accurate. Recruiting the participants matching
the user profile of the target users rather than having
the same participants would be a better methodolog-
ical choice. First, it would compensate for the learn-
ing effects among participants between experiments.
However, this is not always easy to mitigate, due to
business or organizational constraints. Second, the
purpose of formative evaluations is to test-and-refine
prototypes based on the qualitative feedback received
from small sample participants, not to check for statis-
tical differences as is the case in experiments involv-
ing large sample participants. We recruited six partic-
ipants for each experiment, which complied with both
the formative approach (Tullis and Albert, 2013) and
our organizational constraints (time and budget).
In our UX evaluation, we administered three ques-
tionnaires to collect quantitative data, coupled with
the laddering technique to collect qualitative data.
Despite the richness of data collected, it made the ex-
periments last long. For example, the TLX question-
naire requires a long administration procedure where
the participants must read the instructions, identify
the weights of each dimension, understand the rat-
ing scales well, and consistently recall their defini-
tions throughout the study. This disrupted a consistent
flow of the experiment and required the researcher to
remind the participants of the meaning of the rating
scales. Relying on the TLX Raw might be a better
idea, as proposed in the literature (Hart, 2006). UEQ
provides more useful information regarding the po-
tential areas of improvement and it focuses on ex-
periential qualities which we believe is important in
exploratory phases of UX evaluation. Furthermore,
video prototyping proved to be an efficient way to
collect early feedback from target users regarding the
warning modalities and the content of warning alerts.
We have not included the measurement of ecolog-
ical validity in this work as it was out of the scope of
our study. Ecological validity is the statistical corre-
lation between a proximal cue and the distal variable
to which it relates (Kieffer, 2017). In our study, the
proximal cues refer to the traits or characteristics of
the setting perceived by participants during the con-
trolled experiments (e.g. driving on the highway),
while the distal variables refer to the actual traits of
the environment (e.g. watching a video of highway
driving on a screen). As future work, we intend to
compare the ecological validity between the three fol-
lowing experimental settings. First, the remote testing
of video prototypes. Second, the immersive simula-
tor studies in the lab. Third, driving a real car on the
road. In particular, we will assess ecological valid-
ity by comparing participants’ feelings of immersion
between the three settings and participants’ behavior
between the three settings. This will allow us to assess
the extent to which participants’ experimental behav-
ior corresponds to the expected functional behavior
toward which we wish to generalize (Kieffer, 2017).
8 CONCLUSION
This paper presents a study on the UX design and
evaluation of a senior-friendly warning system for
autonomous vehicles. To that end, we created low-
fidelity video-based prototypes and investigated sev-
HUCAPP 2021 - 5th International Conference on Human Computer Interaction Theory and Applications
34

eral combinations of output modalities to notify the
driver about the road situation ahead. The analysis
of qualitative and quantitative data shows that speech
messages were effective in conveying the warning in-
formation to drivers. We also found that visual warn-
ings are generally considered distracting and cause
a higher workload. Still, participants see the visual
warnings as a good backup to voice warnings. Voice
interaction with a car seems to be a novelty to elderly
drivers. Within a formative approach, we recommend
recruiting new participants for each experiment while
maintaining the sample size between 6 and 8 individ-
uals in order to control the learning effect with the
task and discover new design opportunities. Regard-
ing standardized questionnaires, we found the usage
of TLX and UEQ to gather information on the po-
tential areas of improvement suitable to our domain.
These findings, we believe, should be useful for prac-
titioners and researchers involved in the design and
development of features for semi-autonomous vehi-
cles, such as voice-based interfaces, chat-bots, or road
sign assistance.
ACKNOWLEDGEMENTS
The authors acknowledge the support by the project
VIADUCT under the reference 7982 funded by Ser-
vice Public de Wallonie (SPW), Belgium.
REFERENCES
Baldwin, C. L. and Lewis, B. A. (2014). Perceived urgency
mapping across modalities within a driving context.
Applied Ergonomics, 45(5):1270–1277.
Boelhouwer, A., van Dijk, J., and Martens, M. H. (2019).
Turmoil Behind the Automated Wheel. In HCI in
Mobility, Transport, and Automotive Systems, volume
11596, pages 3–25, Cham. Springer.
Cao, Y., Castronovo, S., Mahr, A., and M
¨
uller, C. (2009).
On timing and modality choice with local danger
warnings for drivers. In Proceedings of the 1st In-
ternational Conference on Automotive User Inter-
faces and Interactive Vehicular Applications, Auto-
motiveUI ’09, page 75–78, New York, NY, USA. As-
sociation for Computing Machinery.
Debernard, S., Chauvin, C., Pokam, R., and Langlois, S.
(2016). Designing human-machine interface for au-
tonomous vehicles. IFAC-PapersOnLine, 49(19):609
– 614. 13th IFAC Symposium on Analysis, Design,
and Evaluation ofHuman-Machine Systems HMS
2016.
Eurostat (2017). A look at the lives of the elderly in the eu
today.
Frison, A.-K., Wintersberger, P., Liu, T., and Riener, A.
(2019). Why do you like to drive automated? a
context-dependent analysis of highly automated driv-
ing to elaborate requirements for intelligent user inter-
faces. In Proceedings of the 24th International Con-
ference on Intelligent User Interfaces, IUI ’19, page
528–537, New York, NY, USA. Association for Com-
puting Machinery.
Gerber, M. A., Schroeter, R., and Vehns, J. (2019). A video-
based automated driving simulator for automotive ui
prototyping, ux and behaviour research. In Proceed-
ings of the 11th International Conference on Automo-
tive User Interfaces and Interactive Vehicular Appli-
cations, AutomotiveUI ’19, page 14–23, New York,
NY, USA. Association for Computing Machinery.
Hart, S. G. (2006). Nasa-task load index (nasa-tlx); 20
years later. Proceedings of the Human Factors and
Ergonomics Society Annual Meeting, 50(9):904–908.
Huang, G. and Pitts, B. (2020). Age-related differences
in takeover request modality preferences and atten-
tion allocation during semi-autonomous driving. In
Gao, Q. and Zhou, J., editors, Human Aspects of IT for
the Aged Population. Technologies, Design and User
Experience, pages 135–146, Cham. Springer Interna-
tional Publishing.
Insurance Institute for Highway Safety (IIHS) (2020). Ad-
vanced driver assistance.
Kieffer, S. (2017). Ecoval: Ecological validity of cues
and representative design in user experience evalua-
tions. AIS Transactions on Human-Computer Interac-
tion, 9(2):149–172.
Koo, J., Kwac, J., Ju, W., Steinert, M., Leifer, L., and
Nass, C. (2015). Why did my car just do that? Ex-
plaining semi-autonomous driving actions to improve
driver understanding, trust, and performance. Interna-
tional Journal on Interactive Design and Manufactur-
ing, 9(4):269–275.
Krome, S., Holopainen, J., and Greuter, S. (2017). Au-
toplay: Unfolding motivational affordances of au-
tonomous driving. In Automotive User Interfaces,
pages 483–510. Springer.
Kutchek, K. and Jeon, M. (2019). Takeover and handover
requests using non-speech auditory displays in semi-
automated vehicles. In Extended Abstracts of the 2019
CHI Conference on Human Factors in Computing Sys-
tems, CHI EA ’19, New York, NY, USA. Association
for Computing Machinery.
Laugwitz, B., Held, T., and Schrepp, M. (2008). Construc-
tion and Evaluation of a User Experience Question-
naire. HCI and Usability for Education and Work,
5298:63–76.
Luoma, J. and R
¨
am
¨
a, P. (2001). Comprehension of pic-
tograms for variable message signs. Traffic Engineer-
ing & Control, 42(2):53–58.
Martelaro, N. and Ju, W. (2017). WoZ Way: Enabling Real-
Time Remote Interaction Prototyping & Observation
in On-Road Vehicles. Accepted: Proceedings of the
20th ACM Conference on Computer-Supported Coop-
erative Work & Social Computing, pages 169–182.
Nees, M. A., Helbein, B., and Porter, A. (2016). Speech
Auditory Alerts Promote Memory for Alerted Events
UX Design and Evaluation of Warning Alerts for Semi-autonomous Cars with Elderly Drivers
35

in a Video-Simulated Self-Driving Car Ride. Human
Factors, 58(3):416–426.
Palazzi, A., Abati, D., Calderara, S., Solera, F., and Cuc-
chiara, R. (2018). Predicting the driver’s focus of
attention: the dr(eye)ve project. IEEE Transac-
tions on Pattern Analysis and Machine Intelligence,
41(7):1720–1733.
Pettersson, I. and Ju, W. (2017). Design techniques for
exploring automotive interaction in the drive towards
automation. In Proceedings of the 2017 Confer-
ence on Designing Interactive Systems, DIS ’17, page
147–160, New York, NY, USA. Association for Com-
puting Machinery.
Politis, I., Brewster, S., and Pollick, F. (2015). Language-
based multimodal displays for the handover of con-
trol in autonomous cars. In Proceedings of the 7th
International Conference on Automotive User Inter-
faces and Interactive Vehicular Applications, Auto-
motiveUI ’15, page 3–10, New York, NY, USA. As-
sociation for Computing Machinery.
Reynolds, T. J. and Gutman, J. (1988). Laddering theory,
method, analysis, and interpretation. Journal of ad-
vertising research, 28(1):11–31.
Rhiu, I., Kwon, S., Bahn, S., Yun, M. H., and Yu, W.
(2015). Research issues in smart vehicles and elderly
drivers: A literature review. International Journal of
Human–Computer Interaction, 31(10):635–666.
Richardson, N. T., Lehmer, C., Lienkamp, M., and Michel,
B. (2018). Conceptual design and evaluation of a
human machine interface for highly automated truck
driving. IEEE Intelligent Vehicles Symposium, Pro-
ceedings, 2018-June(Iv):2072–2077.
R
¨
odel, C., Stadler, S., Meschtscherjakov, A., and Tscheligi,
M. (2014). Towards autonomous cars: The effect of
autonomy levels on acceptance and user experience.
In Proceedings of the 6th International Conference
on Automotive User Interfaces and Interactive Vehic-
ular Applications, AutomotiveUI ’14, page 1–8, New
York, NY, USA. Association for Computing Machin-
ery.
SAE (2018). Taxonomy and definitions for terms related
to on-road motor vehicle automated driving systems.
SAE Standard J3016. USA.
Schmargendorf, M., Schuller, H.-M., B
¨
ohm, P., Isemann,
D., and Wolff, C. (2018). Autonomous driving and the
elderly: Perceived risks and benefits. In Dachselt, R.
and Weber, G., editors, Mensch und Computer 2018
- Workshopband, Bonn. Gesellschaft f
¨
ur Informatik
e.V.
Schrepp, M., Hinderks, A., and Thomaschewski, J. (2014).
Applying the user experience questionnaire (ueq) in
different evaluation scenarios. In International Con-
ference of Design, User Experience, and Usability,
pages 383–392, Cham. Springer.
Str
¨
omberg, H., Blig
˚
ard, L.-O., and Karlsson, M. (2019).
Hmi of autonomous vehicles - more than meets the
eye. In Bagnara, S., Tartaglia, R., Albolino, S.,
Alexander, T., and Fujita, Y., editors, Proceedings of
the 20th Congress of the International Ergonomics As-
sociation (IEA 2018), pages 359–368, Cham. Springer
International Publishing.
Tullis, T. and Albert, B. (2013). Measuring the user expe-
rience: collecting, analysing, and presenting usability
matrics.
United Nations (2019). World Population Ageing
2019: Highlights (ST/ESA/SER.A/430). Depart-
ment of Economic and Social Affairs, Population
Division. United Nations. https://www.un.org/
en/development/desa/population/publications/pdf/
ageing/WorldPopulationAgeing2019-Highlights.pdf.
Wong, P. N. Y., Brumby, D. P., Babu, H. V. R., and
Kobayashi, K. (2019). Voices in self-driving cars
should be assertive to more quickly grab a distracted
driver’s attention. In Proceedings of the 11th In-
ternational Conference on Automotive User Inter-
faces and Interactive Vehicular Applications, Auto-
motiveUI ’19, page 165–176, New York, NY, USA.
Association for Computing Machinery.
Young, K. L., Koppe, S., and Charlton, J. L. (2017). Toward
best practice in human machine interface design for
older drivers: A review of current design guidelines.
Accident Analysis & Prevention, 106:460–467.
Zhou, F., Yang, X. J., and Zhang, X. (2019). Takeover Tran-
sition in Autonomous Vehicles: A YouTube Study. In-
ternational Journal of Human-Computer Interaction,
36(3):295–306.
HUCAPP 2021 - 5th International Conference on Human Computer Interaction Theory and Applications
36
