
Study of Intra- and Inter-user Variance in Password Keystroke Dynamics
Blaine Ayotte
a
, Mahesh K. Banavar
b
, Daqing Hou
c
and Stephanie Schuckers
d
Department of Electrical and Computer Engineering, Clarkson University, 8 Clarkson Avenue, Potsdam, U.S.A.
Keywords:
Behavioral Biometrics, Keystroke Dynamics, Principle Component Analysis, User Authentication.
Abstract:
Keystroke dynamics study how users input text via their keyboards. Having the ability to differentiate users,
typing behaviors can unobtrusively form a component of a behavioral biometric recognition system to improve
existing account security. However, because keystroke dynamics is behavioral biometric typing patterns can
change over time. The temporal effects of keystroke dynamics are largely unstudied beyond empirically
demonstrating that error rates will be higher for old or outdated profiles. In this paper, the effects on typing
patterns over time is investigated in detail. Using a well-known fixed-text keystroke dynamics dataset, we
show overall typing time for a provided password “.tie5Roanl” changes significantly over time, decreasing by
almost 30%. Principal component analysis (PCA) is used to determine which monographs and digraphs tend
to change throughout time. Rarely typed features, such as digraphs with a letter and number, are most likely
to change over time, while commonly occurring features such as common digraphs and monographs are much
more stable.
1 INTRODUCTION
Keystroke dynamics is a behavioral biometric that uti-
lizes typing rhythms to determine user identity (Alsul-
tan and Warwick, 2013; Banerjee and Woodard, 2012;
Teh et al., 2013). Keystroke dynamics can be used to
provide an additional layer of security to traditional
single sign-on authentication systems by also requir-
ing the typing patterns to match the profile of an indi-
vidual. Furthermore, as most computers already have
a keyboard, this layer of security does not require any
additional hardware.
There are two main types of keystroke dynamics:
fixed-text and free-text. Fixed-text analysis requires
the keystrokes of the profile and test sample to be
identical. The fixed-text keystrokes can constitute a
password, phrase, or even a sequence of sentences. A
common application of fixed-text keystroke dynam-
ics is password hardening, where typing patterns are
used to further secure a password so that users need
not only the password to match but also the keystroke
timings as well. Free-text keystroke dynamics puts
no restrictions on the keystrokes that users can type.
Common applications are continuous user authenti-
a
https://orcid.org/0000-0003-1909-4951
b
https://orcid.org/0000-0002-3916-7137
c
https://orcid.org/0000-0001-8401-7157
d
https://orcid.org/0000-0002-9365-9642
cation and it typically requires more keystrokes to
achieve similar performance to fixed-text. For fixed-
text systems, the keystrokes input are identical each
time making investigations more straightforward.
Features commonly used in keystroke dynam-
ics are combinations of monographs and digraphs
(Gunetti and Picardi, 2005; Huang et al., 2017; Mon-
rose and Rubin, 1997; Teh et al., 2013). Monographs
are defined as the hold time of a key and digraphs
are defined as the elapsed time between two consec-
utive keypresses, respectively. A graphical represen-
tation of sequentially pressing and releasing the “e”
and “5” keys with the corresponding monographs and
digraphs is shown in Figure 1.
Figure 1: Graphical representation of how monograph and
the four different digraph features are produced from two
consecutive keystrokes. U and D correspond to key-up and
key-down and are used to define the monographs and di-
graphs.
A survey of over 180 keystroke dynamics papers
(Teh et al., 2013), found that 49% used digraphs, 41%
Ayotte, B., Banavar, M., Hou, D. and Schuckers, S.
Study of Intra- and Inter-user Variance in Password Keystroke Dynamics.
DOI: 10.5220/0010235504670474
In Proceedings of the 7th International Conference on Information Systems Security and Privacy (ICISSP 2021), pages 467-474
ISBN: 978-989-758-491-6
Copyright
c
2021 by SCITEPRESS – Science and Technology Publications, Lda. All rights reserved
467

used monographs, 5% used pressure, and 5% used
other features. The survey points out that research in-
vestigating and comparing common features used for
keystroke dynamics is missing. Furthermore, there is
no work that investigates which features, if any, are
likely to change over time.
Keystroke dynamics systems consist of two steps,
training and testing. Keystrokes from an authorized
user are collected and stored in a profile. During the
testing phase, keystrokes from an unknown user are
compared to the previously recorded profile. If the
profile and test keystrokes are similar enough the un-
known user is authenticated and allowed access.
Most behavioral biometrics generally experience
lower permanency compared to physiological biomet-
rics (Teh et al., 2013). Keystroke dynamics is a be-
havioral biometric and is no exception. Typing pat-
terns of users may gradually change due to some or all
of the following factors: familiarity towards a pass-
word, maturing typing proficiency, adaptation to in-
put devices, and other environmental factors. While
researchers have methods to circumvent this issue by
constantly updating stored keystroke profile, there is
a lack of study on how keystroke patterns are affected
throughout time.
In this paper, we investigate the effects of time on
keystroke typing patterns. Both features that are sta-
ble and change throughout time are determined using
principal component analysis (PCA). This work al-
lows researchers to better understand and model how
typing patterns change over time. This paper is orga-
nized as follows. Section 2 presents related work. In
Section 3 the CMU password fixed-text dataset is de-
scribed. Section 4 demonstrates how typing patterns
change over time. In Section 5 principal component
analysis (PCA) is performed on the keystroke data.
Lastly, Section 6 concludes the paper.
2 RELATED WORK
It was found by Giot, et al., that the performance
of keystroke dynamics systems decreased across ses-
sions for multiple publicly available datasets (Giot
et al., 2015). Using the first session as training and
the subsequent sessions as testing, Giot found the
equal error rate (EER) increased and area under the
ROC curve (AUC) decreased. This was attributed to a
change in typing patterns over the course of data col-
lection. Keystroke dynamics is a behavioral biometric
and therefore user behavior is expected to change over
time, but how the typing patterns evolve over time has
not been studied.
Ngugi and Kahn compared typing patterns of a
four-digit PIN “1234” over three separate sessions
with a week and then a month in between the ses-
sions (Ngugi et al., 2011). The pins were solicited
during a “world trivia quiz” where users answered
questions by typing T/F (true or false) and entered
their pins. Over time the false accept rate (FAR) did
increase slightly, however, the false reject rate (FRR)
increased significantly. The increase was largest after
one week and after another month the increase was
less severe. The only change in typing behavior ob-
served was an overall typing speed increase over time.
As users became more familiar with the PIN, their av-
erage typing speeds increased. However, further anal-
ysis was not done to see which parts of typing the PIN,
if any, changed more than others.
Gunetti, et al., conducted a longitudinal study of
users typing behaviors across 1.5 years (Gunetti et al.,
2005). The 30 native Italian speaking participants
contributed free-text samples in both Italian and En-
glish. It was found that users could still be authenti-
cated using their old profiles with FAR of 1.84% and
FRR of 6.67% (in Italian). From the few studies ex-
amining profile age and performance, it is clear the
that performance will be impacted especially in the
FRR. Intuitively, this makes sense as imposter behav-
ior is not likely to change to be closer to your behavior
than to change farther from your behavior. However,
your behavior is likely to deviate from your profile
causing an increase in the FRR.
To mitigate the effects of typing patterns changing
over time, Kang, et al., used moving windows and
growing windows for profile retraining (Kang et al.,
2007). For the moving window scenario, the number
of training patterns is fixed, and when a new pattern
is added, the oldest is removed. Growing windows
continuously add new patterns without removing the
older ones. Kang, et al., found that using moving and
growing windows both decreased the EER, although
they concluded that more work needs to be done as
the typing patterns were collected over a short period
of time.
While the full extent of profiling aging is un-
known, many researchers have developed updating
strategies, or retraining schemes, to mitigate temporal
effects (Giot et al., 2011; Gunetti et al., 2005; Ngugi
et al., 2011; C¸ eker and Upadhyaya, 2017). These tem-
plate updating strategies, while effective, are useless
if the only keystrokes available are old or outdated.
Research is required to better understand how typing
patterns evolve over time to develop robust strategies
to mitigate template aging when working with out-
dated profiles.
ICISSP 2021 - 7th International Conference on Information Systems Security and Privacy
468
In summary, keystroke dynamics is a behavioral
biometric, and typing patterns can change over time.
Current research in keystroke dynamics focuses on
strategies to update profiles and further improve per-
manence empirically. Our focus is on understanding
and predicting how behavior changes so that more ef-
fective modeling can be done.
3 DATASET
In this work, the CMU fixed-text dataset is used (Kil-
lourhy and Maxion, 2009). This dataset was collected
to study password hardening and consists of 51 users,
each with 400 total password entries across 8 different
sessions. Each session contains 50 password attempts
and there is at least one day between each session. All
users were required to type “.tie5Roanl” without any
errors. The password was provided to users so they
may not be initially familiar with typing the password.
The dataset consists of 31 features including mono-
graphs, DD digraphs, and UD digraphs. Monographs
are defined as the hold time of a key, DD digraphs are
the elapsed time between the key-down of a key to the
key-down of the following key, and UD digraphs are
the time of a key released to the press of the follow-
ing key (see Figure 1). The CMU dataset is one of
the largest publicly available fixed-text datasets and is
used by many different researchers. As a result, this
dataset serves as a benchmark dataset for fixed-text
research and is well-known in the keystroke dynam-
ics field.
4 KEYSTROKE DYNAMICS
OVER TIME
It has been empirically well established that behav-
ioral biometrics can change over time (Giot et al.,
2011; Giot et al., 2015; Gunetti et al., 2005; Kang
et al., 2007; Mhenni et al., 2019; Ngugi et al., 2011).
These works have shown on multiple datasets that the
EER increases over time without any template updat-
ing strategy. This phenomenon can be seen in Fig-
ure 2 where the average EER is shown for each of
the sessions. The algorithm used for authentication
is the scaled Manhattan distance, previously found to
be the best performing algorithm on this dataset (Kil-
lourhy and Maxion, 2009). The EER is calculated
using 31 features consisting of monographs, DD di-
graphs, and UD digraphs extracted from the password
“.tie5Roanl”, similar to the work done by Kilhourhy
and Maxion (Killourhy and Maxion, 2009).
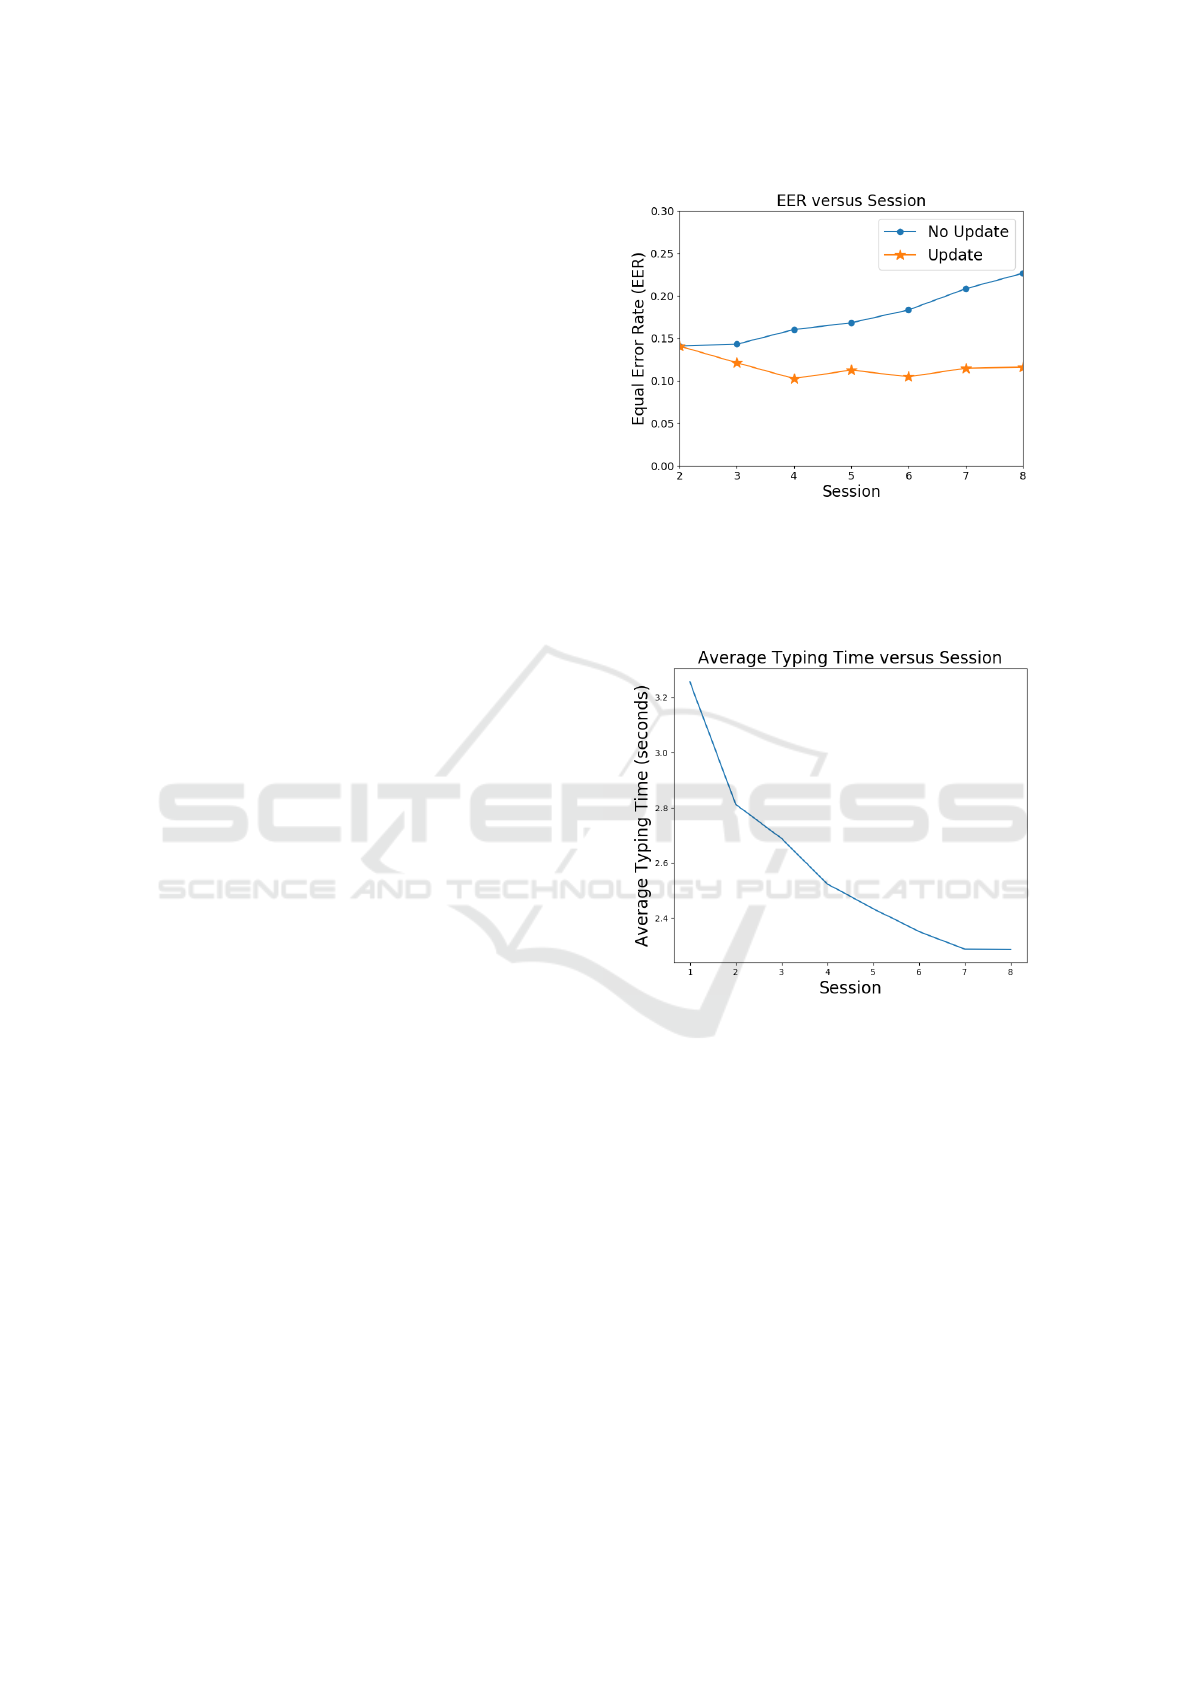
Figure 2: EER versus session averaged across user using the
scaled Manhattan distance (Killourhy and Maxion, 2009).
When no update strategy is used, the EER is increasing
steadily as the testing keystrokes get farther away from the
profile. When the profile is updated after each session, the
EER does not increase.
Figure 3: Total time in seconds taken to type the password
“.tie5Roanl” averaged across session and users.
When no template updating strategy is deployed,
session 1 is used as the profile and tested against the
keystrokes in sessions 2-8. For our template updating
strategy, we consider a simple method where the pro-
file is updated after each session. The test keystrokes
are always from the session immediately following
the profile.
To investigate how typing patterns change for
users typing the password “.tie5Roanl” overall typ-
ing time is examined. The password is provided to
the users and therefore is unfamiliar. Prior to the first
session they have had no time to practice. The pass-
word contains uncommon combinations of keystrokes
(number to letter and letter to number such as “e+5”
and “5+R”) and as a result users may struggle at first
to enter it quickly. Therefore, we expect the total time
Study of Intra- and Inter-user Variance in Password Keystroke Dynamics
469

in the first session to be higher than in the sessions
following. This phenomenon can be seen in Figure 3.
Figure 3 is consistent with our intuition. On aver-
age, users type the password faster than the session
previously. Our findings are consistent with previ-
ous work that found the overall typing time decreased
across session (Ngugi et al., 2011). From sessions 1
to 8, the average typing time drops by almost one sec-
ond which is a percent decrease of 29.8%. Therefore,
it is no surprise that without updating the profile after
each session the EER will increase significantly.
While this difference in behavior is easy to un-
derstand, which features (the individual monographs
and digraphs) are changing is unknown. To better un-
derstand the changing behavior and to determine if
only certain features are changing, principal compo-
nent analysis (PCA) is applied to the keystroke data.
5 PRINCIPAL COMPONENT
ANALYSIS
Principal component analysis (PCA) is a common
tool used for dimensionality reduction or noise reduc-
tion (Abdi and Williams, 2010; Duda et al., 2012).
PCA works to project the data into a lower dimen-
sional space that best represents the data in terms of
variance in a least-square sense. The principal com-
ponents act as linear transformations from the original
data space into a new space (lower dimensionality)
where the majority of the total variance in the original
dataset is still explained. The components are sorted
in order of the percentage of variance in the original
dataset they explain.
Another common application of PCA is noise re-
duction. Consider a simple 2-dimensional example
where the data is produced with function f (x) = x+ε,
where ε is additive white Gaussian noise with a small
variance. Performing PCA on this data will return one
component which explains almost all of the variance.
This component corresponds to the deterministic sig-
nal f (x) = x. The other components explain the re-
mainder of the variance and correspond to the noise in
system. In this example, keeping only the first compo-
nent will reduce noise in the system as well as reduce
the dimension of the data.
For keystroke dynamics, by cleverly selecting the
data to which PCA is applied, insights into how typing
behavior changes over time can be obtained. We con-
sider two scenarios for further analysis which we call,
“intra-user” and “inter-user”. Intra-user applies PCA
on a single user’s data to determine how each user’s
behavior changes over time, while inter-user applies
PCA on data from every user to determine which fea-
tures distinguish between users.
5.1 Intra-user PCA
For intra-user PCA, PCA is performed on the typ-
ing data from all sessions for each user. As we have
seen in Figure 3, the total time is changing signifi-
cantly across sessions. Therefore, in this scenario, the
largest source of variability within the data is from
how the keystroke dynamics are changing over time
for a particular user. The principal components that
explain the majority of the variance in the original
dataset are linear combinations of features that are
causing the most change in typing patterns over time.
The remaining components can be thought of as noise
caused by human error, timing resolution in keystroke
capturing software, time of day, the mood of the typ-
ist, and any other factors leading to different password
entries.
After PCA is applied on the original 31 dimen-
sional data consisting of monograph and digraph du-
rations, we need to determine how many components
should be kept. To keep 100% of the total variance in
the original data, all 31 components will need to be
kept. Usually the first few components will contain
enough of the total variance and a significant number
of components can be discarded. A common method
of selecting the number of components to keep is re-
ferred to as a scree or elbow plot (Abdi and Williams,
2010). The idea behind a scree plot is to stop using
components after their contribution to the explained
variance begins to decline. In the intra-user PCA case,
for the majority of users, after the third component
the gain from from adding additional components de-
creased. This can be visualized in Figure 4, where the
scree plots for four different users are shown.
In Table 1, the explained variance for the first
three components is shown for intra-user PCA. The
explained variance is averaged across users and the
standard deviation is also reported. To better under-
stand which original features (monographs and di-
graphs) are affected by time we take in depth look at
the principal components of the PCA decomposition.
Table 1: The average and standard deviations of the vari-
ance for the first 3 components of the intra-user PCA de-
compositions.
Component Average Explained Variance (%)
1 37.7 ± 8.4
2 17.6 ± 3.4
3 11.9 ± 2.5
Sum 67.2 ± 7.1
ICISSP 2021 - 7th International Conference on Information Systems Security and Privacy
470
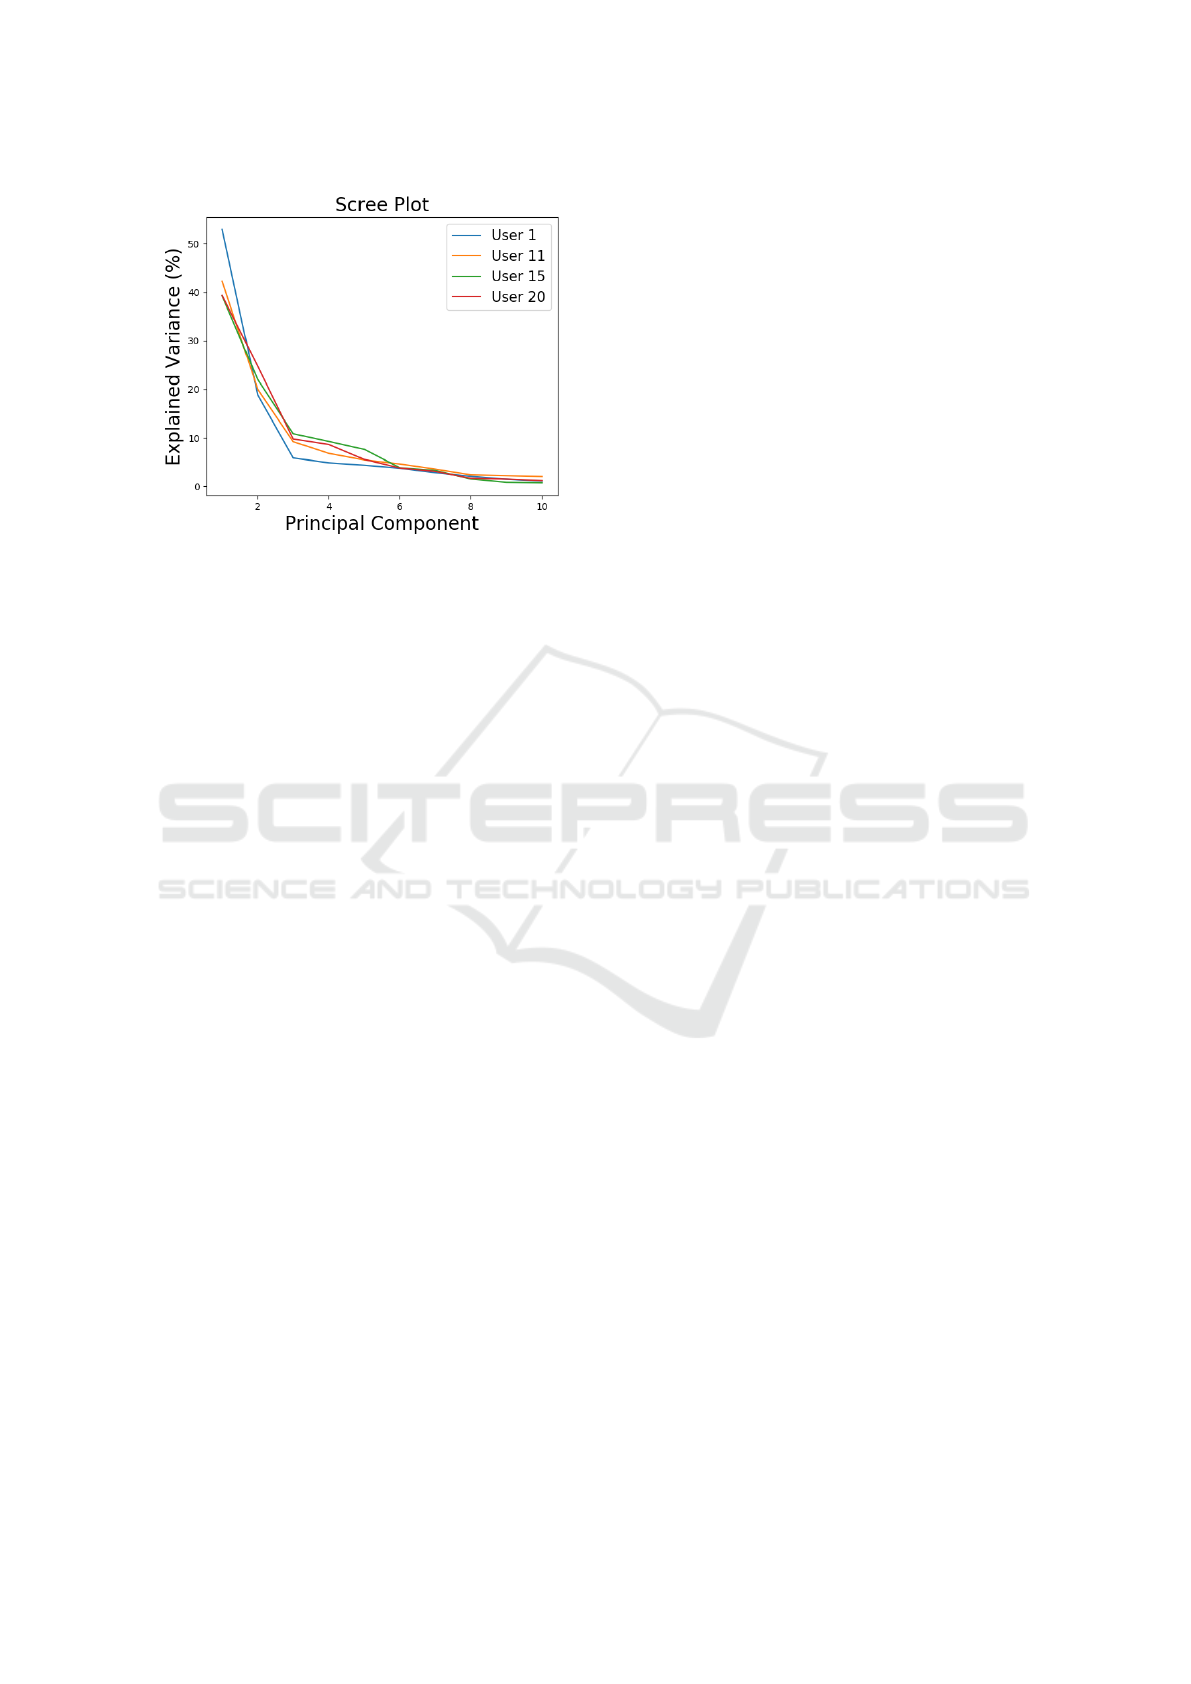
Figure 4: Scree plots for the intra-user PCA for four differ-
ent users. After the third component, there is minimal gain
(less than 5%) from adding additional components indicat-
ing only the first three components should be kept.
It is worth noting that for every user’s PCA de-
composition, the explained variance and principal
components obtained are different. These compo-
nents are not typically compared because they can
represent completely different linear combinations of
original features. For example, each user may have a
very different percentage of variance explained in the
first component from the other users. However, be-
cause the components look similar for most users, we
averaged the explained variances together in order to
best demonstrate global trends.
The original features consist of 31 monographs
and digraphs (seen in the first column of Figure 5).
The principal components are linear combinations of
these features. Components with a large magnitude
weight for a particular feature indicates that feature
is contributing strongly to explain the variance of the
dataset. Therefore, that feature is considered to be
strongly influenced by time. In other words, if a fea-
ture weight has a large magnitude from the principal
component, then that feature is changing from session
to session.
The first principal component is shown in Fig-
ure 5. On average (across users) the first compo-
nent explains 37.7% of the total variance in the data.
Each weight of the component is squared because
we are interested in the magnitude of the weights.
The principal component corresponds to a direction,
and because each element of the component has been
squared, the sum of every column is equal to 1.
For almost every user the DD and UD digraphs
for “e+5” has the largest weight followed closely by
the “5+R” UD and DD digraphs. While only 20 users
are shown in Figure 5, this trend can be seen across
most users. Other features that seem to contribute for
most users but with much smaller weights include DD
and UD digraphs of “l+Return”, “.+t”, and “i+e”. The
DD and UD digraph contributions seem to be almost
identical regardless if the digraph is a strong or weak
contributor. Another interesting trend is that mono-
graphs do not appear to contribute whatsoever.
The second and third components explain on av-
erage 17.6% and 11.9% of the total variance respec-
tively. These components are not shown in order to
save space, and instead we present the general trends.
Unlike the first component, the second and third com-
ponents have less consistent patterns across users sug-
gesting that the important features in these compo-
nents vary from user to user.
However, it is clear that some digraphs contribute
more than others. The stronger DD and UD digraph
contributors are shown in approximate ranked order
for the top 3 components: “e+5”, “5+R”, “l+Return”,
“.+t”, and “i+e”. These features are the least sta-
ble features across time. No monograph feature con-
tributes to a component within the first three compo-
nents. These digraphs with a letter and number com-
bination are not commonly typed in everyday life so
users likely have little to no experience typing them.
The other digraphs shown to change over time include
a period and Return key (also less common in every-
day life).
The digraphs that are rarely typed tend to change
across sessions while the commonly typed digraphs
do not. In this dataset, the password “.tie5Roanl” was
provided for the participants, so users are not familiar
with the key combinations. It is apparent that famil-
iarity is a significant factor when considering typing
patterns over time. The one exception to this rule ap-
pears to be the DD and UD digraphs of “i+e” as they
are commonly typed digraphs yet still seem to fluc-
tuate over time. A possible explanation is that the
“i+e” digraph occurs nearby the “5” key. Nonethe-
less, familiarity with certain digraphs directly affects
whether that digraph is likely to change over time.
Monographs contribute very little to the princi-
pal components until about the 7
th
component. It is
not until the 11
th
component that contribution from
monographs becomes common. The 7
th
component,
on average, explains 4.0% of the variance and the first
six components explain 87.8% of the total variance in
the data. This provides evidence that monographs are
mostly static over time and do not change as much as
digraphs. Considering only the English alphabet there
are 26 different monographs but 26 × 26 digraphs.
Therefore, each monograph may naturally get more
practice due to a much smaller amount of possibil-
ities, which reinforces that familiarity is driving the
change in behavior.
Study of Intra- and Inter-user Variance in Password Keystroke Dynamics
471
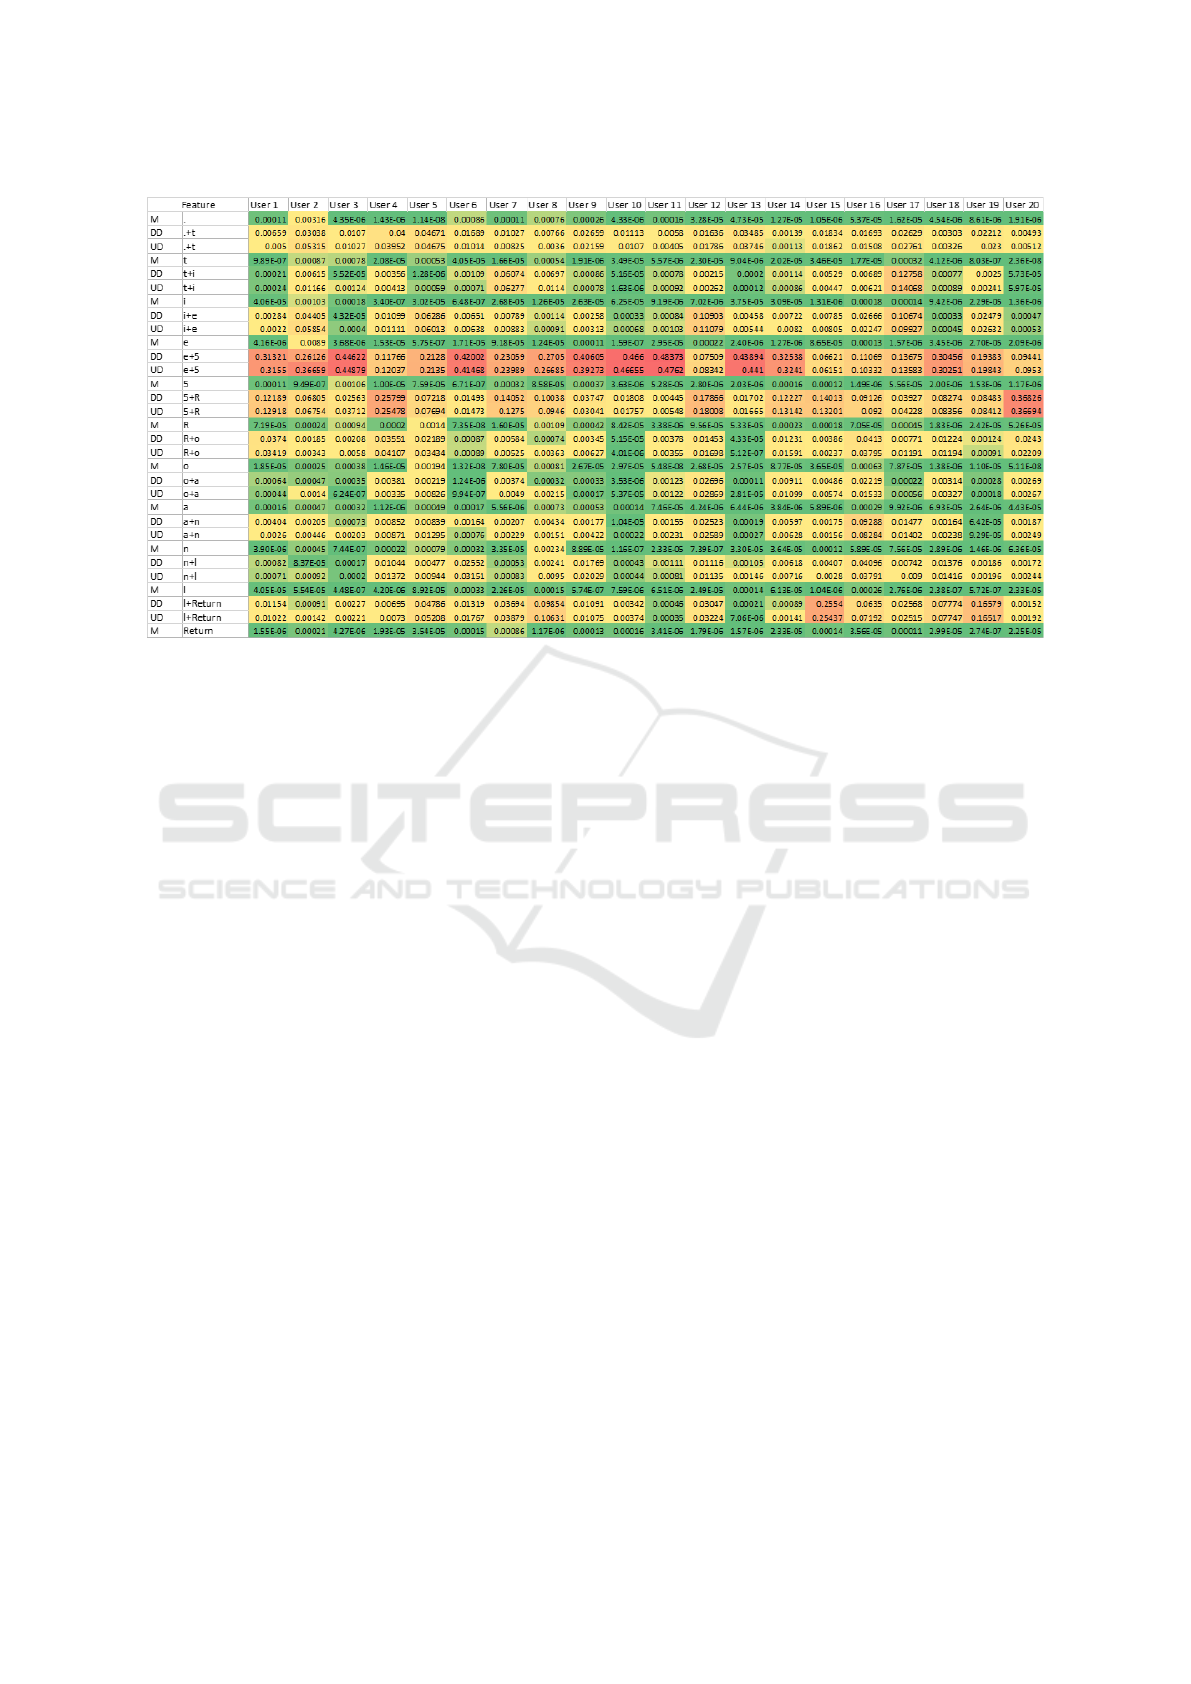
Figure 5: The first principal component of the intra-user PCA decomposition. For space, only the first 20 users components
are shown. Each PCA weight is squared so the columns sum to 1. Larger values appear in red and smaller values appear in
green. The DD and UD digraphs contribute roughly the same for a given letter combination and the two largest contributors
are “e+5” and “5+R”.
Existing work by Ayotte, et al, (Ayotte et al.,
2019; Ayotte et al., 2020) found that with small
amounts of keystrokes monographs were the among
the most informative features for distinguishing be-
tween users. A password hardening scenario involves
only small amounts of keystrokes so it is likely that
monographs are useful for distinguishing between
users. This work shows that monographs seem static
across time and therefore may be a powerful feature
for user authentication especially when working with
an old or outdated profile.
5.2 Inter-user PCA
The inter-user case is designed to determine which
features are useful to distinguish between users. To
achieve this, the monographs and digraphs are aver-
aged across every session for each user. If the fea-
tures are not averaged, the results might depend on
the particular session used. PCA is then applied on
the single averaged features for each user. In this sce-
nario the largest source of variability within the data
is the different users. Therefore, the principal compo-
nents that can explain the majority of the variance in
the data are linear combinations of features that dif-
ferentiate users. The remaining components can be
thought of as noise caused by averaging across mul-
tiple sessions in addition to the sources explained in
Section 5.1.
The percentage explained variance for the inter-
user PCA for the top 3 components is 70.7%, 9.4%,
and 5.3% for a total of 85.4%. As the first compo-
nent explains a significant portion of the variance,
no scree plots are needed and it is adequate to only
consider the first component. Nonetheless, Figure 6
contains the first 3 principal components for the inter-
user PCA. The top features primarily contributing to
the first component include “5+R”, “l+Return”, and
“.+t” followed closely by “e+5”, “R+o”, and “n+l”.
As with the intra-user PCA, the DD and UD digraphs
contribute roughly the same for a given letter combi-
nation.
Many of these features are the same as for the
intra-class PCA. This is consistent with empirical
EERs increasing over time. If the features that explain
differences between users were different from the fea-
tures that changed over time, the EERs would likely
not have changed over time. Therefore, digraphs such
as “R+o” and “n+l”, which contribute to the inter-
class PCA but not the intra-class PCA, may be espe-
cially more useful when working with old or outdated
profiles.
Monographs start to become contributors to the
principal components as early as the third component.
The contributions are smaller than the digraphs. How-
ever, the monograph feature was also shown to be sta-
ble over time. This is consistent with previous work
that found with small amounts of keystrokes mono-
graphs were informative features for distinguishing
ICISSP 2021 - 7th International Conference on Information Systems Security and Privacy
472
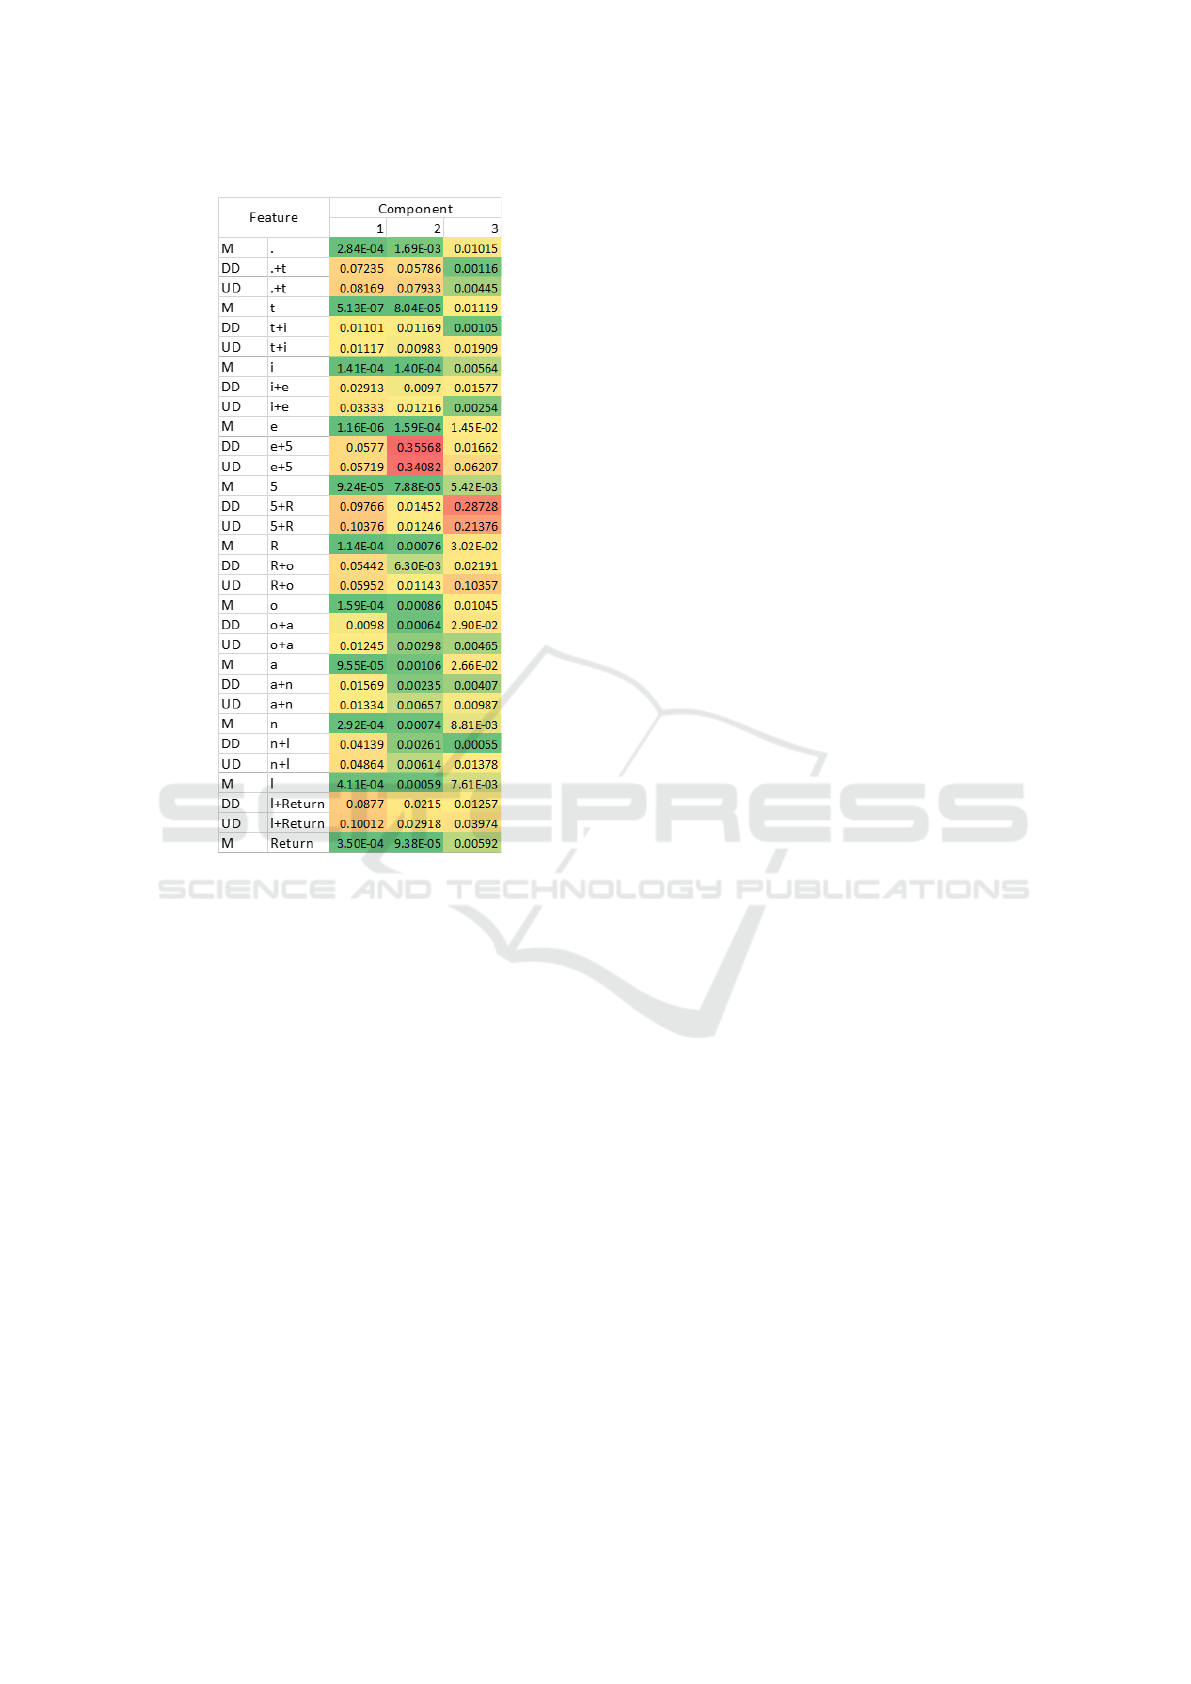
Figure 6: The first 3 principal components of the inter-user
PCA decomposition. Each PCA weight is squared. Larger
values appear in red and smaller values appear in green.
between users (Ayotte et al., 2019; Ayotte et al.,
2020). Therefore, especially for old or outdated pro-
files, monographs may be a valuable feature for au-
thentication.
6 CONCLUSION AND FUTURE
WORK
In this paper, we investigated the temporal effects on
user typing patterns using a well-known fixed-text
keystroke dynamics dataset. We showed that when
provided with an unfamiliar password (“.tie5Roanl”),
the overall typing time decreases throughout sessions.
Through intra-user PCA, we demonstrated the UD
and DD digraphs rarely occurring in normal typed
texts such as “e+5”, “5+R”, “l+Return” and “.+t” con-
tributed significantly to the principal components that
explain the majority of variance in the original data,
and therefore subject to change over time. The UD
and DD digraphs that were commonly typed such as
“o+a” and “a+n” contributed almost nothing to the
explained variance and therefore found to be invari-
ant across time. Monographs were found to explain
almost none of the variance for the intra-user PCA,
which indicates they are stable over time. Mono-
graphs, in general, are typed far more frequently than
digraphs due to the smaller number of total possible
combinations.
This provides evidence that familiarity will
greatly impact how much a feature changes over time.
Features typed frequently such as monographs and
common digraphs are more invariant through time
than rarely typed features such as number-letter or let-
ter number digraphs. When using old or outdated pro-
files, the focus should be on common features as they
are less likely to have changed since the initial profile
was collected.
Through inter-user PCA, features that differenti-
ate between users were found to be the DD and UD
digraphs of “5+R”, “l+Return”, “.+t”, “e+5”, “R+o”,
and “n+l”. The majority of these features also change
over time which explains the decrease in performance
over time when no updating strategy is used. While
digraphs were the most informative features, mono-
graphs were shown to still be useful in distinguish-
ing between users. This is consistent with previous
work by Ayotte, et al, (Ayotte et al., 2019; Ayotte
et al., 2020) where they found with small amounts of
keystrokes monographs were informative features for
distinguishing between users. Since monographs are
stable over time and may be able to differentiate be-
tween users, this makes them potential candidates for
use with old or outdated profiles.
Future work includes investigating the effects of
typing patterns on other datasets and with different
fixed-text such as the datasets collected by Giot, et
al, and Fierrez, et al (Giot et al., 2009; Fierrez et al.,
2010). Our work will also be extended to free-text
keystroke dynamics to determine if the phenomenon
is generalizable beyond fixed-text. Analysis of typ-
ing patterns across multiple years could provide even
more evidence of our conclusions. Lastly, we would
like to extend this work to investigate other sources of
variability within typing patterns such as mood, time
of day, or keyboard.
ACKNOWLEDGEMENTS
This work is supported in part by the NSF CPS award
1646542, Clarkson Niklas Ignite Fellowship, and ma-
terial is based upon work supported by the Center for
Identification Technology Research (CITeR) and the
NSF under Grants 1650503 and 1314792.
Study of Intra- and Inter-user Variance in Password Keystroke Dynamics
473

REFERENCES
Abdi, H. and Williams, L. J. (2010). Principal component
analysis. Wiley interdisciplinary reviews: computa-
tional statistics, 2(4):433–459.
Alsultan, A. and Warwick, K. (2013). Keystroke dynamics
authentication: a survey of free-text methods. Inter-
national Journal of Computer Science Issues (IJCSI),
10(4):1.
Ayotte, B., Banavar, M., Hou, D., and Schuckers, S.
(2020). Fast free-text authentication via instance-
based keystroke dynamics. IEEE Transactions on
Biometrics, Behavior, and Identity Science, 2(4):377–
387.
Ayotte, B., Banavar, M. K., Hou, D., and Schuckers, S.
(2019). Fast and accurate continuous user authenti-
cation by fusion of instance-based, free-text keystroke
dynamics. In International Conference of the Biomet-
rics Special Interest Group (BIOSIG). IEEE.
Banerjee, S. and Woodard, D. (2012). Biometric authen-
tication and identification using keystroke dynamics:
A survey. Journal of Pattern Recognition Research,
7(1):116–139.
C¸ eker, H. and Upadhyaya, S. (2017). Transfer learning in
long-text keystroke dynamics. In 2017 IEEE Interna-
tional Conference on Identity, Security and Behavior
Analysis (ISBA), pages 1–6. IEEE.
Duda, R. O., Hart, P. E., and Stork, D. G. (2012). Pattern
classification. John Wiley & Sons.
Fierrez, J., Galbally, J., Ortega-Garcia, J., Freire, M. R.,
Alonso-Fernandez, F., Ramos, D., Toledano, D. T.,
Gonzalez-Rodriguez, J., Siguenza, J. A., Garrido-
Salas, J., et al. (2010). Biosecurid: a multimodal bio-
metric database. Pattern Analysis and Applications,
13(2):235–246.
Giot, R., Dorizzi, B., and Rosenberger, C. (2011). Anal-
ysis of template update strategies for keystroke dy-
namics. In 2011 IEEE Workshop on Computational
Intelligence in Biometrics and Identity Management
(CIBIM), pages 21–28. IEEE.
Giot, R., Dorizzi, B., and Rosenberger, C. (2015). A review
on the public benchmark databases for static keystroke
dynamics. Computers & Security, 55:46–61.
Giot, R., El-Abed, M., and Rosenberger, C. (2009). Gr-
eyc keystroke: a benchmark for keystroke dynamics
biometric systems. In 2009 IEEE 3rd International
Conference on Biometrics: Theory, Applications, and
Systems, pages 1–6. IEEE.
Gunetti, D. and Picardi, C. (2005). Keystroke analysis of
free text. ACM Trans. Inf. Syst. Secur., 8(3):312–347.
Gunetti, D., Picardi, C., and Ruffo, G. (2005). Dealing with
different languages and old profiles in keystroke anal-
ysis of free text. In Congress of the Italian Association
for Artificial Intelligence, pages 347–358. Springer.
Huang, J., Hou, D., Schuckers, S., Law, T., and Sherwin, A.
(2017). Benchmarking keystroke authentication algo-
rithms. In Information Forensics and Security (WIFS),
2017 IEEE Workshop on, pages 1–6. IEEE.
Kang, P., Hwang, S.-s., and Cho, S. (2007). Continual re-
training of keystroke dynamics based authenticator. In
International Conference on Biometrics, pages 1203–
1211. Springer.
Killourhy, K. S. and Maxion, R. A. (2009). Comparing
anomaly-detection algorithms for keystroke dynam-
ics. In 2009 IEEE/IFIP International Conference
on Dependable Systems & Networks, pages 125–134.
IEEE.
Mhenni, A., Cherrier, E., Rosenberger, C., and Amara, N.
E. B. (2019). Analysis of doddington zoo classifica-
tion for user dependent template update: Application
to keystroke dynamics recognition. Future Generation
Computer Systems, 97:210–218.
Monrose, F. and Rubin, A. (1997). Authentication via
keystroke dynamics. In Proceedings of the 4th ACM
conference on Computer and communications secu-
rity, pages 48–56.
Ngugi, B., Kahn, B. K., and Tremaine, M. (2011). Typ-
ing biometrics: impact of human learning on perfor-
mance quality. Journal of Data and Information Qual-
ity (JDIQ), 2(2):11.
Teh, P. S., Teoh, A. B. J., and Yue, S. (2013). A survey of
keystroke dynamics biometrics. The Scientific World
Journal, 2013.
ICISSP 2021 - 7th International Conference on Information Systems Security and Privacy
474
