
Automated Mobile Image Acquisition of Macroscopic Dermatological
Lesions
Dinis Moreira
a
, Pedro Alves
b
, Francisco Veiga
c
, Lu
´
ıs Rosado
d
and Maria Jo
˜
ao M. Vasconcelos
e
Fraunhofer Portugal AICOS, Porto, Portugal
Keywords:
Mobile Dermatology, Image Acquisition, Image Quality Assessment, Feature Extraction, Machine Learning,
Image Segmentation.
Abstract:
The incidence of skin cancer has been rising every year translating in high economic costs. The development
of mobile teledermatology applications that can contribute for the standardization of image acquisition can
facilitate early diagnosis. This paper presents a new methodology for real-time automated image acquisition
of macroscopic skin images via mobile devices. It merges an automated image focus assessment that uses a
feature-based machine learning approach with segmentation of dermatological lesions using computer vision
techniques. It also describes the datasets used to develop and evaluate the proposed approach: 3428 images
from one dataset purposely collected using different mobile devices for the focus assessment component,
and a total of 1380 images from two other datasets available on the literature to develop the segmentation
approach. The best model for automatic focus assessment of preview images and acquired picture achieved
an overall accuracy of 88.3% and 86.8%, respectively. The segmentation approach attained a Jaccard index of
85.81% and 68.59% for SMARTSKINS and Dermofit datasets, respectively. The developed algorithms present
a fast processing time that is suitable for real-time usage in medium and high performance smartphones.
These findings were also validated by implementing the proposed methodology within an android application
demonstrating promising results.
1 INTRODUCTION
Skin cancer is the most common malignancy in cau-
casian population (Apalla et al., 2017). The inci-
dences of melanoma and nonmelanoma skin cancers
are rising each year, resulting in high economic costs
(Ferlay et al., 2019). According to the World Health
Organization, skin cancer represents approximately
one third of every diagnosed cancer, reaching over
3 million cases over the world, annually. Therefore,
early detection is crucial for improving success rates
of treatment, while improving the patient condition
and diminishing health costs. Unfortunately, due to
the global pandemic of Covid-19, annual screening
campaigns have been cancelled or postponed in many
countries (EuroMelanoma, 2020), opting to share use-
a
https://orcid.org/0000-0003-0719-6096
b
https://orcid.org/0000-0002-0372-4755
c
https://orcid.org/0000-0001-6118-2600
d
https://orcid.org/0000-0002-8060-831X
e
https://orcid.org/0000-0002-0634-7852
full information to the population and creating aware-
ness to reach their general practitioners or dermatolo-
gist in case of doubt and recurring to teleconsultation.
In recent years, through the advances in mo-
bile health (m-health) technologies, several derma-
tology self-care or telemedicine solutions have ap-
peared (de Carvalho et al., 2019; Rat et al., 2018;
Finnane et al., 2017b). These solutions are of high im-
portance for monitoring the evolution of skin lesions
or early detection of malignant lesions which can
avoid unnecessary medical appointments in a field
such as dermatology. Although dermoscopy is the
standard procedure for the analysis of pigmented le-
sions (Errichetti and Stinco, 2016), it requires spe-
cific equipment and it is generally used by special-
ists, while general practitioners or patients frequently
acquire macroscopic (close-up) images or clinical im-
ages with their smartphones. Nevertheless, specialists
need to receive standardized information with guar-
anteed quality in order to provide reliable feedback or
diagnosis, especially when dealing with clinical im-
ages.
122
Moreira, D., Alves, P., Veiga, F., Rosado, L. and Vasconcelos, M.
Automated Mobile Image Acquisition of Macroscopic Dermatological Lesions.
DOI: 10.5220/0010234201220132
In Proceedings of the 14th International Joint Conference on Biomedical Engineering Systems and Technologies (BIOSTEC 2021) - Volume 5: HEALTHINF, pages 122-132
ISBN: 978-989-758-490-9
Copyright
c
2021 by SCITEPRESS – Science and Technology Publications, Lda. All rights reserved

This work presents a new approach for auto-
mated image acquisition of macroscopic skin images
through mobile devices, by merging automated image
focus and segmentation of dermatological lesions. A
real-time image focus validation approach followed
by a lesion segmentation algorithm were developed,
together with a final focus validation to guarantee the
quality and adequacy of the acquired image. With
this work, we aim to contribute to the standardization
of image acquisition in dermatology, particularly for
macroscopic images, by assisting the user during the
acquisition process and facilitating further monitoring
and diagnosis procedures.
This paper is structured as follows: Section 1
presents the motivation and objectives of this work;
Section 2 summarizes the related work and applica-
tions found on the literature; Section 3 provides an
overview of the system architecture including datasets
description and the methodologies used for focus val-
idation and segmentation; in Section 4, the results and
discussion are presented; and finally conclusions and
future work are drawn in Section 5.
2 RELATED WORK
With the evolution of mobile technologies the devel-
opment of applications that use the device’s camera
for image acquisition of skin lesions has increased
(de Carvalho et al., 2019). Even though smartphones
cameras have embedded auto-focus systems, which
frees the users from having to manually focus, ex-
ternal factors such as small camera movements dur-
ing the image acquisition, poor or inconsistent illu-
mination may originate low quality images such as
blurred images. Additionally, and due to the fact
that the lens’ aperture on mobile devices is usually
small, a longer exposure time is required which con-
sequently increases the chances of occurring the men-
tioned small camera movements. Therefore, this sim-
ple factor may lead to the inability of the dermatol-
ogist to provide a clinical decision due to the poor
quality of the image. In (Commissioning, 2011), a
set of quality standards for teledermatology in the
UK were presented regarding image quality, resolu-
tion and more specifically focus. This image qual-
ity standards mention that images for teledermatology
assessment should be a minimum size of 2000x1500
pixels or 3 megapixels, acquired using electronic flash
and with a focusing distance no closer than 20cm to
the lesion.
Several papers and applications resort to the
smartphone auto-focus function in an attempt to ob-
tain a focused image of a skin lesion (B
¨
orve et al.,
2014). The mobile applications, Spotmole and
DermPic (Munteanu, 2016; Lubax, 2019), also appear
to use the smartphone’s auto-focus function for ad-
dressing this issue, however neither application does
a verification of the image sharpness or quality. The
former asks the user to manually confirm if the photo
has an adequate quality while the latter just assumes
its focus, thus depending in the user’s subjectivity
and proficiency with the application. In overall, us-
ing auto-focus function is sufficient to get a focused
image, but when it comes to medical devices and pro-
cedures, a higher fidelity degree is thus required. This
requisite is not only important to improve the moni-
toring and diagnosis ability of skin lesions, but also
to highlight the need of assessing the quality of the
images acquired by these applications (Dahl
´
en Gyl-
lencreutz et al., 2018; Finnane et al., 2017a).
In (Alves et al., 2019) a methodology for the au-
tomatic focus assessment on dermoscopic images ac-
quired with smartphones was presented. A combina-
tion of 90 different focus metrics and their relative
values between the original and an artificially gener-
ated blurred image served as basis for the training of
a decision tree model. A global accuracy of 86.2%
was attained regarding the focus status of the acquired
images in dermoscopic images. More recently, in
(Dugonik et al., 2020), the authors compared the use
of several different smartphone cameras, as well as
two Digital Single-Lens Reflex cameras and a pro-
fessional medical camera (Medicam 1000s) for der-
moscopy image acquisition. Image sharpness, reso-
lution and color reproduction were measured and the
attained results showed that some smartphones’ ren-
der overly saturated colors and may apply some over-
sharpening methods to the picture which can alter the
characteristics of the object being photographed.
Regarding studies focused in close-up or clinical
images, in (Udrea and Lupu, 2014), the authors de-
velop a methodology for the real-time acquisition of
quality verified skin lesions from a video taken with
a mobile device camera. They concluded that ac-
quiring focused images with smartphones’ camera is
feasible, being the best results obtained when using
the Brenner Gradient focus metric. In the proposed
method the skin lesion is segmented using the grey
image, followed by the application of a median filter
and Otsu method for automatic threshold detection.
For the study, 60 images from melanoma and benign
lesions were used to build and test the system and im-
plemented in a iOS app. Similarly, (de Carvalho et al.,
2019) developed a popular application, Skin Vision
App, that uses a special camera module for the ac-
quisition of quality skin lesion images. The authors
claimed that this camera module reduced the number
Automated Mobile Image Acquisition of Macroscopic Dermatological Lesions
123
of blurry photos, on average, by about 52%.
Regarding skin lesions segmentation, most meth-
ods on the literature were proposed for dermoscopic
images, while for macroscopic images still lacks fur-
ther research (Rosado and Vasconcelos, 2015; Flo-
res and Scharcanski, 2016; Oliveira et al., 2016; Fer-
nandes et al., 2018; Andrade et al., 2020). One of
the main reasons for that is closely related with the
small amount of available datasets that include anno-
tated images of macroscopic images. Also, most stud-
ies focus on pigmented lesions (Rosado and Vascon-
celos, 2015; Flores and Scharcanski, 2016; Oliveira
et al., 2016) and do not consider non-pigmented le-
sions that are also very common (Fernandes et al.,
2018; Andrade et al., 2020). Examples of methodolo-
gies vary from threshold-based techniques (Rosado
and Vasconcelos, 2015), usage of unsupervised dic-
tionary learning methods (Flores and Scharcanski,
2016), active contour model without edges and a sup-
port vector machine method (Oliveira et al., 2016). In
terms of segmentation performance, (Oliveira et al.,
2016) obtained an XOR error of 16.89% and (Oliveira
et al., 2016) evaluated the correctness of the segmen-
tation based on the visual assessment of a special-
ist which reached a 94.36% of correctly segmented
images. More recently, the usage of deep learning
methods was been reported (Fernandes et al., 2018;
Andrade et al., 2020). The highest reported perfor-
mance obtained, in the deep learning methods, was in
(Andrade et al., 2020) with 82.64% Jaccard index in
a pigmented lesions database and 81.03% in a non-
pigmented lesions database. However, most of the
works mentioned previously do not apply the meth-
ods in real-time apart from (Udrea and Lupu, 2014;
Rosado and Vasconcelos, 2015; de Carvalho et al.,
2019; Alves et al., 2019).
3 SYSTEM ARCHITECTURE
The proposed system allows the automated mobile
image acquisition of macroscopic skin lesions. It is
comprised by an image acquisition methodology and
a mobile application.
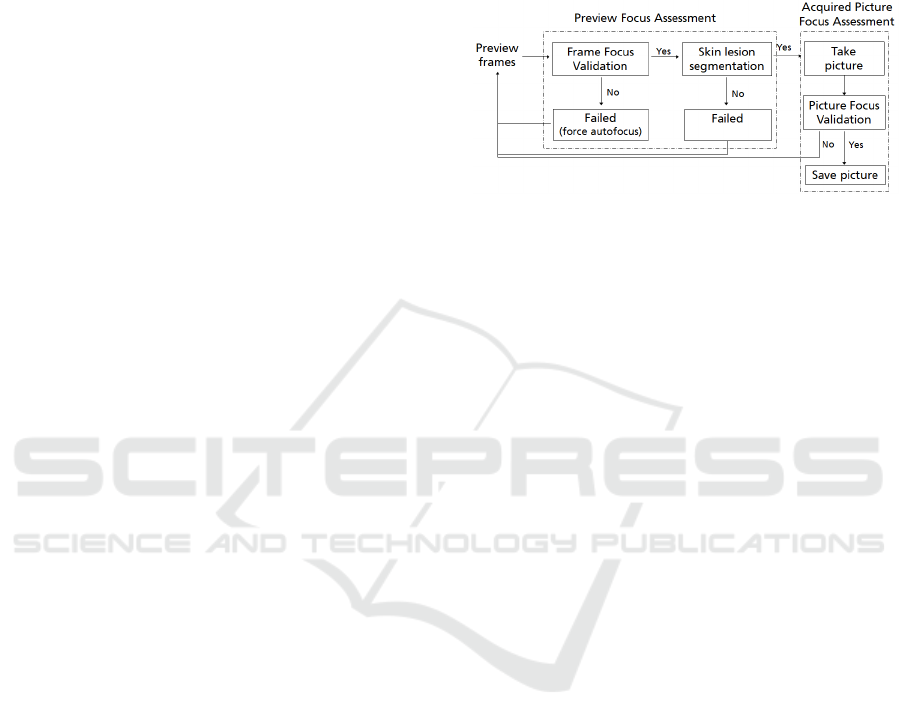
The architecture of the developed solution is di-
vided into three main modules: the preview focus as-
sessment module, the segmentation module and the
acquired picture focus assessment module, as de-
picted in Figure 1. For each obtained frame from
the camera preview, the image acquisition starts by
checking the image quality through an image focus
validation approach, followed by the segmentation of
the skin mole. After guaranteeing the quality and ad-
equacy on a certain number of consecutive frames,
a macroscopic image of the skin lesion is automati-
cally acquired without any user interaction. In this
final step, the acquired macroscopic image is evalu-
ated in terms of its quality with the acquired picture
focus assessment module and immediately presented
to the user.
Figure 1: System architecture diagram for the automated
mobile image acquisition of macroscopic skin lesions.
3.1 Datasets
3.1.1 Macroscopic Image Quality Assessment
Dataset
In order to assess the image quality and focus of skin
lesions in macroscopic images, a dataset of focused
and non-focused images was collected, named the
Macroscopic Image Quality Assessment (MacroIQA)
dataset.
The MacroIQA dataset is composed of a total of
3428 macroscopic images of skin moles from 19 dif-
ferent caucasian subjects. The images were acquired
with 10 different smartphones and cameras, from low
to high end smartphones models, in order to assure
overall robustness of the proposed solution. The goal
of acquiring this dataset is to have at least one blurred
and one focused image for each skin mole and smart-
phone. For each acquisition, both camera preview and
captured images were saved for the following pur-
poses: (i) in the preview stage, the goal is to assess
the image in terms of image stabilization and stan-
dardization, before starting the skin mole automated
segmentation; (ii) in the acquired stage, the goal is to
only check the quality and focus of the image that will
be stored in the system and further used for diagnosis
purposes; (iii) the preview images (1280 x 720 px)
have a smaller resolution compared to the acquired
images (1920 x 1080 px). A summary of the amount
of collected images and their distribution regarding
the focus level is provided in Table 1.
For the dataset collection, several aspects were
taken into account for ensuring proper variability of
the skin moles images within the recruited volun-
tary participants. Skin moles images were acquired
from subjects with different genders and skin tones,
HEALTHINF 2021 - 14th International Conference on Health Informatics
124
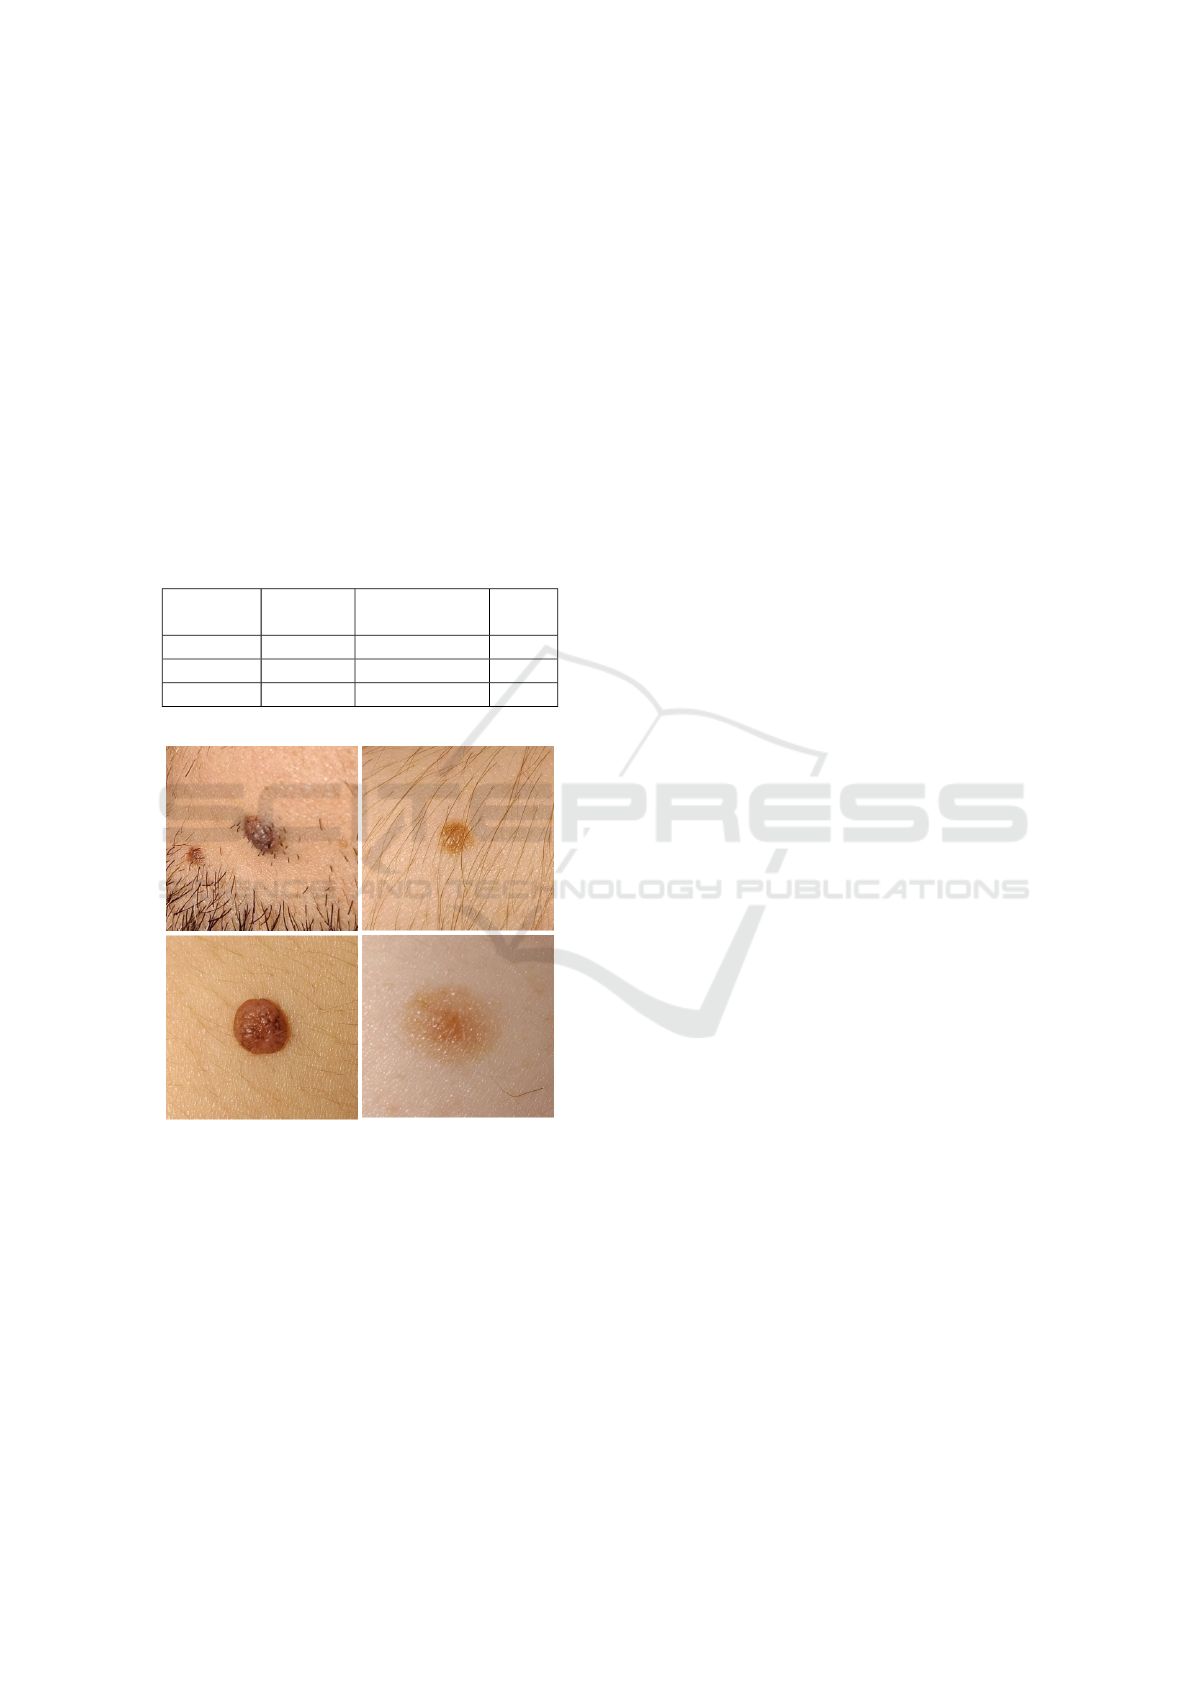
with phototypes varying from I to V. Moreover, the
selected skin lesions had different colors, sizes and
shapes as well as presence or absence of hair. This
variability in the dataset ensures that all selected fea-
tures need to be able to deal with these differences and
therefore making them more robust and suitable for its
use in a real life scenario. Some illustrative examples
of these skin lesions are also depicted in Figure 2.
Moreover, all collected images were annotated as
being focused or not focused by non-specialists in
this area and therefore, can be subjective and prone
to human error. Thus, and in order to minimize this
impact on the labelling, three independent annotators
performed the labelling of the entire dataset, being the
final label of each image defined by majority voting.
Table 1: Image type distribution in the MacroIQA dataset.
Images
Focused
Images
Non Focused
Images
Total
Preview 734 977 1711
Acquired 705 1012 1717
Total 1439 1989 3428
Figure 2: Illustrative examples of skin moles present in the
MacroIQA dataset.
3.1.2 Macroscopic Segmentation Datasets
In order to develop and evaluate the proposed seg-
mentation approach, we used two different image
datasets, namely the Dermofit image Library (Ltd,
2019) and the SMARTSKINS dataset (Vasconcelos
et al., 2014).
The Dermofit image database consists of 1300
high-quality color skin lesions images taken with
standard cameras, with matching binary segmentation
mask that denotes the lesion area. The lesions span
across 10 different classes based on gold standard di-
agnosis made by dermatology experts, with a total of
819 benign and 481 carcinogenic images.
The SMARTSKINS dataset was acquired at the
Skin Clinic of the Portuguese Institute of Oncology
of Porto involving 36 subjects. This dataset was ac-
quired with two different mobile devices and it com-
prises several subsets captured in different years. For
this work we selected a subset of 80 melanocytic le-
sions that have two different ground truths for the
lesion area (i.e. segmentation masks were manually
generated by different annotators), as well as medical
annotations regarding ABCD score and overall risk.
3.2 Preview and Acquired Image Focus
Assessment
Within the proposed solution, one of the most criti-
cal and important aspects is to evaluate an image in
terms of focus and image quality, independently of its
nature, i.e. being either a smaller resolution image
from the camera preview or the actual higher resolu-
tion image acquired by the smartphone. Thus, and
to fulfill this purpose, a feature-based algorithm ma-
chine learning approach was used for assessing pre-
view frame and acquired images independently.
The approach followed the usual machine learn-
ing pipeline, including the image pre-processing, fea-
ture extraction, model training and validation steps, as
described in the following subsections. Additionally,
the proposed system is intended to run in real-time
in a wide range of mobile devices, highlighting the
real need of overall robustness and speed while deal-
ing with limited computational resources. Therefore,
this limitation greatly influence the design of the ma-
chine learning pipeline, particularly by giving major
attention to the usage of light weighted image quality-
related features and machine learning models.
3.2.1 Image Pre-processing
The first step of this pipeline consisted in the resiz-
ing of the original image, since different devices were
used in the acquisition. According to its type, the pre-
view frame or the acquired images were resized to
1280 x 720 px and 1920 x 1080 px, respectively. Af-
terwards, each image was cropped to a central square
with a size of 35% of the original image, not only for
decreasing processing time but also to discard non-
interest regions from the original image. This cropped
image will be later used to extract image quality re-
lated metrics and for decision making, as explained
next. Additionally, the square region image is con-
verted to the grayscale colorspace, and then a newly
Automated Mobile Image Acquisition of Macroscopic Dermatological Lesions
125
artificially blurred image is generated. The generation
of this artificially blurred image is quite important for
the feature extraction step since a blurred image usu-
ally has soft edges, less color variation and brightness,
which means that pixels of the same area will have, in
the correspondent grayscale image, similar color val-
ues, thus resulting in a smaller variance of the color
values between these two types of images. The impact
of this operation, in an already blurred image will be
significantly smaller compared to a non blurred one
which may help its differentiation (Faria et al., 2019;
Alves et al., 2019). The blurred image is generated
by applying a mean filter to the grayscale image, as
described in (Faria et al., 2019).
3.2.2 Feature Extraction
A set of several state-of-the-art image quality related
features were extracted for each macroscopic image
in the dataset. The majority of the focus metrics used
in this study were already reported in (Vasconcelos
and Rosado, 2014; Alves et al., 2019). Also some
extra features were considered here such as gradi-
ent based functions (Thresholded absolute gradient;
Tenengrad variance), DCT-based functions (DCT Re-
duced Energy Ratio; Modified DCT) and other rele-
vant functions (Image contrast; Vollath’s standard de-
viation; Helmli and Scheres Mean Method), which
are detailed in (Santos et al., 1997; Pertuz et al., 2013)
(see Table 2).
These focus assessment features were calculated
for each grayscale and artificially blurred image pair.
Additionally, and following (Alves et al., 2019) study,
a new subset of features based on relative values were
estimated. This new set of features consists in the dif-
ference and the quotient between the obtained focus
feature values of grayscale and artificially blurred im-
age.
Finally, and by merging all the extracted absolute
and relative focus features, a feature space with a total
of 504 metrics was obtained.
3.2.3 Model Training and Optimization
In order to be able to automatically acquire focused
images of macroscopic skin lesions, an accurate and
robust model must be found for two different tasks:
the preview images focus assessment and the acquired
pictures focus assessment. Thus, the MacroIQA
dataset was split into two different sub-datasets, one
composed of only preview frame images and the other
with only acquired pictures enabling the creation of
two independent classification models.
The optimization and selection of the machine
learning pipeline was performed used a tool called
Feature-based Machine Learning (FbML) (Gonc¸alves
et al., 2019). This tool is based on the open-source
project auto-sklearn (Feurer et al., 2015), and allows
a search space initialization via meta-learning (search
for similar datasets and initialize hyper-parameter op-
timization algorithm with the found configuration)
while providing a vast list of options for data pre-
processing (balancing, imputation of missing values,
re-scaling), feature transformation, and feature and
classifier selection.
Table 2: Summary of features extracted for focus assess-
ment.
Group Feature name Measure
Energy Image Gradient Sum, mean, std, max
Squared Gradient Sum, mean, std, max
Gradient Thresholded Abs. Grad. Sum, mean, std, max
Tenengrad Sum, mean, std, max, var
Tenengrad Variance Sum, mean, std, max, var
Energy of Laplacian Sum, mean, std, max
Sum Modified Laplacian Sum, mean, std, max
Laplacian Diagonal Laplacian Sum, mean, std, max
Variance of Laplacian Mean, std, max, var
Laplacian and Gaussian Sum, mean, std, max
Gray Level Variance Sum, mean, std, min, max
Statistical Norm. Gray L. Variance Normalized variances
Histogram Entropy Sum (R, G, B, gray)
Histogram Range Sum (R, G, B, gray)
DCT Sum, mean, std, min, max
DCT/ DCT Reduced En. Ratio Sum, mean, std, min, max
DFT DFT Sum, mean, std, min, max
Modified DFT Sum, mean, std, min, max
Brenner’s Measure Sum, mean, std
Image Curvature Sum, mean, std, min, max
Image Contrast Sum, mean, std, min, max
Other Spatial Freq, Measure Sum, mean, std, max
Vollath’s Autocorrelation Sum, mean, std, max
Vollath’s Standard Dev. Sum, mean, std, max
Perceptual Blur Sum and mean (x, y axis)
HelmliScheres Mean Met. Sum, mean, std, min, max
As such, for each sub-dataset several machine learn-
ing pipelines were explored with the following op-
tions:
1. Scalers: Standardization (zero mean and unit
variance); Min-Max Scaling; Normalization to
unit length; Robust Scaler; Quantile Transformer;
None.
2. Feature Transformation/Selection: Principal
component analysis (PCA); Univariate Feature
Selection; Classification Based Selection (Ex-
tremely Randomized Trees and L1-regularized
Linear SVM); None.
3. Classifiers: K-Nearest Neighbors; Linear and
Non-linear Support Vector Machines; Decision
Trees; Random Forest; Adaboost.
HEALTHINF 2021 - 14th International Conference on Health Informatics
126

4. Validation Strategy: 10-Fold Cross Validation.
5. Optimization Metric: ROC-AUC.
Additionally, and due to the limited computational
capabilities of some smartphone models, and in or-
der to ensure not only real-time computation calcu-
lation of the focus metrics as well as real-time feed-
back to the user regarding the focus level on camera
preview frames, a final step for feature reduction was
also employed. As such, a constraint of only using
a maximum of three different features per classifica-
tion model was defined by the authors. Therefore, for
each trained and optimized machine learning pipeline,
all the possible combinations of three features were
evaluated using an iterative leave-one-session-out val-
idation approach. This additional feature reduction
step ensures that only a maximum of three features
are selected per classification model without compro-
mising the classification results, while the choice of
the leave-one-session-out for validation will ensure an
adequate overall robustness of the algorithm to vari-
ability presented in the data.
3.3 Lesion Segmentation
Since the requirement for the development of an au-
tomated acquisition of macroscopic skin images re-
lated with real-time usage on mobile devices was al-
ready considered in a previous work (Rosado and Vas-
concelos, 2015), it was used as ground basis of the
current work. However, to the best of our knowl-
edge, this methodology had only been tested on the
SMARTSKINS dataset, which is mostly composed of
pigmented skin lesions images (e.g. melanocytic ne-
vus), where the area inside the pigmented skin lesions
is usually darker than the surrounding skin. How-
ever, the Dermofit dataset is mostly composed of non-
pigmented skin lesions (e.g. basal and squamous cell
carcinomas), and we realized that optimizations could
be made to improve the performance of the previously
proposed approach for non-pigmented skin lesions.
In terms of pre-processing, the previous proposed
algorithm simply transforms the image to grayscale,
being a median blur afterwards applied to simplify
the structures present in the image. Alternatively,
in our work we tested the incorporation of 3 differ-
ent pre-processing steps: i) Brightness and Contrast
Adjustment; ii) Mean Shift Color Enhancement; and
iii) Grayscale Sharpening. Each processing step will
be detailed next, as well as the optimizations imple-
mented regarding segmentation and filtering proce-
dures.
3.3.1 Brightness and Contrast Adjustment
The brightness and contrast were adjusted through a
commonly used procedure, used with success in pre-
vious works (Rosado et al., 2017), that applies a con-
stant gain α and bias β to the original image. In partic-
ular, α and β will operate as the color range amplifier
and range shift, respectively. It should be noted that
the parameters are computed automatically by assum-
ing that the desired histogram range is 255, and only
intensities with more than 1% frequency are consid-
ered to define the minimum and maximum intensity
values used to stretch the histogram. As it can be seen
in Figure 3.B, this operation can have a great influ-
ence in pixels intensities, leading to unrealistic color
representations that make the transformed image un-
suitable for clinical decision purposes. However, the
demarcated contrast achieved with this operation is
very interesting for segmentation purposes, since it
will later facilitate the detection of the lesion area (see
Figure 3.F).
3.3.2 Mean Shift Color Enhancement
The second pre-processing step consists on a smooth-
ing procedure using Mean Shift Filtering (MSF). We
chose this particular filter due to its edge-preserving
characteristic, which was already used to improve the
following segmentation step (Rosado et al., 2017) by
simultaneously preserving the edges of stained com-
ponents and homogenizing color intensities. How-
ever, this technique is known to be computationally
heavy, so we will explore the trade-off between the
gains in the segmentation performance versus the im-
pact in the overall processing time (see Figure 3.C).
3.3.3 Grayscale Sharpening
The goal of this final pre-processing step is to in-
crease the sharpness of the stained components by us-
ing an unsharp masking procedure. Particularly, the
unsharped mask was obtained by blurring the target
image using a Gaussian filter with a fixed window ra-
dius of 15 and combining it with the original image
according to the weights of Equation (1):
I
Shar
=1.5×I
Gray
−0.5×I
Gau
−(0.75×I
Gray
0.2×I
Lap
), (1)
where the image I
Gray
is the grayscale image of the
brightness and contrast adjustment output and I
Shar
the sharpened image (see Figure 3.D). It is worth
noticing that a Laplacian component was also added
to the sharpening procedure. The unsharp mask can
cause artifacts on edge borders, so the Laplacian
component is responsible for avoiding double edges.
Automated Mobile Image Acquisition of Macroscopic Dermatological Lesions
127
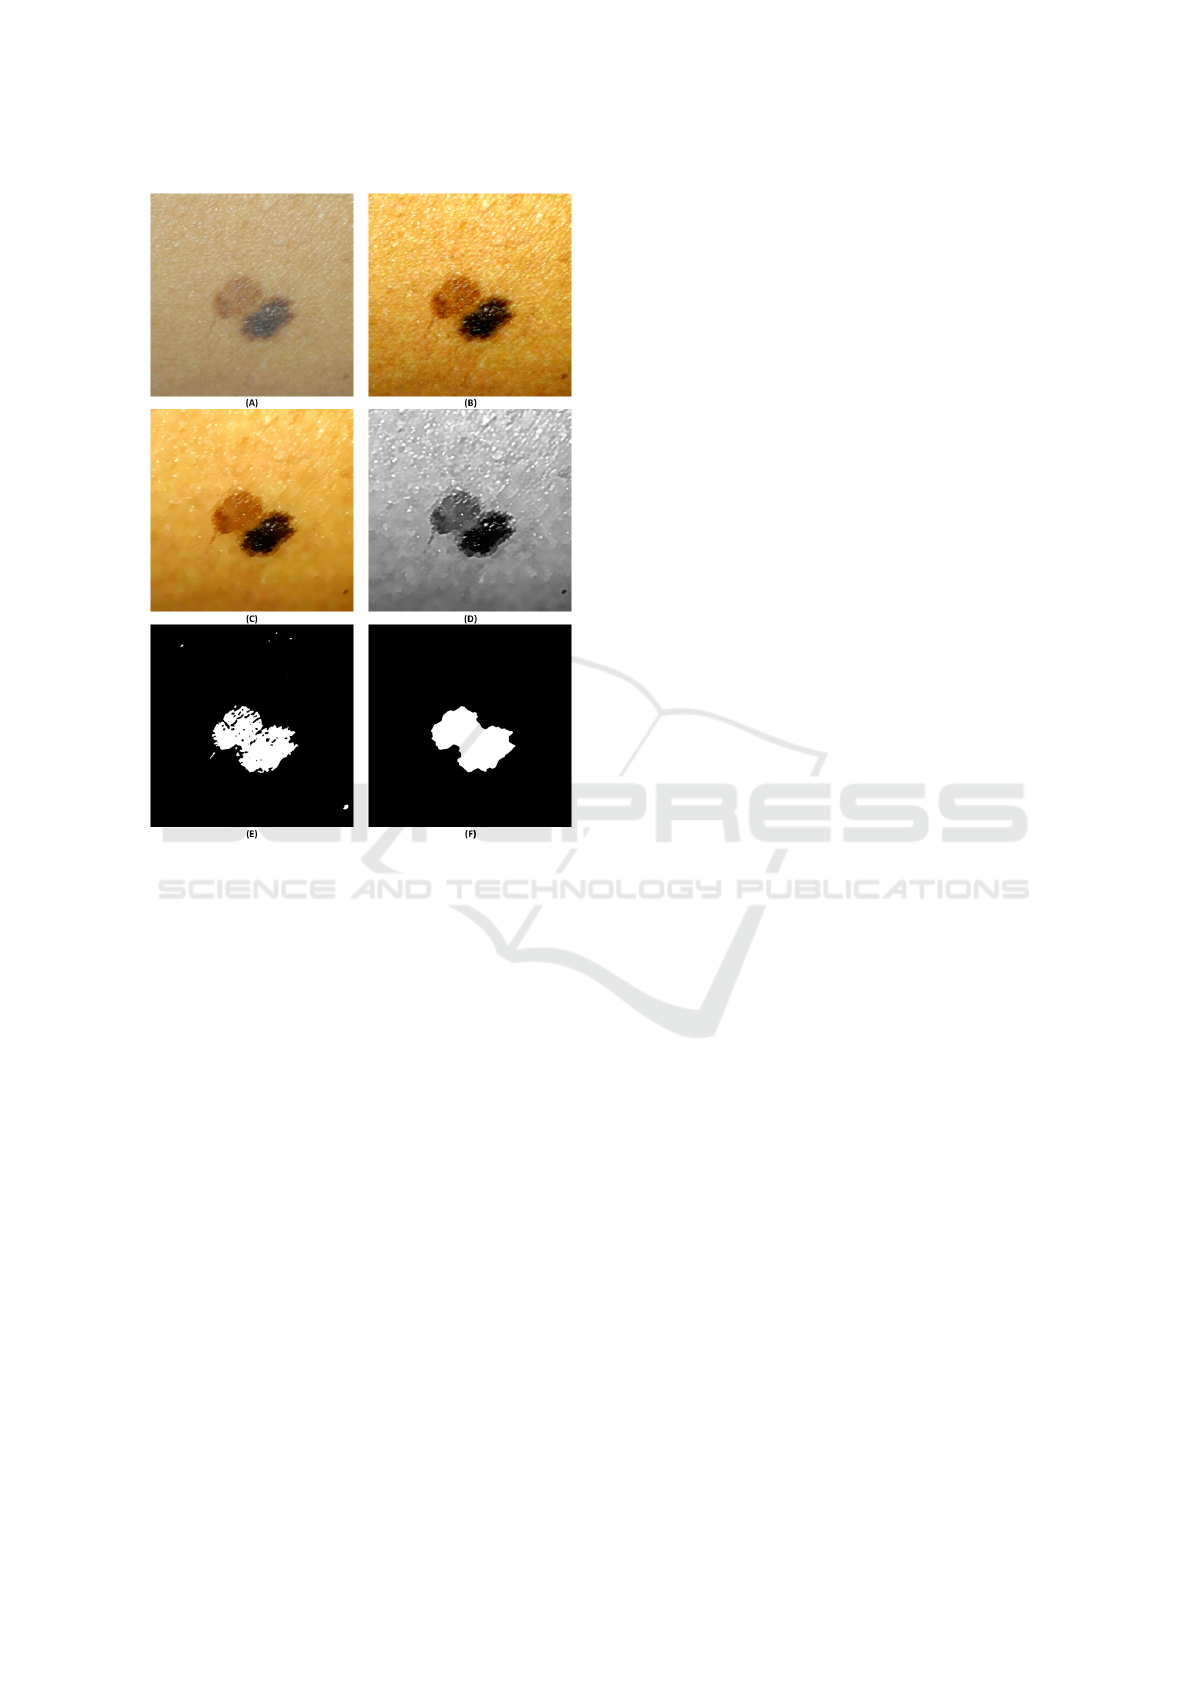
Figure 3: Skin lesion segmentation and filtering: (A) Orig-
inal image; (B) Brightness and contrast adjustment; (C)
Mean shift color enhancement; (D) Grayscale sharpening;
(E) Adaptive thresholding; (F) Morphological operations,
hole filling and area filtering.
This component was obtained through an element-
wise multiplication () of the original image with the
Laplacian of the original image using the following
kernel:
0 1 0
1 −4 1
0 1 0
.
3.3.4 Segmentation and Filtering
As proposed in (Rosado and Vasconcelos, 2015), the
segmentation procedure used in this work is also
based on adaptive thresholding. In particular, consid-
ering the pre-processed image I
Shar
, the correspond-
ing segmented image I
Seg
is obtained according to
Equation (2):
I
Seg
(x, y) =
0 if I
Shar
(x, y) > T
Shar
(x, y)
255 otherwise
,
(2)
where T
Sharp
is the mean intensity value of the square
region centered on the pixel location (x, y) with a
side value of W
Side
minus the constant C. Comparing
with the previous work, since our pre-processing steps
are effective in increasing the contrast between the
skin lesion and the surrounding skin, we adapted the
thresholding parameters accordingly, namely C = 45
and W
Side
= max{I
width
, I
height
} (see Figure 3.E).
In order to smooth the skin mole contours through
the elimination of narrow extensions and disruption
of thin connections with smaller objects, an opening
morphological operation with an elliptical structuring
element of size 7 is applied, followed by a hole-filling
procedure.
Regarding area filtering, all the binary objects that
represent less than 10% of the image area are dis-
carded. This way, even when the target mole is cor-
rectly segmented but with such a small area ratio, by
discarding this segmentation we force the user to ap-
proximate the smartphone of the target mole, thus en-
suring an adequate image size of the target skin mole.
Given that the vast majority of macroscopic images
acquired through the proposed approach on this paper
are composed by the target skin mole and surrounding
skin, we finalize the filtering procedure by selecting
the contour of the binary object with the biggest area
as the representative of the target skin mole contour
(see Figure 3.F).
3.4 Mobile Application
The presented pipeline in the previous subsections
was deployed as an Android application running in
a smartphone.
This application allows the automatic acquisition
of macroscopic images of skin lesions in an easy and
intuitive manner, while providing real-time feedback
to the user about the level of focus during and after
the acquisition process (see Figure 4). Moreover, in
case the developed automated image acquisition is not
able to detect the skin mole, the user is always able to
acquire an image by changing the image acquisition
to a manual mode. In the manual acquisition mode,
all previously described methods (section 3.2) are still
applied, apart from the automatic segmentation of the
skin lesion. Moreover, in this mode the user is re-
sponsible to press the camera button for triggering the
capture of an image.
To finalize, it is worth mentioning that the usabil-
ity tests on the same application interfaces were al-
ready performed and reported in (Faria et al., 2019),
but applied to a different use case in the area of der-
matology.
HEALTHINF 2021 - 14th International Conference on Health Informatics
128
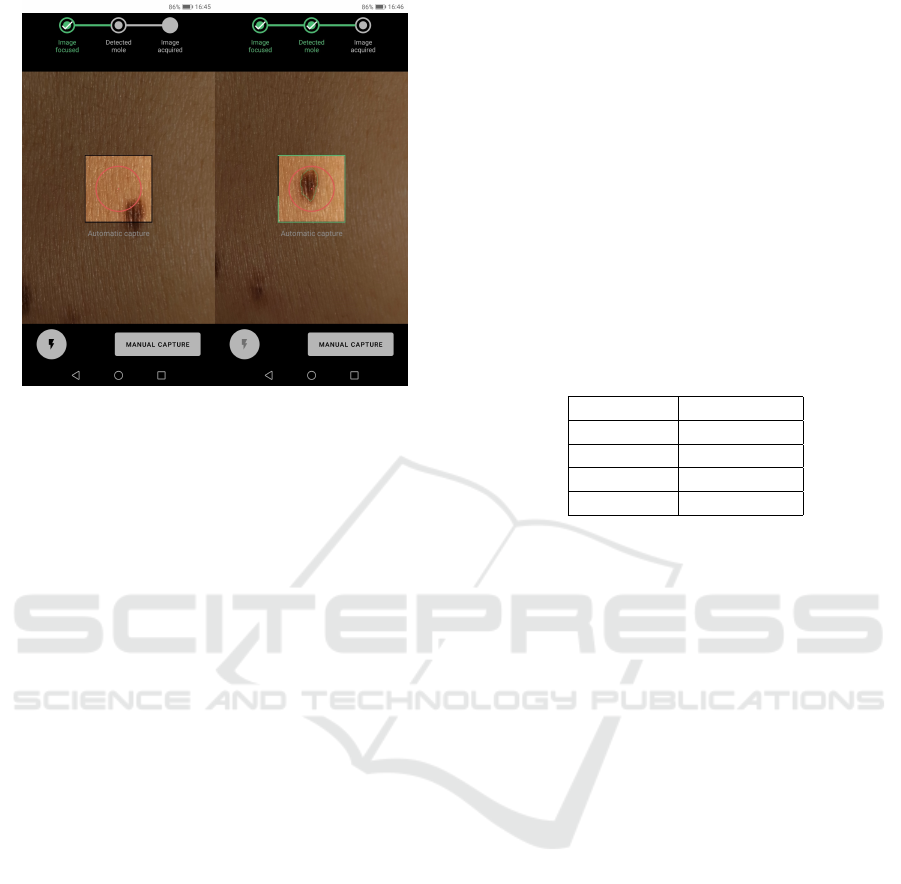
Figure 4: Application screenshots of: real-time preview fo-
cus assessment module indicating focused image and while
the lesion segmentation module is running, respectively.
4 RESULTS AND DISCUSSION
4.1 Preview Focus Assessment Results
The preview frame images focus assessment is prob-
ably the most important step within the proposed so-
lution, since the automatic evaluation of these images
with reduced resolution provided the most valuable
information that can be given to the user in real-time.
Thus, making this type of visual feedback, as depicted
in Figure 4, quite important to the user in the process.
The preview focus assessment model was created us-
ing the MacroIQA dataset. The best machine learning
pipeline found via the optimization approach detailed
on section 3.2.3 for image focus assessment of pre-
view images consisted in performing a scaling oper-
ation on the three selected features to zero mean and
unit variance, Standard Scaler, together with the use
of the Random Forest (number of trees: 100) classi-
fier. Moreover, the selected features for the preview
image focus assessment were the following Standard
Deviation of the Normalized Variance, Maximum of
the Laplace Diagonal and Maximum of Laplacian Fil-
ter, extracted from the grayscale image.
The classification results for the focus assessment
of the preview frame images are presented in Table 3.
Thus, as one can infer from these results, an overall
accuracy of 88.3%, sensitivity of 89.9% and a speci-
ficity of 87.1% were obtained for correctly identify-
ing if a certain preview frame image is actually fo-
cused or not. The use of only three different features,
all extracted from the preview grayscale images in
this case, proved to be sufficient to provided an ac-
curate and reliable classification in terms of image fo-
cus and quality. These metrics demonstrated to be
suitable for the rapid characterization of pixel values
intensity changes and discontinuities in camera pre-
view images, which highlights the added value of us-
ing this approach for screening and monitoring pur-
poses. Moreover, it is also worth notice that given
the high number of camera preview frame images
per second and it’s smaller resolution compared to
the acquired ones, the attained classification accuracy
and very similar results for specificity and sensitivity
can be considered to be used in real time, since each
one of these images is evaluated in terms focus while
promptly providing this feedback to the user.
Table 3: Classification results for the best performer model
for preview image focus assessment.
Metric Results (%)
Accuracy 88.3
Sensitivity 89.9
Specificity 87.1
F1-Score 86.8
4.2 Lesion Segmentation Results
In this section we assess the impact of the im-
plemented optimizations on the segmentation ap-
proach previously proposed for macroscopic skin le-
sions (Rosado and Vasconcelos, 2015). In particular,
we present a comparative study both in terms of seg-
mentation performance and processing time. Regard-
ing the MSF step, we were aware that this technique
is computationally heavy, and consequently eventu-
ally unfeasible for real-time usage, but its usage could
substantially improve the segmentation performance.
Thus, in table 4, we depict the results of our optimiza-
tion pipeline with and without the MSF step, in order
to evaluate the gains in the segmentation performance.
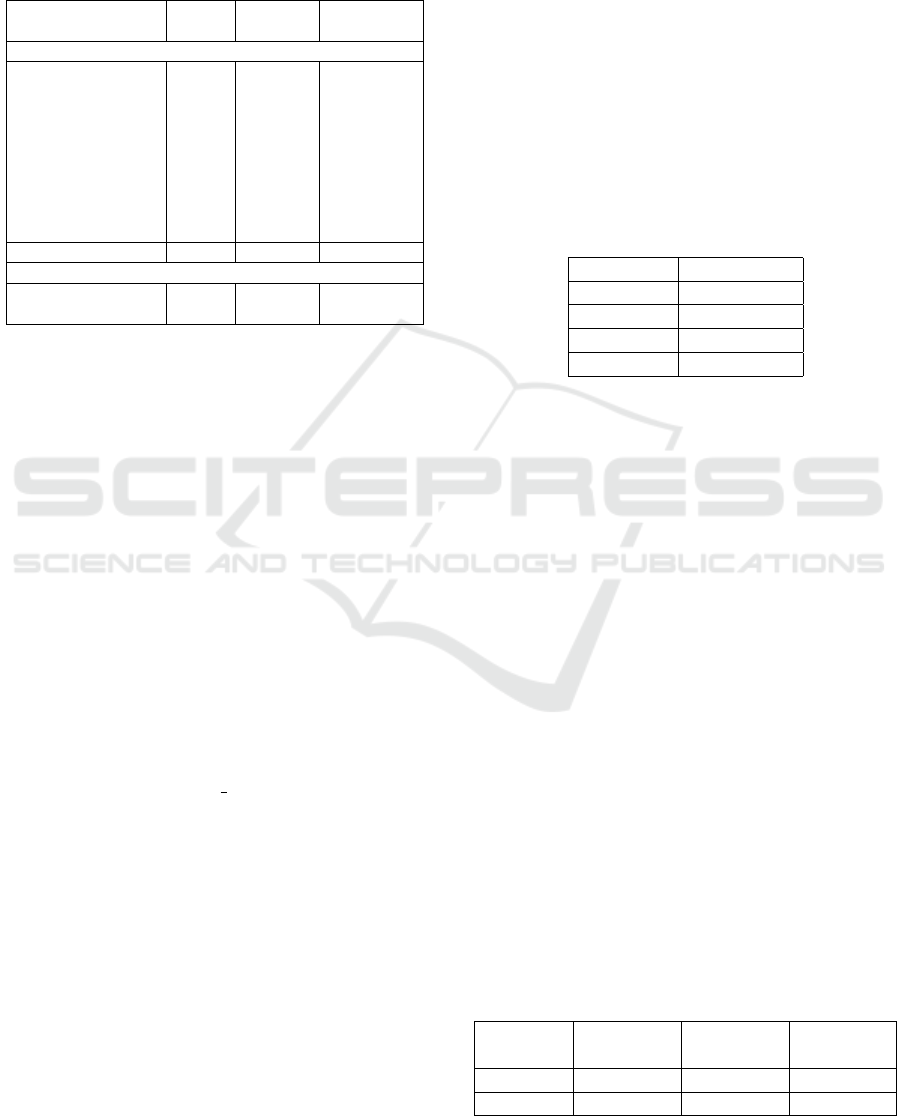
As we can see in Table 4, the proposed optimiza-
tions greatly improved the segmentation performance
on the Dermofit dataset. This demarcated improve-
ment is closely related with the fact that this method-
ology performs much better on non-pigmented skin
lesions, while the performance in the SMARTSKINS
dataset (which is mostly composed by images of pig-
mented skin lesions) also slightly improved. Re-
garding the MSF step, we can verify that its usage
marginally improves the segmentation performance
in some classes, but the mean processing time of the
overall segmentation process is greatly affected (al-
most 70 times slower), turning the applicability of the
MSF step unfeasible for in real-time scenarios. Con-
sidering this trade-off, we opted to remove its usage
from the segmentation pipeline integrated in the final
Automated Mobile Image Acquisition of Macroscopic Dermatological Lesions
129
version of the mobile application.
Table 4: Jaccard index (%) of the segmentation results for
both datasets, using: i) the Ros15 method (Rosado and Vas-
concelos, 2015); and ii): the proposed method, with and
without MSF.
Dataset
Ros15
method
Proposed
with MSF
Proposed
without MSF
Dermofit Dataset
Actinic Keratosis 11.91 33.27 36.50
Basal Cell Carcinoma 26.86 51.65 53.08
Dermatofibroma 57.76 76.84 75.56
Haemangioma 74.33 73.44 74.22
Malignant Melanoma 68.24 74.85 72.75
Melanocytic Nevus 51.25 79.29 79.81
Pyogenic Granuloma 73.99 74.18 73.41
Seborrhoeic Keratosis 39.93 73.71 74.08
Squam. Cell Carcinoma 35.52 49.13 52.54
Full dataset 45.20 67.87 68.59
SMARTSKINS Dataset
Ground Truth #1 84.59 86.11 86.44
Ground Truth #2 82.73 85.30 85.18
4.3 Acquired Images Focus Assessment
Results
The last step within the proposed solution is to ulti-
mately evaluate the focus of the acquired skin mole
pictures. These images are of the utmost interest for
the dermatologist, since a potential given diagnosis
can be derived from them. Therefore, assessing its
focus level is crucial and mandatory. This is not only
important for medical reasons but also to avoid the
acquisition and storage of pictures with insufficient
quality, that latter on will be discarded.
The best machine learning pipeline found via the
proposed optimization approach for the image focus
assessment of the acquired pictures consisted in per-
forming the same scaling operation as obtained for
the preview images Standard Scaler, together with
the use of the Adaboost (n estimators=77) classifier.
Moreover, the selected features for the acquired pic-
ture focus assessment were the following Difference
between Standard Deviation of the Thresholded Ab-
solute Gradient of gray and blur image, Division be-
tween the Standard Deviation of the Sum Modified
Laplacian of blur and gray image, Quotient between
the mean DCT Enery of blur and gray image.
The classification results for the focus assessment
of the acquired pictures are presented in Table 5.
Thus, as one can infer from these results, an overall
accuracy of 86.8%, sensitivity of 88.7% and a speci-
ficity of 85.6% were obtained for correctly identify-
ing if a certain acquired picture is focused or not.
Moreover, the use of only three different features, that
combines information both from the gray and arti-
ficially generated blurred images, proved to be able
to correctly evaluate the focus and quality of the ac-
quired pictures. These relative features, based on dif-
ferences and ratios between gray and blur images,
demonstrated to be helpful and discriminant for the
robust characterization and comparison of pixel val-
ues intensities within focused or non-focused images,
as previously reported in the literature (Alves et al.,
2019). Provided the existing variability in our dataset
in terms of skin mole’s shape, texture, size or even
subject’s gender and skin tones, the attained classifi-
cation results revealed to be quite accurate and robust
enough for using the proposed solution in real life.
Table 5: Classification results for the best model for image
focus assessment of acquired pictures.
Metric Results (%)
Accuracy 86.8
Sensitivity 88.7
Specificity 85.6
F1-Score 84.7
4.4 Algorithm Running Times
Several tests were conducted in order to evaluate the
processing time required by the algorithm and in or-
der to see if the user would notice any effects during
its use. For this study, three different mobile phones
were tested, a low, medium, and a high performance,
Xiaomi Redmi A2, Samsung A9 and Samsung S10e,
respectively.
The tests were performed in the following order.
The Android application was installed followed by a
restart of the smartphone. This way, we can ensure
similar memory conditions and a more uniform base-
line. Then, 1000 preview images were analysed and
50 pictures were taken in an attempt to simulate the
normal use of the application. The processing times
were taken for each instance and averaged in the end.
The speed test results for preview (focus assessment
and lesion segmentation) and acquired focus assess-
ment are displayed on Table 6.
Regarding the preview images processing times,
the measured values on the low end smartphone was
Table 6: Average speed test results on three different smart-
phones for preview and acquired picture focus assessment
(in miliseconds).
Xiaomi
Redmi Go
Samsung
S9
Samsung
S10e
Preview 35.96 ms 21.756 ms 16.598 ms
Acquired 352.36 ms 138.9 ms 57.94 ms
HEALTHINF 2021 - 14th International Conference on Health Informatics
130

relatively higher than the desired threshold. This
threshold has been determined to be around 20ms
which represents the maximum processing time of an
image before it starts affecting the normal functions of
the application. This is translated into a slight drag ef-
fect on the application’s video-camera that can be no-
ticeable by the user. However, this slight effect does
not hinder the use of the application in any way, and
also is not present in any of the medium or high per-
formance smartphones. As for the other two smart-
phones, the measured times are either around the cho-
sen threshold value or below, which creates a smooth
experience for the user.
As for the processing time of the acquired images,
while the photo is being processed a pop-up box ap-
pears informing the user of this process accompanied
by a loading icon. Since both the medium and high
performance smartphones present faster processing
times, this is translated into almost no waiting time
for the user and therefore the box is only briefly pre-
sented. On the low performance smartphone, this pro-
cessing time is slightly higher but it is still fast enough
to the point of not representing a unpleasant user ex-
perience or inducing the user into thinking that there
is something wrong with the application.
5 CONCLUSION AND FUTURE
WORK
The need to promote the usage of Mobile Telederma-
tology either to facilitate the early diagnosis, screen-
ing or monitoring processes led us to explore and de-
velop methodologies oriented for the standardization
of macroscopic image acquisition in dermatology.
In terms of the automated analysis of camera pre-
view images, our approach demonstrated to be suit-
able for the real-time assessment of image focus with
an accuracy and F1-score of 88.3% and 86.8%, re-
spectively. The obtained results for the preview focus
assessment module revealed to be quite promising not
only in terms of being capable of properly differenti-
ating focused from non-focused images but also by
ensuring its processing in real-time and feedback to
the user.
A segmentation algorithm was developed, start-
ing with pre-processing steps of brightness and con-
trast adjustment, mean shift color enhancement, and
grayscale sharpening, followed by a segmentation
based on adaptative thresholding and final morpho-
logical operations. The methodology was tested in
two different datasets, Dermofit and SMARTSKINS,
which comprise both pigmented and non-pigmented
lesions, and a Jaccard index of 68.59% was achieved
for Dermofit, as well as 86.44% for SMARTSKINS,
surpassing the literature results for the latter.
Regarding the automated analysis of acquired pic-
tures, our approach also demonstrate adequate re-
sults for the assessment of image focus with an ac-
curacy and F1-score of 86.8% e 84.7%, respectively.
The obtained results for the acquired picture assess-
ment module showed to be relatively accurate and ro-
bust, ultimately helping in acquisition of focused skin
moles pictures reducing the total number of acquired
images unsuitable for clinical purposes.
To finalize, an embedded Android application
with the proposed methodology was also developed,
in order to test the viability of the proposed approach
in a real life scenario. Empirically, the obtained re-
sults through the real-time usage of the developed ap-
plication seem to be in line with the results here de-
scribed, being more than sufficient for its overall use
in practice.
As future work, it is worth mentioning that the
development of a similar iOS application is already
in progress using the same presented models and fur-
ther testing in real clinical settings are being planned,
in order to properly evaluate the performance and
suitability of the proposed approach. Additionally,
we aim to explore suitable deep learning approaches
that can be deployed in mobile devices to improve
these automated procedures, with major focus in
the improvement of real-time segmentation of non-
pigmented skin lesions.
ACKNOWLEDGEMENTS
This work was done under the scope of project
“DERM.AI: Usage of Artificial Intelligence to
Power Teledermatological Screening”, with reference
DSAIPA/AI/0031/2018, and supported by national
funds through ‘FCT—Foundation for Science and
Technology, I.P.’.
REFERENCES
Alves, J., Moreira, D., Alves, P., Rosado, L., and Vascon-
celos, M. (2019). Automatic focus assessment on der-
moscopic images acquired with smartphones. Sensors
(Switzerland), 19(22):4957.
Andrade, C., Teixeira, L. F., Vasconcelos, M. J. M., and
Rosado, L. (2020). Deep learning models for seg-
mentation of mobile-acquired dermatological images.
In International Conference on Image Analysis and
Recognition, pages 228–237. Springer.
Apalla, Z., Nashan, D., Weller, R. B., and Castellsagu
´
e,
X. (2017). Skin cancer: epidemiology, disease bur-
Automated Mobile Image Acquisition of Macroscopic Dermatological Lesions
131

den, pathophysiology, diagnosis, and therapeutic ap-
proaches. Dermatology and therapy, 7(1):5–19.
B
¨
orve, A., Gyllencreutz, J., Terstappen, K., Backman,
E., Aldenbratt, A., Danielsson, M., Gillstedt, M.,
Sandberg, C., and Paoli, J. (2014). Smartphone
teledermoscopy referrals: A novel process for im-
proved triage of skin cancer patients. Acta dermato-
venereologica, 95.
Commissioning, P. C. (2011). Quality standards
for teledermatology using ’store and forward’
images. https://www.bad.org.uk/shared/get-
file.ashx?itemtype=document&id=794. Last accessed
September, 24th, 2020.
Dahl
´
en Gyllencreutz, J., Johansson Backman, E., Terstap-
pen, K., and Paoli, J. (2018). Teledermoscopy images
acquired in primary health care and hospital settings -
a comparative study of image quality. Journal of the
European Academy of Dermatology and Venereology,
32(6):1038–1043.
de Carvalho, T. M., Noels, E., Wakkee, M., Udrea, A., and
Nijsten, T. (2019). Development of smartphone apps
for skin cancer risk assessment: progress and promise.
JMIR Dermatology, 2(1):e13376.
Dugonik, B., Dugonik, A., Marovt, M., and Golob, M.
(2020). Image quality assessment of digital image
capturing devices for melanoma detection. Applied
Sciences (Switzerland), 10(8):2876.
Errichetti, E. and Stinco, G. (2016). Dermoscopy in general
dermatology: a practical overview. Dermatology and
therapy, 6(4):471–507.
EuroMelanoma (2020). https://www.euromelanoma.org/intl.
Last accessed September, 24th, 2020.
Faria, J., Almeida, J., Vasconcelos, M. J. M., and Rosado,
L. (2019). Automated mobile image acquisition of
skin wounds using real-time deep neural networks. In
Annual Conference on Medical Image Understanding
and Analysis, pages 61–73. Springer.
Ferlay, J., Colombet, M., Soerjomataram, I., Mathers, C.,
Parkin, D., Pi
˜
neros, M., Znaor, A., and Bray, F.
(2019). Estimating the global cancer incidence and
mortality in 2018: Globocan sources and methods. In-
ternational journal of cancer, 144(8):1941–1953.
Fernandes, K., Cruz, R., and Cardoso, J. S. (2018). Deep
image segmentation by quality inference. In 2018
International Joint Conference on Neural Networks
(IJCNN), pages 1–8. IEEE.
Feurer, M., Klein, A., Eggensperger, K., Springenberg, J.,
Blum, M., and Hutter, F. (2015). Efficient and robust
automated machine learning. In Advances in neural
information processing systems, pages 2962–2970.
Finnane, A., Curiel-Lewandrowski, C., Wimberley, G., Caf-
fery, L., Katragadda, C., Halpern, A., Marghoob,
A. A., Malvehy, J., Kittler, H., Hofmann-Wellenhof,
R., Abraham, I., and Soyer, H. P. (2017a). Proposed
technical guidelines for the acquisition of clinical im-
ages of skin-related conditions. JAMA Dermatology,
153(5):453–457.
Finnane, A., Dallest, K., Janda, M., and Soyer, H. P.
(2017b). Teledermatology for the diagnosis and man-
agement of skin cancer: a systematic review. JAMA
dermatology, 153(3):319–327.
Flores, E. and Scharcanski, J. (2016). Segmentation
of melanocytic skin lesions using feature learning
and dictionaries. Expert Systems with Applications,
56:300–309.
Gonc¸alves, J., Conceic¸ao, T., and Soares, F. (2019). Inter-
observer reliability in computer-aided diagnosis of di-
abetic retinopathy. In HEALTHINF, pages 481–491.
Ltd, E. I. (2019). Dermofit image library - edinburgh in-
novations. https://licensing.eri.ed.ac.uk/i/
software/dermofit-image-library.html. Last
accessed 11 June 2019.
Lubax, I. (2019). Dermpic. (mobile software).
Munteanu, C. (2016). Spotmole. (mobile software).
Oliveira, R. B., Marranghello, N., Pereira, A. S., and
Tavares, J. M. R. (2016). A computational approach
for detecting pigmented skin lesions in macroscopic
images. Expert Systems with Applications, 61:53–63.
Pertuz, S., Puig, D., and Garcia, M. A. (2013). Analysis of
focus measure operators for shape-from-focus. Pat-
tern Recognition, 46(5):1415–1432.
Rat, C., Hild, S., S
´
erandour, J. R., Gaultier, A., Quereux,
G., Dreno, B., and Nguyen, J.-M. (2018). Use of
smartphones for early detection of melanoma: sys-
tematic review. Journal of medical Internet research,
20(4):e135.
Rosado, L., Da Costa, J. M. C., Elias, D., and Cardoso, J. S.
(2017). Mobile-based analysis of malaria-infected
thin blood smears: automated species and life cycle
stage determination. Sensors, 17(10):2167.
Rosado, L. and Vasconcelos, M. (2015). Automatic seg-
mentation methodology for dermatological images ac-
quired via mobile devices. In Proceedings of the Inter-
national Joint Conference on Biomedical Engineering
Systems and Technologies-Volume 5, pages 246–251.
SCITEPRESS-Science and Technology Publications,
Lda.
Santos, A., Ortiz de Sol
´
orzano, C., Vaquero, J. J., Pena,
J. M., Malpica, N., and del Pozo, F. (1997). Evalu-
ation of autofocus functions in molecular cytogenetic
analysis. Journal of microscopy, 188(3):264–272.
Udrea, A. and Lupu, C. (2014). Real-time acquisition of
quality verified nonstandardized color images for skin
lesions risk assessment - A preliminary study. In
2014 18th International Conference on System The-
ory, Control and Computing, ICSTCC 2014, pages
199–204. Institute of Electrical and Electronics Engi-
neers Inc.
Vasconcelos, M. J. M. and Rosado, L. (2014). No-
reference blur assessment of dermatological images
acquired via mobile devices. In International Confer-
ence on Image and Signal Processing, pages 350–357.
Springer.
Vasconcelos, M. J. M., Rosado, L., and Ferreira, M. (2014).
Principal axes-based asymmetry assessment method-
ology for skin lesion image analysis. In Interna-
tional symposium on visual computing, pages 21–31.
Springer.
HEALTHINF 2021 - 14th International Conference on Health Informatics
132
