
Player-Type-based Personalization of Gamification in Fitness Apps
Nadine Sienel, Patrick Münster and Gottfried Zimmermann
*
Responsive Media Experience Research Group, Hochschule der Medien, Stuttgart, Germany
Keywords: Gamification, Fitness Apps, Personalization.
Abstract: This paper examines the effect of personalized gamification on an individual’s motivation in the context of
fitness apps. In a first study, we evaluate the four categorization models "Bartle Player Types", "Big Five",
"Hexad User Types", and "BrainHex" on their ability to predict individual gamification preferences of users
and develop a new prediction model called “MoMo”. Bartle, BrainHex, and MoMo are validated empirically
in a second study, employing off-the-shelf fitness apps with gamification elements. The results of both studies
indicate that a prediction is possible using the categorization models. Among all models, MoMo performs
best in predicting individual gamification preferences, followed by BrainHex. Results of the second study
indicate that, although the models MoMo and BrainHex perform better in predicting the theoretical rating of
gamification elements than the random model, the prediction of the real motivation value in a specific fitness
app is more difficult. This may be due to the concrete implementation of the elements in the second study,
and due to the general problem of (theoretically) rating gamification elements without having experienced
them in a real application.
1 INTRODUCTION
Fitness apps aim to support users in enhancing their
health. One goal thereof is to increase the motivation
of the users to engage in sports. The present study,
therefore, examines the influence of individualized
gamification on the increase of motivation in the
context of fitness apps.
Gamification has its origins in the digital media
industry, where its first use is documented in 2008
(Deterding et al., 2011). The definition of Deterding
et al. (2011) is mostly used in literature, defining it as:
“the use of game design elements in non-game
contexts”. Later on, Werbach (2014) presents a
revised definition of the term gamification: In his
opinion, gamification should be defined as a process
of making activities playful. He justifies this with the
fact that not everything containing a game element
automatically generates gamification, but rather that
the entire experience in a system is important.
Whether the applied gamification of a system
achieves the desired effect, e. g. an increase in
motivation to eat a healthy diet or do sports, depends
on the personal preferences of each individual user
(Ferro, 2018). A possible approach for personalized
gamification is the categorization of users by means
*
www.hdm-stuttgart.de/home/gzimmermann
of categorization models like the Bartle Player Types
and a personalized gamification design that is derived
from these models. Some researchers have already
worked on the evaluation of categorization models for
the personalization of gamification. Kocadere and
Çağlar (2018) examined the influence of the Bartle
Player Types on gamification preferences; their
results show differences (albeit small) between the
different types. The effects of the Big Five
personalities on the preferences for game elements of
users have also been investigated in several studies,
such as Ferro (2018). However, their results indicate
that they have little impact. The Hexad User Types
are evaluated in several studies on the personalization
of gamification, for example by Mora et al. (2019)
who found correlations between the User Types and
gamification preferences. In contrast to the studies
mentioned above, Hallifax et al. (2019) do not focus
on a single model but compare the three models
BrainHex, Hexad, and Big Five in terms of their
influence on gamification preferences. The results of
the study show that Hexad is most suitable for
predicting preferences (Hallifax et al., 2019).
This previous research shows that categorization
by categorization models is promising with regard to
the prediction of personal preferences in gamification.
Sienel, N., Münster, P. and Zimmermann, G.
Player-Type-based Personalization of Gamification in Fitness Apps.
DOI: 10.5220/0010230603610368
In Proceedings of the 14th International Joint Conference on Biomedical Engineering Systems and Technologies (BIOSTEC 2021) - Volume 5: HEALTHINF, pages 361-368
ISBN: 978-989-758-490-9
Copyright
c
2021 by SCITEPRESS – Science and Technology Publications, Lda. All rights reserved
361

However, most of these studies focus on only one of
the categorization models.
This paper focuses on the comparison of four
models (Bartle, Big Five, Hexad, and BrainHex), and
on developing a specific model of the motivational
value (MoMo for short) using a set of questions from
the four categorization models to predict preferences
in gamification elements. Besides, many of the
studies mentioned above were only conducted in the
laboratory and the participants had to rate the patterns
without “playing” with them. In our second study, we
asked the participants to rate the patterns before and
after the extensive use of real fitness apps
implementing gamification patterns.
The remainder of this paper is structured as
follows: Chapter 2 specifies a set of relevant
gamification elements, derived from literature.
Chapter 3 describes the four used categorization
models. Chapter 4 explains our methodological
approach, chapter 5 (study 1) and chapter 6 (study 2)
describe the methods and results of the two conducted
studies. Finally (chapter 7), we discuss the results and
possible implications.
2 GAMIFICATION ELEMENTS
To develop a model that can predict the gamification
preferences of users, it is necessary to first determine
which different gamification elements exist. For this
purpose, we developed a list of 30 gamification
elements based on gamification elements mentioned
in the literature (see Table 1).
3 CATEGORIZATION MODELS
To determine preferences, we applied categorization
models for player types. These serve as a basis for
differentiating between participants in order to
identify differences and similarities in their
preferences. Various categorization models are
discussed in the literature, of which four of the best-
known models are used in this study. These
categorization models are the following.
3.1 Bartle Player Types
The Bartle Player Types are known as one of the most
basic categorizations of players (Kocadere & Çağlar,
2018). They were developed by the British professor
Richard Bartle and are based on the Multi-User
Dungeons genre (Bartle, 1996). The Bartle Player
Types contain the following four player types:
Achiever (“Acting on the World”), Explorer
(“Interacting with the World”), Killer (“Acting on
other Players”), and Socializer (“Interacting with
other Players”) (Bartle, 1996).
To determine the Bartle Player Types, we used the
Bartle Test developed by the authors González
Mariño et al. (2018). As the questions of the test itself
are not mentioned in the paper González Mariño et al.
(2018), we requested them from the authors by e-
mail.
3.2 Big Five
The Big Five, also known as the OCEAN model, is a
widely used personality model (Suryapranata et al.,
2020). The five dimensions of the Big Five are
defined by Rammstedt et al. (2013) as follows:
Agreeableness (a person's behavior towards other
people), Conscientiousness (behavior of a person
during the completion of a task), Extraversion
(behavior of a person towards their environment),
Neuroticism (emotional stability of a person), and
Openness to experience (how interested a person is
in new things).
In this paper, for the determination of the Big
Five, the test “10 Item Big Five Inventory” (short:
BFI-10) by Rammstedt et al. (2013) is used.
Table 1: List of gamification elements with definitions. Mentions of the elements in the literature: 1 = Arango-López et al.
(2017), 2 = Chou (2016), 3 = Deterding et al. (2011), 4 = Ferro (2018), 5 = Hallifax et al. (2019), 6 = Kocadere and Çağlar
(2018), 7 = Raftopoulos et al. (2015), 8 = Suryapranata et al. (2020), 9 = Swacha and Muszyńska (2016).
Achievement Symbol [2, 3, 4, 5, 6, 7, 8] Discussionboard [5] Progress Bar [1, 2, 4, 5, 9]
Assessment [9] Feedback [2, 3, 8, 9] Record [6, 9]
Avatar [2, 4, 8, 9] Gift [1, 2, 4, 6, 9] Reward [1, 2, 4, 5, 6, 9]
Brag Button [2, 9] Leaderboard [1, 2, 3, 4, 5, 6, 7, 9] Schedule [2, 5, 9]
Challenge [1, 2, 3, 4, 7, 9] Level [2, 3, 4, 5, 6, 8, 9] Social Feedback [1]
Choice [2, 9] Number Limit [2] Social Graph [9]
Collection Set [2, 9] Performance Graph [2, 9] Team [2, 5, 6, 9]
Unlocking [2, 4, 6, 9] Permadeath [4] Time Limit [1, 2, 3, 4, 5]
Crowning [2, 7, 9] Points [1, 2, 4, 5, 6, 7, 9] Topic [2, 4, 6, 8, 9]
Difficulty Selection [4] Prize Pacing [2, 9] Torture Break [2, 9]
HEALTHINF 2021 - 14th International Conference on Health Informatics
362

3.3 Hexad User Types
The Hexad User Types were developed by Andrzej
Marczewski to provide a user-type model specifically
for gamification (Hallifax et al., 2019). Marczewski
(2016) describes the following user types: Achiever
(intrinsically motivated by mastery), Free Spirit
(intrinsically motivated by autonomy),
Philanthropist (intrinsically motivated by purpose
and meaning), Socializer (intrinsically motivated by
relatedness), Disruptor (extrinsically motivated by
change), and Player (extrinsically motivated by
rewards).
The test developed by Tondello et al. (2016) is the
official test for the determination of the Hexad User
Types and is used in this study.
3.4 BrainHex
The BrainHex was developed by the company
International Hobo Ltd. (2011). It was developed
based on existing research on players and knowledge
of underlying neurobiological mechanisms (Nacke et
al., 2011). The BrainHex types contain the following
types: Achiever (is motivated by long-term success),
Conqueror (does not want to win easily in a game),
Daredevil (seeks the thrill and the risk), Mastermind
(wants problems for which a strategy is needed),
Seeker (enjoys moments of wonder), Socializer (is
focused on the other people), and Survivor (enjoys
strongly negative experiences such as terror) (Nacke
et al., 2011).
The BrainHex types can be determined by a
questionnaire, which is available online (International
Hobo Ltd., 2019). The evaluation of the test was not
published completely. Therefore, we derived its
categorization logic by reverse engineering, using the
publication of Nacke et al. (2011) as well as the
displayed results on the website of International Hobo
Ltd. (2019).
4 METHODS
To develop and validate a model based on users’
categorization models, we first conducted a user
research (study 1) to determine the preferences in
gamification elements of users. Based on the results
of this first study, we compared the different
categorization models and developed subsequently
the motivational value model (MoMo) for predicting
preferences. Finally, we validated the prediction
power of MoMo, Bartle, and BrainHex for fitness in
a second study.
5 USER RESEARCH (STUDY 1)
5.1 Methods for User Research
Our first user research served for a better
understanding of the users’ preferences in
gamification patterns and their relationships to the
various models for categorizing users. Based on these
results, we developed models for predicting
preferences.
To collect the data of study 1, we developed a
questionnaire. It uses the tests mentioned above to
determine the Bartle Player Types, Big Five, Hexad
User Types, and BrainHex Types. Additionally, a few
demographic data are requested and the participants
are asked to rate the 30 elements on a 5-Likert scale
from “demotivates me very much” through “neutral”
to “motivates me very much”, supported by a
definition and a descriptive image. We tested the
questionnaire in a pilot study and subsequently
adjusted it, based on the results.
For the evaluation of the survey, we made a
distinction between players and non-players, by using
the question "How many hours do you play per
week?". We wanted to find out whether there are
differences between players and non-payers.
Participants who play more than 2 hours per week
were classified as "players", whereas those who play
two or fewer hours per week were classified as "non-
players".
We used linear regression analysis to calculate
regression models for predicting the preferences of
each gamification element. For this purpose, we
performed multiple regression per gamification
element and categorization model, using the method
"stepwise". Finally, we compared the average R
2
value and the number of predictable gamification
patterns between the five models. The resulting
regression models are used as the basis for the
calculation of preferences in study 2 (see section 4.4).
5.2 Creating the Model of Motivational
Value (MoMo)
To create the MoMo, we used a correlation matrix in
which all questions and results of the four
categorization models are correlated with the ratings
of the gamification elements. Such a correlation
matrix is created for players, non-players, and all
participants. Using the correlation matrixes, we
selected all questions and results of the models whose
significance value is less than 0.01 or, if not available,
less than 0.05, for multiple linear regression. For each
Player-Type-based Personalization of Gamification in Fitness Apps
363

gamification element, the regression model with the
highest R
2
value and the lowest significance value is
selected.
Afterward, we compared the regression models of
all participants, all players, and all non-players. This
makes it possible to determine whether there are
major differences between the models of players and
non-players. Furthermore, the best regression model
can be selected for each gamification element
individually by deciding whether a division into
player and non-player is appropriate.
5.3 Results
5.3.1 Description of the Sample
We collected the survey data in the period from May
5th, 2020 to May 20th, 2020. For this purpose, we
invited the participants via email to complete the
questionnaire online. A total of 122 participants fully
completed the survey. Of the participants, 56.6 %
were male and 43.4 % female, which makes the
distribution quite balanced. Less balanced, however,
is the distribution in age: the sample consisted of
persons aged 18-64 years, with almost three-quarters
of the respondents between 18 and 30 years old, 16.4
% of the participants between 31 and 40 years old,
and just under 11 % over 40 years old. The
categorization of players and non-players results in a
distribution of 59.1 % players and 40.9 % non-
players. 7 participants did not provide any
information about the playing time and therefore
could not be classified.
5.3.2 Differentiation of Players and
Non-Players
After analyzing the individual regression models for
MoMo for players, non-players, and all participants
in total, the regression models for all participants
performed worse than the regression models for
players and non-players separately. Therefore, we
carried out further evaluations separately, for players
and non-players only.
5.3.3 Comparison of the Models
We compared the four user categorization models as
well as the MoMo based on the R
2
value and the
number of significantly predictable gamification
elements, divided into players, non-players, and all
participants. Figure 1 shows that MoMo is the only
model that can predict all 30 gamification elements
for players, non-players, and all participants. Thus,
the MoMo scores best in this comparison, followed
by BrainHex and Hexad. For players, the Big Five are
the least suitable, with only 15 predictable elements.
For non-players and all participants, however, Bartle
scores the worst in this comparison. The opposite is
true when comparing the coefficient of determination,
where BrainHex is best for both players and non-
players. The coefficient of determination of the Big
Five and Bartle models is also opposite to the number
of predictable elements. For players, both models have
the same coefficient of determination. For non-players
and all participants, however, the coefficient of
determination of Bartle is greater than that of Big Five.
To validate the models in a subsequent study 2,
we included the two best models from study 1. These
are MoMo and BrainHex. Since MoMo covers all
questions of Bartle, Bartle is also implicitly included
in the validation.
6 VALIDATION (STUDY 2)
6.1 Methods for Validation
Based on the results of the user research, the two best
models are selected for validation: MoMo and
BrainHex. The goal is to validate whether the
prediction of preferences is possible with these two
models. For this purpose, we conducted a longitudinal
study over two weeks. Participants first filled out an
online questionnaire (questionnaire 1) that contains
the same questions as the questionnaire of study 1 but
shortened to the questions necessary for the
prediction. After completing the questionnaire, we
asked the participants to use a fitness app which they
should test for about one week. Two real fitness apps
were available for this purpose, both containing
various gamification elements. For the selection, we
first tested different fitness apps and evaluated them
according to the criteria of the checklist with the
quality criteria catalog of the Technical University of
Dortmund (Reh@pp-Quality, 2016). Due to the
relatively comparable range of functions, the same
quality evaluation, and different gamification
elements contained in the apps, MyFitnessPal and
Virtuagym were selected for validation. After the test,
the participants filled out a second questionnaire
(questionnaire 2) containing the same questions as the
first questionnaire of study 2, and additionally the
ratings of the gamification elements implemented by
the tested app and their influence on the motivation to
engage in sports. Furthermore, we conducted a semi-
structured interview with four participants to evaluate
the gamification elements tested. The participants
were randomly selected.
HEALTHINF 2021 - 14th International Conference on Health Informatics
364
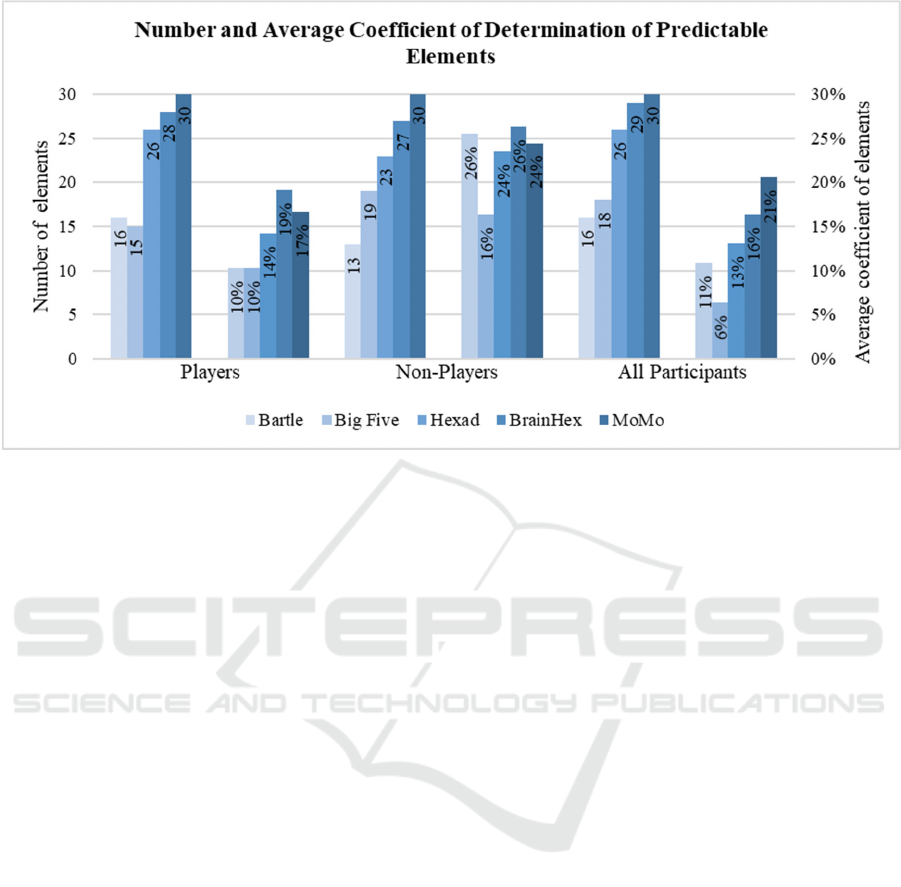
Figure 1: Comparison of the five models Bartle, Big Five, Hexad, BrainHex and MoMo in the number and average coefficient
of determination of predictable elements.
To compare the participants’ preferences of
gamification elements with the predictions calculated
by the models, both the real and the calculated ratings
are categorized according to the following scheme:
Min – 2.5 = “demotivated”
2.5 – 3.5 = “neutral”
3.5 – Max = “motivated”
The values resulting from the categorization can
then be compared by analyzing whether the
prediction and the rating are the same (“correct
prediction”) or not (“incorrect prediction”). To
compare the models and evaluate the quality of the
predictions, we determined the number of correctly
predicted scores per gamification element and
participant. For the evaluation of the prediction
quality, we compared the number of correct
predictions with a random model, derived from a
normal distribution of the three categorization
possibilities (“motivated”, “neutral”, “demotivated”).
Due to the three categorization possibilities, the
expected value of this random model is 1/3. This
results in a random model of 10 out of 30 correct
predicted gamification elements per participant.
Consequently, for 6 out of 19 participants, the
preference in a gamification element is correctly
predicted.
For the validation of the predictions in real apps,
however, the random model is calculated for each
gamification element individually, since some
participants had missed a gamification element in the
app and therefore could not rate it. With participants
not rating some elements, a fixed random model
could falsify the results. This falsification can be
prevented by calculating the random model in the
following way: multiplying the number of
participants who have seen the element in the app by
1/3.
6.2 Results
6.2.1 Description of the Sample
We collected the data in the period from July 20th,
2020 to August 7th, 2020, by inviting participants via
email to participate in the study. A total of 19
participants took part in the study. Of the participants,
57.9 % were female and 42.1 % male. The sample
consisted of persons aged 22-54 years, but more than
two-thirds of the participants were between 18 and 30
years old, 26.3 % were between 31 and 40 years old,
and only one person was over 40 years old.
Categorizing players and non-players results in a
distribution of 57.9 % players and 42.1 % non-
players.
6.2.2 Prediction Quality
The comparison in the number of correctly predicted
preferences per participant (before they used the app),
which is illustrated in Figure 2, shows that MoMo
performs best with a mean of 17.11 correct element
Player-Type-based Personalization of Gamification in Fitness Apps
365
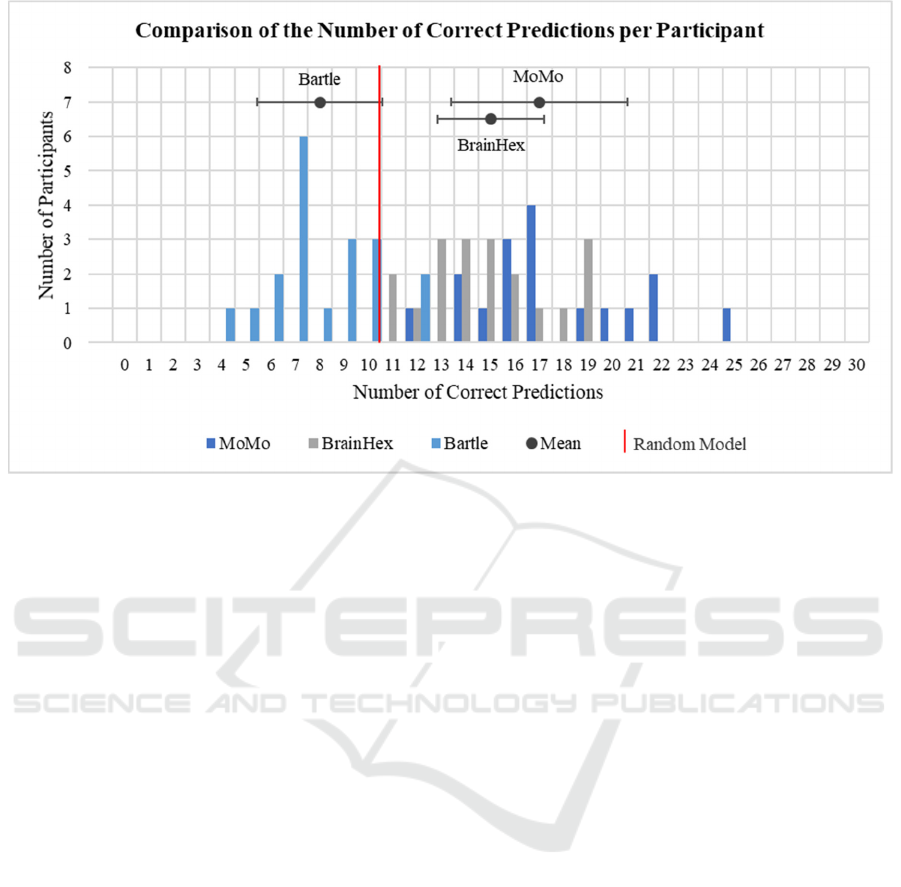
Figure 2: Comparison of the number of correct predictions per participant in questionnaire 1 of study 2 and mean for each
model with standard deviation.
predictions per participant, followed by BrainHex
(14.95) and Bartle (8.00). A t-test shows, that the
differences between all models are significant. The
mean value of MoMo and BrainHex is clearly above
the random model of 10 elements. In contrast, the
mean value of Bartle is significantly below the
random model.
Furthermore, these tendencies are also shown by
the comparison of the preference predictions and the
real rating of the gamification elements: MoMo with
an average of 57 % correct predictions in
questionnaire 1 has the best results, followed by
BrainHex with 50 %, and Bartle with 27 %.
Considering the prediction quality for each of the 30
gamification elements separately, the MoMo is above
or equal to the random model (6 out of 19 correct
predictions per element) for all elements. For
BrainHex, the predictions of 27 elements are better or
equal to the random model, and for Bartle 12
elements.
These tendencies are continued in the results of
questionnaire 2, where the MoMo is the best
performing and Bartle the worst for all evaluations.
However, percentages of correct predictions rise
slightly for all models: MoMo 60 %, BrainHex 52 %,
and Bartle 29 %. The same applies to the comparison
of correct predictions per participant, where the mean
values of each model increase slightly: MoMo 18.00,
BrainHex 15.74, and Bartle 8.26.
6.2.3 Validation of the Predictions in Real
Apps
The validation of the preferences with the ratings in
the real apps (after using the app) shows a different
result from the theoretical prediction quality (before
using the app). Nevertheless, the distribution of the
three models remains the same: Out of 43 elements
that were used in the real apps, the MoMo is the
strongest with 32 elements predicted correctly,
followed by BrainHex with 28 elements, and Bartle
with 19 elements. Note that the random model would
predict 2 elements correctly on average. The MoMo
can thus correctly predict 33 % of the preferences,
BrainHex 29 %, and Bartle 19 %. Since the random
model achieves 27 %, both MoMo and BrainHex are
slightly better than the random model.
7 DISCUSSION OF THE
RESULTS
The results of the user research (study 1) show that all
models are suitable to predict preferences for at least
some elements. However, the comparison of the
different models shows that there are considerable
differences in the quality and number of the
predictions. Of the four categorization models,
BrainHex scores best. Furthermore, the results for the
creation of the motivational value model (MoMo)
HEALTHINF 2021 - 14th International Conference on Health Informatics
366

show that by combining all four categorization
models, it is possible to create an even better model
for predicting preferences.
The quality evaluation of the predictions (study 2)
shows, that the users’ theoretical ratings of
gamification elements can be predicted well since
both, MoMo (57% correct predictions) and BrainHex
(50% correct predictions) perform better than the
random model, whereas Bartle (27% correct
predictions) scores worse.
Nevertheless, the comparison of the results of
questionnaire 1 and 2 shows variances in the
distribution of correct predictions per element, which
can be attributed to the varying ratings of the
gamification elements by the participants in
questionnaire 1 and 2: only 65 % of the elements in
questionnaire 1 and 2 were rated the same. In contrast,
the predictions differ less: 12 % of the predictions in
MoMo differ, 13 % in BrainHex, and 7 % in Bartle.
This suggests that answering the questionnaires of the
models is relatively stable, but a theoretical rating of
the gamification elements is difficult for the
participants. However, it is also possible that the
ratings may have changed due to experiences in the
apps. For this reason, it would be reasonable to test
whether the ratings stabilize over time in a long-term
study.
In contrast, the validation of the ratings of the
elements in the real apps (after having used the app)
shows a lower prediction quality compared to the
theoretical ratings (before using the app), while the
distribution of the models remains the same: The
MoMo (33 % correct predictions) is the strongest
followed by BrainHex (29 % correct predictions), and
Bartle (19 % correct predictions). The strong decrease
of percentages is based on the equally strong variation
in the ratings of the elements in theory and the real
apps: only 32 % of the ratings match between before
and after use of the apps. This may be due to two
reasons: First, as mentioned above, the theoretical
rating of the gamification elements may be difficult
for the participant, and therefore the data from the
regression analysis, which is based on the theoretical
data, may not match the real ratings. Second, it may
be caused by the implementation of the gamification
elements in the apps since a bad implementation is
rated worse than a good one, which may lead to
differences. This was partially confirmed by the
interviews in which it was apparent for some
elements that they would be motivating in principle
but did not influence the participants in the actual test
phase. For example, the element “Challenge” was
rated theoretically as motivating. However, since
there were no suitable challenges, it was rated rather
neutral after having used the real app. Furthermore,
the validation performed in this study, as well as the
data collection, was based on solely subjective ratings
and did not measure the objective increase or
decrease in motivation through certain gamification
elements.
Moreover, with 19 participants in the second
study, quantitative validation of the data was not
possible, which is why the validation should be
repeated by a study with a significantly larger sample
size. In addition, other quality features of the
predictions should be considered, since it cannot be
ensured that the ratings were normally distributed and
thus the 1/3 random model may not be applicable for
every element.
8 CONCLUSIONS
The results of this study indicate that gamification
preferences can be predicted using the Bartle, Big
Five, Hexad, and BrainHex categorization models. In
comparison, BrainHex scores best and Bartle scores
worst. The results also show that by combining the
four categorization models, a model (MoMo) could
be developed that can predict preferences even better
than the four individual categorization models. In the
validation, it becomes clear that the prediction of the
models for the theoretical rating of gamification
elements is significantly higher than the random
model for both BrainHex and MoMo. The prediction
of the motivational value after having experienced a
real app is much more difficult. Reasons for the rather
poor predictability of the preferences in the real apps
may be the concrete implementation of the elements
or the fact that the elements are difficult to rate
without having experienced them in a real app.
REFERENCES
Arango-López, J., Ruiz, S., Taborda, J. P., Vela, F. L. G.,
& Collazos, C. A. (2017). Gamification Patterns: A
Catalog to Enhance the Learning Motivation. In Actas
del V Congreso Internacional de Videojuegos y
Educación (CIVE'17).
Bartle, R. (1996). Hearts, Clubs, Diamonds, Spades:
Players Who Suit MUDs.
Chou, Y.‑K. (2016). Actionable gamification: Beyond
points, badges, and leaderboards. Octalysis Media.
Deterding, S., Dixon, D., Khaled, R., & Nacke, L. (2011).
From game design elements to gamefulness. In A.
Lugmayr, H. Franssila, C. Safran, & I. Hammouda
(Eds.), Proceedings of the 15th International Academic
Player-Type-based Personalization of Gamification in Fitness Apps
367

MindTrek Conference on Envisioning Future Media
Environments - MindTrek '11 (p. 9). ACM Press.
Ferro, L. S. (2018). An analysis of players’ personality type
and preferences for game elements and mechanics.
Entertainment Computing, 27, 73–81.
González Mariño, J. C., Cantú Gallegos, M. d. L., Camacho
Cruz, H. E., & osales Camacho, J. A. (2018).
Redesigning the Bartle Test of Gamer psychology for
its application in gamification processes of learning. In
N. C. Callaos (Ed.), The 12th International Multi-
Conference on Society, Cybernetics and Informatics:
July 8-11, 2018, Orlando, Florida, USA: Proc. (pp. 35–
40). IIIS.
Hallifax, S., Serna, A., Marty, J.‑C., Lavoué, G., & Lavoué,
E. (2019). Factors to Consider for Tailored
Gamification. In J. Arnedo, L. E. Nacke, V. Vanden
Abeele, & Z. O. Toups (Eds.), Proc. of the Annual
Symposium on Computer-Human Interaction in Play
(pp. 559–572). ACM.
International Hobo Ltd. (2011). Subclass Popularity.
https://blog.brainhex.com/
International Hobo Ltd. (2019). Welcome to the BrainHex
questionnaire! www.survey.ihobo.com/BrainHex/
Kocadere, S. A., & Çağlar, Ş. (2018). Gamification from
Player Type Perspective: A Case Study. In Educational
Technology & Society (pp. 12–22).
Marczewski, A. (2016). Even Ninja Monkeys like to play:
Gamification, Game Thinking and Motivational Design.
Mora, A., Tondello, G. F., Calvet, L., González, C.,
Arnedo-Moreno, J., & Nacke, L. E. (2019). The quest
for a better tailoring of gameful design. In Unknown
(Ed.), Proc. of the XX International Conference on
Human Computer Interaction - Interacción '19 (pp. 1–
8). ACM Press.
Nacke, L. E., Bateman, C., & Mandryk, R. L. (2011).
BrainHex: Preliminary Results from a Neurobiological
Gamer Typology Survey. In D. Hutchison, et al. (Eds.),
Lecture Notes in Computer Science. Entertainment
Computing – ICEC 2011 (Vol. 6972, pp. 288–293).
Springer Berlin Heidelberg.
Raftopoulos, M., Walz, S., & Greuter, S. (2015). How
enterprises play: Towards a taxonomy for enterprise
gamification. In Digital Games Research Association
DiGRA (Ed.), Proceedings of DiGRA 2015: Diversity
of play: Games – Cultures – Identities.
Rammstedt, B., Kemper, C. J., Klein, M. C., Beierlein, C.,
& Kovaleva, A. (2013). Eine kurze Skala zur Messung
der fünf Dimensionen der Persönlichkeit: 10 Item Big
Five Inventory (BFI-10). In Mannheim : GESIS (Ed.),
methoden, daten, analysen (7(2), pp. 233–249).
Reh@pp-Quality (Ed.). (2016). CHECK-Liste.
www.rehatechnologie.fk13.tu-dortmund.de/rehapp
Suryapranata, L. K. P., Kusuma, G. P., Heryadi, Y., &
Abbas, B. S. (2020). Adaptive Gamification
Framework With Proper Player Type Classification
And Effectiveness Evaluation. In ICIC International
(Ed.), ICIC ExpressLetters (Vol. 1, pp. 9–14).
Swacha, J., & Muszyńska, K. (2016). Design patterns for
gamification of work. In F. J. García-Peñalvo (Ed.),
Proceedings of the Fourth International Conference on
Technological Ecosystems for Enhancing
Multiculturality - TEEM '16 (pp. 763–769). ACM Press.
Tondello, G. F., Wehbe, R. R., Diamond, L., Busch, M.,
Marczewski, A., & Nacke, L. E. (2016). The
Gamification User Types Hexad Scale. In A. Cox, Z. O.
Toups, R. L. Mandryk, P. Cairns, V. Vanden Abeele, &
D. Johnson (Eds.), Proceedings of the 2016 Annual
Symposium on Computer-Human Interaction in Play -
CHI PLAY '16 (pp. 229–243). ACM Press.
Werbach, K. (2014). (Re)Defining Gamification: A Process
Approach. In D. Hutchison, T. Kanade, J. Kittler, J. M.
Kleinberg, A. Kobsa, F. Mattern, J. C. Mitchell, M.
Naor, O. Nierstrasz, C. Pandu Rangan, B. Steffen, D.
Terzopoulos, D. Tygar, G. Weikum, A. Spagnolli, L.
Chittaro, & L. Gamberini (Eds.), Lecture Notes in
Computer Science / Information Systems and
Applications, Incl. Internet/Web, and HCI: Vol. 8462.
Persuasive Technology - Persuasive (Vol. 8462, pp.
266–272). Springer.
HEALTHINF 2021 - 14th International Conference on Health Informatics
368
