
Enhancing Phase Mapping for High-throughput X-ray Diffraction
Experiments using Fuzzy Clustering
Dipendra Jha
1,∗
, K. V. L. V. Narayanachari
2,∗
, Ruifeng Zhang
2
, Denis T. Keane
3
, Wei-keng Liao
1
,
Alok Choudhary
1
, Yip-Wah Chung
2
, Michael J. Bedzyk
2
and Ankit Agrawal
1
1
Department of Electrical and Computer Engineering, Northwestern University, Evanston, IL, U.S.A.
2
Department of Materials Science and Engineering, Northwestern University, Evanston, IL, U.S.A.
3
DND-CAT Synchrotron Research Center, Northwestern University, Evanston, IL, U.S.A.
dtkeane@northwestern.edu, wkliao@eecs.northwestern.edu, choudhar@eecs.northwestern.edu,
ywchung@northwestern.edu, bedzyk@northwestern.edu, ankitag@eecs.northwestern.edu
Keywords:
X-ray Diffraction, Phase Clustering, Unsupervised Learning, Fuzzy C-means Clustering, Hierarchical
Clustering, Composition-phase Diagram, Fuzzy Representation.
Abstract:
X-ray diffraction (XRD) is a widely used experiment in materials science to understand the composition-
structure-property relationships of materials for designing and discovering new materials. A key aspect of
XRD analysis is that the composition-phase diagram is composed of not only pure phases but also their mixed
phases. Hard clustering approach treats the mixed phases as separate independent clusters from their con-
stituent pure phases, hence, resulting in incorrect phase diagrams which complicate the next steps. Here,
we present a novel clustering approach of XRD patterns by leveraging a fuzzy clustering technique that can
significantly enhance the potential phase mapping and reduce the manual efforts involved in XRD analysis.
The proposed approach first generates an initial composition-phase diagram and initial pure phase represen-
tations by applying the fuzzy c-means clustering algorithm, followed by hierarchical clustering to accomplish
effortless manual merging of similar initial pure phases to generate the final composition-phase diagram. The
proposed method is evaluated on the XRD samples from two high-throughput composition-spread experiments
of Co-Ni-Ta and Co-Ti-Ta ternary alloy systems. Our results demonstrate significant improvement compared
to hard clustering and almost completely eliminate manual efforts.
1 INTRODUCTION
High-throughput X-ray diffraction (XRD) experi-
ments are a well-known technique used by materi-
als scientists for characterizing the materials structure
for understanding the composition-structure-property
relationships of materials. The analysis of XRD
patterns from high throughput experiments provides
atomic-scale crystal structure details that are not only
be used to predict the properties of materials (Woolf-
son and Woolfson, 1997; Klug and Alexander, 1974;
Moore and Reynolds, 1989; Bish and Post, 1989; Cul-
lity, 1978) , but are also used to determine the pos-
sible flaws in a material sample for novel materials
design (Chung and Ice, 1999). High-throughput mea-
surements combined with machine learning can im-
prove the design process of the Co-super alloys.
∗
Equal Contribution.
indent Traditionally, domain experts analyze XRD
samples by examining their peak characteristics such
as the peak position, intensity and peak width, us-
ing their domain knowledge and comparison against
existing reference databases of composition-phase
maps. Since the current high-throughput XRD experi-
ment produces thousands of samples at once, the man-
ual attribution of phases for each sample has become
a formidable task. Recently, domain scientists have
started leveraging standard clustering algorithms to
reduce the sample space for manual labeling and vali-
dation, and obtain the potential composition-phase di-
agram from a composition-spread experiment (Tatlier,
2011; Gilmore et al., 2004; Bunn et al., 2016). Such
clustering techniques groups together XRD samples
with similar peak characteristics, reducing the manual
task of phase labeling from all samples to a small sub-
set of samples in each group (phase region) (Hattrick-
Simpers et al., 2016; Iwasaki et al., 2017). Once a
Jha, D., Narayanachari, K., Zhang, R., Keane, D., Liao, W., Choudhary, A., Chung, Y., Bedzyk, M. and Agrawal, A.
Enhancing Phase Mapping for High-throughput X-ray Diffraction Experiments using Fuzzy Clustering.
DOI: 10.5220/0010229905070514
In Proceedings of the 10th International Conference on Pattern Recognition Applications and Methods (ICPRAM 2021), pages 507-514
ISBN: 978-989-758-486-2
Copyright
c
2021 by SCITEPRESS – Science and Technology Publications, Lda. All rights reserved
507

small set of samples in each phase region is labeled,
a supervised technique can be used to label the rest
of the samples (Bunn et al., 2016). Recently, Park et
al. (Park et al., 2017) used a CNN to classify the com-
puted XRD patterns from ICSD (Bergerhoff et al.,
1983) since it is impossible to get a large collection
of labeled experimental samples (Park et al., 2017).
Jha et al. (Jha et al., 2019) designed a peak area de-
tection network for classification of phases from 2D
warped XRD patterns using an experimental dataset
containing 177 samples. The application of super-
vised learning for the analysis of XRD samples from
experiments has been limited because it is impossible
to obtain a large sample of experimental XRD sam-
ples with their phase labels. The primary focus of our
work is to leverage machine learning techniques to
help reduce the effort required by domain experts for
XRD analysis and phase indexing.
A key aspect of XRD analysis is that composition-
phase diagrams are composed of not only pure phases
but also contain their mixed phases. A pure phase
represents a single crystal structure for a given mate-
rials composition. A mixed phase represents a com-
bination of multiple pure phases and hence, mix-
ture of more than one crystal structure for the given
material composition. A composition-phase dia-
gram represents the phase (crystal structure) at dif-
ferent compositions for a given material alloy system.
Composition-phase diagrams are generally composed
of multiple pure phases, and their mixed phases.
The current practice of using clustering techniques is
based on hard clustering which assigns each sample
to a single cluster (phase). A key issue with the cur-
rent practice of directly applying hard clustering tech-
niques on the 1D XRD patterns by domain scientists
for phase clustering is that although a mixed phase is
a composition of multiple pure phases, they treat them
as separate cluster, independent of the pure phase
clusters. Such treatment of pure phase and mixed
phase as separate clusters leads to incorrect potential
phase maps which complicates further manual analy-
sis required during phase indexing. Here, our goal is
to provide a method for phase clustering of XRD sam-
ples that can automatically handle the mixed phases
by allowing multiple membership for those samples
to their respective constituent pure phases.
In this paper, we present a novel clustering ap-
proach for high-throughput XRD experiments by
leveraging a fuzzy clustering technique which can
automatically handle the mixed phases by allowing
multiple pure phase membership, and hence, signifi-
cantly enhance the quality of potential composition-
phase diagrams and reduce the manual efforts in-
volved in next steps of phase labeling and valida-
tion. First, we apply a fuzzy c-means clustering al-
gorithm to generate the initial composition-phase di-
agram and initial pure phase representations. Note
that there exists several approaches for soft cluster-
ing (Baraldi and Blonda, 1999; Peters et al., 2013),
here, we chose the prominent fuzzy c-means clus-
tering algorithm for better interpretation and suit-
ability to our clustering task. Next, the initial pure
phase representations are analyzed using hierarchi-
cal clustering to find their similarity in peak char-
acteristics by leveraging domain knowledge, and
the similar initial pure phases are combined to ob-
tain the final composition-phase diagram for the
given composition-spread experiment. The proposed
method is evaluated on XRD samples from two high-
throughput XRD composition-spread experiments for
the ternary alloy systems of Co-Ni-Ta and Co-Ti-
Na (containing 1955 and 1533 samples respectively).
The composition-phase diagrams obtained using our
approach are in good agreement with manually com-
puted ground truth composition-phase diagrams for
the two ternary systems. Our results are verified by
domain scientists and demonstrates significant advan-
tage over current practice of hard clustering, drasti-
cally simplifying and reducing the manual efforts.
2 BACKGROUND
X-ray diffraction is an atomic scale probing technique
to determine the crystal structure of materials for un-
derstanding their composition-structure-property re-
lationships (Klug and Alexander, 1974; Moore and
Reynolds, 1989; Bish and Post, 1989; Cullity, 1978;
Woolfson and Woolfson, 1997). During an X-ray
diffraction experiment, the crystal structure in the ma-
terial causes the beam of incident X-rays to diffract
into many specific directions; a 3D image represent-
ing the density of electrons in the crystal can be con-
structed by measuring the angles and intensities of the
diffracted intensity patterns.
An X-ray pattern is basically a plot of the intensity
of X-rays scattered at different angles by a materials
sample, as measured by a 2D detector, with each pixel
measuring the number of incident X-ray photons.The
XRD pattern from a material composed of periodic
atomic structures is composed of multiple sharp spots
known as Bragg diffraction peaks; the positions and
intensities of these peaks determine the phase of the
materials - the specific chemistry and atomic arrange-
ment. For instance, quartz, cristobalite and glass are
all different phases of SiO
2
; they are chemically iden-
tical but the atoms are arranged differently, the XRD
pattern is distinct for each phase. A composition-
ICPRAM 2021 - 10th International Conference on Pattern Recognition Applications and Methods
508

phase map represents the physical conditions at which
thermodynamically distinct phases occur and coex-
ist. The constituent phases in the composition-phase
map represent the different crystal lattice structures
for varying material composition. The clustered data
is represented on a ternary composition-phase dia-
gram as a function of atomic fractions. The phase
clustering results can also be plotted for visualization
and further analysis using a circular plot which maps
the phase and the X-Y coordinates of the wafer used
during XRD experiment.
3 PROPOSED APPROACH
The proposed method for the phase mapping of high-
throughput XRD experiments consists of two main
steps. First, we leverage a fuzzy c-means clustering
technique on the XRD patterns to generate an ini-
tial potential composition-phase diagram and initial
pure phase representations. Next, we analyze these
pure phase representations using hierarchical cluster-
ing, and combine similar initial pure phases to obtain
the final composition-phase diagram.
The first step in the proposed approach for XRD
analysis is to perform an initial fuzzy phase cluster-
ing. There exist multiple soft clustering algorithms
for fuzzy clustering (Baraldi and Blonda, 1999; Pe-
ters et al., 2013), here chose the fuzzy c-means clus-
tering algorithm from Bezdek (Bezdek, 1981) for its
simplicity of application to our task and better inter-
pretation.
Let’s define the XRD dataset as
X = x
1
,x
2
,...,x
n
(1)
such that each sample is a vector of m intensity values
represented by:
x
i
= x
i1
,x
i2
,...,x
im
(2)
Fuzzy c-means (FCM) clustering algorithm cre-
ates c fuzzy partitions by optimizing the following
objective function:
J
m
(U, v) =
n
∑
k=1
c
∑
i=1
(µ
ik
)
m
0
(d
ik
)
2
(3)
where
d
ik
= d(x
k
− v
i
) =
m
∑
j=1
(x
k j
− v
i j
)
2
1/2
(4)
represents the distance between the i
th
cluster center
v
i
and the k
th
XRD sample using Euclidean distance,
µ
ik
is the membership of the k
th
sample in the i
th
clus-
ter such that
c
∑
i=1
µ
ik
= 1 for all k = 1,2,...,n (5)
where v
i
is the i
th
cluster center, which represents the
pure phase using a vector of m intensity values in the
form v
i
= v
i1
,v
i2
,...,v
im
computed as:
v
i j
=
∑
n
k=1
µ
m
0
ik
· x
k j
∑
n
k=1
µ
m
0
ik
(6)
where U is the partition matrix with c rows and n
columns formed by µ
ik
, represents the fuzzy member-
ship of an XRD sample to the c pure phase clusters, m
0
is the weighting parameter that controls the amount of
fuzziness in the phase clustering process.
The range for the membership exponent is
m
0
ε[1,∞). For the case of m
0
= 1, the distance norm
is the original distance metric used (Euclidean by de-
fault) and the algorithm approaches a hard c-means
algorithm, where each XRD sample would belong to
a single cluster. This objective function is optimized
to get the best solution within a pre-specified level of
accuracy ε using the iterative optimization.
The fuzziness in the clustering is measured by
computing the fuzzy partition coefficient (FPC) as
follows:
F
c
U =
tr(U ∗ U
T
)
n
(7)
where U is the fuzzy partition matrix representing
the membership of each data point to different clus-
ters, n is the number of samples in our dataset, and
the operation ∗ represents matrix multiplication. This
partition coefficient has some special properties. If
F
c
U = 1/c, it means the clustering is completely am-
biguous, while if F
c
U = 1, it means hard clustering,
i.e., each data sample belongs to a single cluster. Gen-
erally, the number of pure phases in a phase diagram
for a given composition space is not very large. A
high value of membership (ideally 1) represents the
sample having a pure phase, while a lower value of
membership represents a mixed phase. The cluster
centers from FCM provide the pure phase represen-
tation for each pure phase in the potential phase dia-
gram for the given composition space.
The initial composition-phase diagram from fuzzy
clustering can be composed of multiple overlapping
clusters due to the presence of multiple initial pure
phases with similar representations. Therefore, the
next step is to combine together similar initial pure
phases to obtain the final composition-phase diagram.
To accomplish the combination of similar initial pure
phases from fuzzy clustering step, we leverage hierar-
chical clustering with its corresponding dendogram to
visually analyze the initial pure phase representations
before combining them.
Enhancing Phase Mapping for High-throughput X-ray Diffraction Experiments using Fuzzy Clustering
509
4 EXPERIMENTAL RESULTS
We present the experimental results using the
proposed approach for phase mapping of high-
throughput XRD experiments in this section. First,
we discuss the XRD datasets used for evaluation.
Next, we present our experimental results, followed
by comparison against current practice of using hard
clustering algorithms of hierarchical clustering and k-
means clustering. All the experimental evaluations
are implemented using Python.
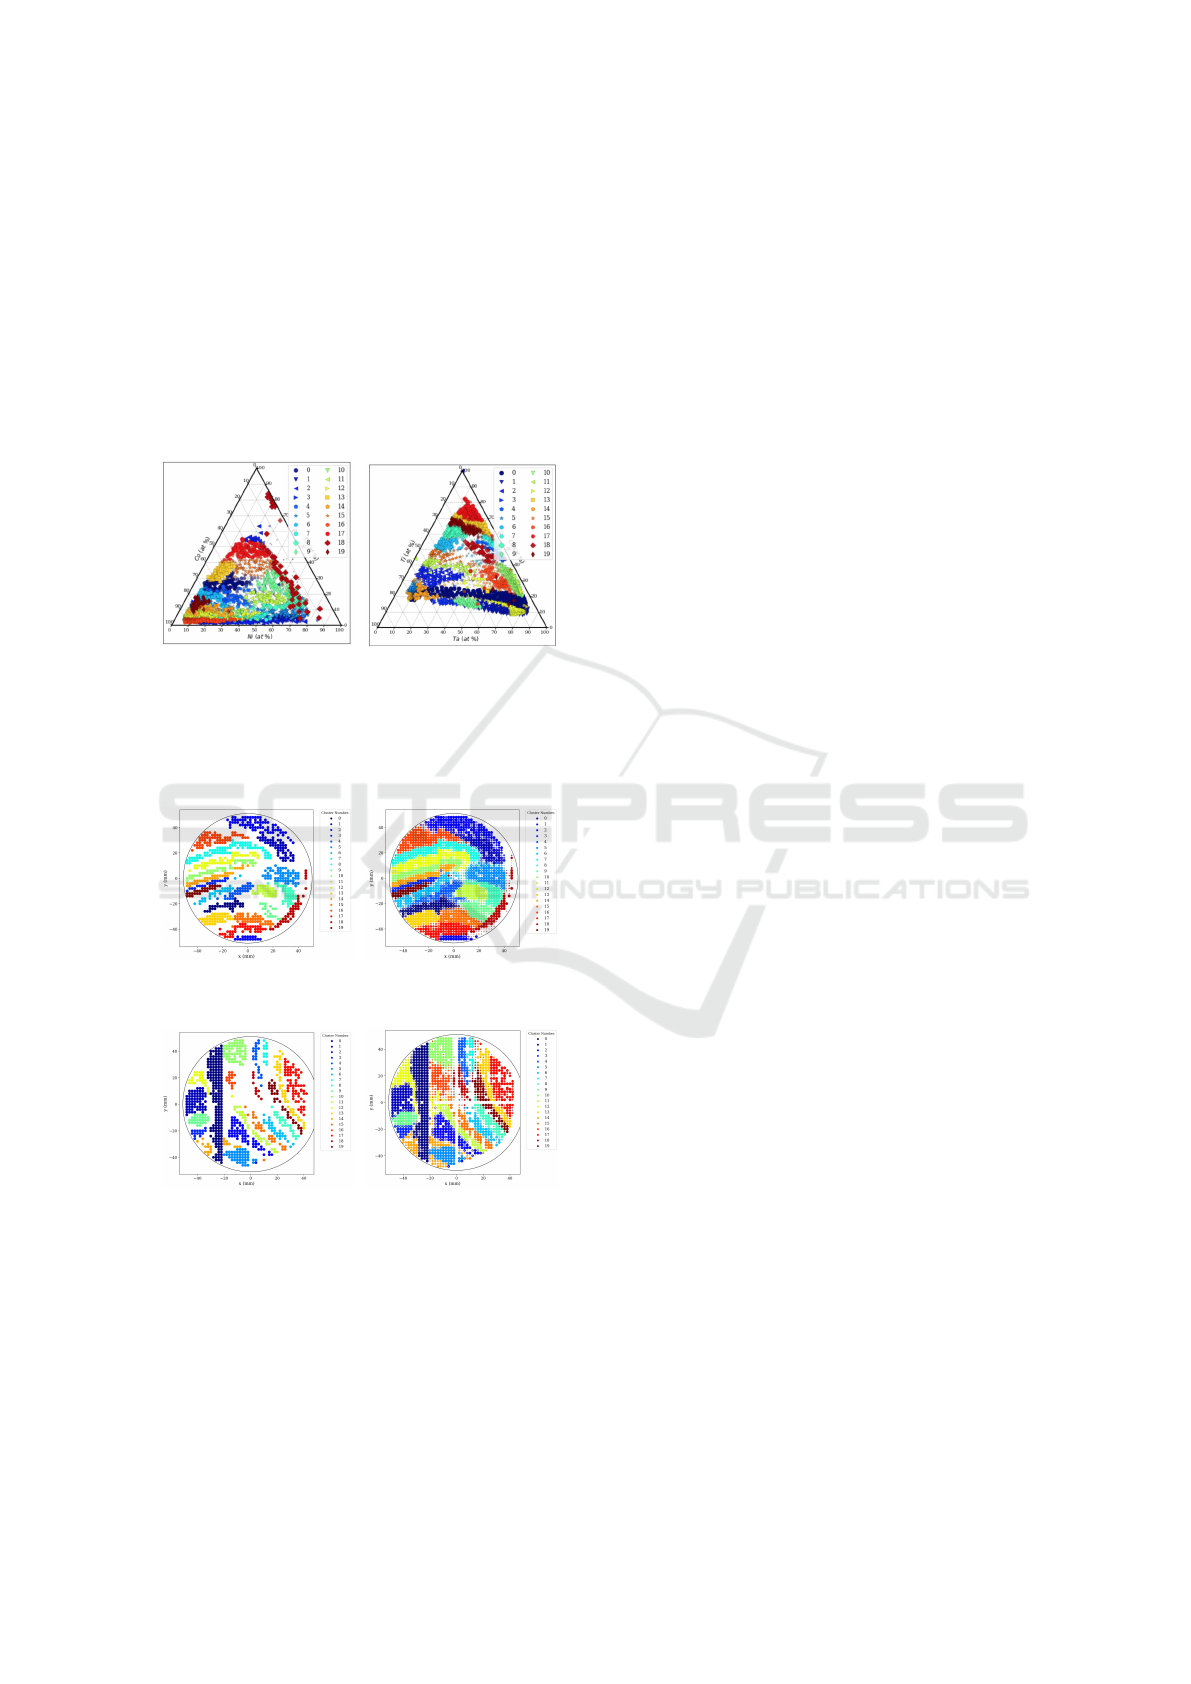
(a) Co-Ni-Ta (b) Co-Ti-Ta
Figure 1: Initial composition-phase diagram (phase cluster-
ing output) using FCM algorithm. These ternary plots show
both pure phases and mixed phases, the membership of a
sample to a cluster is represented using the opaqueness and
size of marker.
(a) Co-Ni-Ta (samples with
memb > .95)
(b) Co-Ni-Ta (all samples)
(c) Co-Ti-Ta (samples with
memb > .95)
(d) Co-Ti-Ta (all samples)
Figure 2: Circular plots representing the phase clustering
results using FCM algorithm. The left subplots only show
samples having membership > 0.95, which should repre-
sent the samples with pure phases, the right subplots also
include the ones with mixed phases. the membership of a
sample to a cluster is represented using the opaqueness and
size of marker. For samples with mixed phases, the marker
is more transparent with smaller size.
4.1 Datasets
The dataset used in this study is collected from
two high-throughput composition-spread using con-
current X-ray diffraction (XRD) and X-ray fluores-
cence (XRF) experiment for the composition space of
Cobalt, Nickel and Tantalum (Co-Ni-Ta) and the com-
position space of Cobalt, Titanium and Tantalum (Co-
Ti-Ta). The data acquisition experiments were carried
out using a customized setup at beam-line 5BMC of
Advanced Photon Source (APS) in Argonne National
Lab. The collected XRD data is used in this study
for phase mapping analysis. The XRF data is used
to calculate atomic ratios. The 2D XRD diffraction
patterns collected from the X-ray detector were con-
verted to 1D by circular averaging the counts to re-
duce the effect of texturing on the XRD data. The 1D
XRD data is further processed to account for the inci-
dent beam brightness change across the samples and
for the background removal using 2nd order polyno-
mial fit to the background. The angular position 2θ
of the diffracted X-ray peak is converted to Q-values.
The Q-values are independent of X-ray energy and di-
rectly related to the inverse d-spacing on the planes
diffracting the X-rays. The Co-Ni-Ta dataset con-
tains 1, 859 samples with intensities at 499 Q-values
in the range of [1.0, 4.2] from the high-throughput X-
ray diffraction experiment. The Co-Ti-Ta dataset con-
tain the values of intensities at 1, 450 Q-values in the
range of [1.0, 4.3] for 1,533 samples from the high-
throughput X-ray diffraction experiment. The dataset
also contains the composition of each sample along
with the X-Y position on the wafer used during exper-
imentation; the composition is used to plot the ternary
plot and the X-Y position is used for the circular plot
for XRD analysis.
4.2 Fuzzy Clustering
The first step in the proposed approach is to apply
the FCM algorithm to generate an initial composition-
phase diagram and initial pure phase representations.
For this, we leveraged the FCM algorithm implemen-
tation from SciKit-Fuzzy (Warner, ). It takes the
error (stopping criterion used to stop early if the norm
of change in membership is less than the provided
value), m (array exponentiation applied to the mem-
bership function at each iteration), maxiter (maxi-
mum number of iterations allowed), init (the initial-
ization for fuzzy c-partitioned matrix), along with the
data and desired number of clusters as inputs, and
returns the cluster centers, final fuzzy c-partitioned
matrix and FPC as the output. After experiment-
ing with different combinations of the input param-
ICPRAM 2021 - 10th International Conference on Pattern Recognition Applications and Methods
510
eters for both datasets, we present the best results ob-
tained using the following input parameters for both
datasets: 0.01 for error, 1.13 for m, euclidean as the
distance metric. For maxiter, we used 500 for Co-
Ni-Ta and 10,000 for Co-Ti-Ta, they worked best. We
experimented using number of clusters in the range
of [1,50) for the FCM algorithm. Since the expected
number of clusters is in the range of [10,20] for both
datasets, we select the clustering results with 20 clus-
ters for both datasets as fuzziness was highest for
this case, so that we do not miss any pure phases
which may lead to incorrect composition-phase dia-
gram. Next, we analyzed the membership of each
pure phase (cluster) by their sample count. Ideally,
a sample belonging to a pure phase should have a per-
fect membership value of 1 to that pure phase (clus-
ter). In practice, we looked at the sample counts with
membership value >0.9 for each pure phase; the min-
imum sample count for each cluster was 20.
There exists two approaches for visualizing the
clustering results of samples from a high-throughput
XRD experiment- ternary plot and circular plot. A
ternary composition-phase diagram represents the
phase for each sample with respect to its material
composition as shown in Figure 1. From Figure 1,
we observe that most clusters are well-separated from
each other, which represents clear phase regions. The
distinct phase regions (clusters) in the ternary plot
represent distinct pure phases where each pure phase
represents a particular arrangement of atoms, result-
ing in a particular crystal structure for the material
compositions in that phase region. The size and
opaqueness of markers used for plotting represents
the membership to a particular phase; smaller mark-
ers representing samples having multiple member-
ship (fuzzy membership), hence, mixed phase regions
(which can not be handled by the hard clustering al-
gorithms used in current practice of phase clustering).
Since a mixed phase is a combination of multiple pure
phases, the composition region representing mixed
phases in the ternary plot have multiple types of crys-
tal structures for the given material composition. A
circular plot maps the phase clustering output with
the X-Y coordinates of the wafer used during XRD
experiment. Left subplots of Figure 2 only shows the
samples with pure phases while the right subplots in-
clude samples having mixed phase as well. Compar-
ing between the left and right subplots, we can ob-
serve that the mixed phase region (empty in the left
subplots) generally lies between its constituent pure
phases. The marker size and opaqueness having sim-
ilar representation as before; smaller dots represent
the samples with mixed phases (having membership
to multiple pure phases). A mixed phase can be a
combination of any number of constituent pure phases
present in the phase diagram. Since there are 20 initial
pure phases, there exist several mixed phases in the
composition phase diagram, having varying degree of
membership to their constituent pure phases.
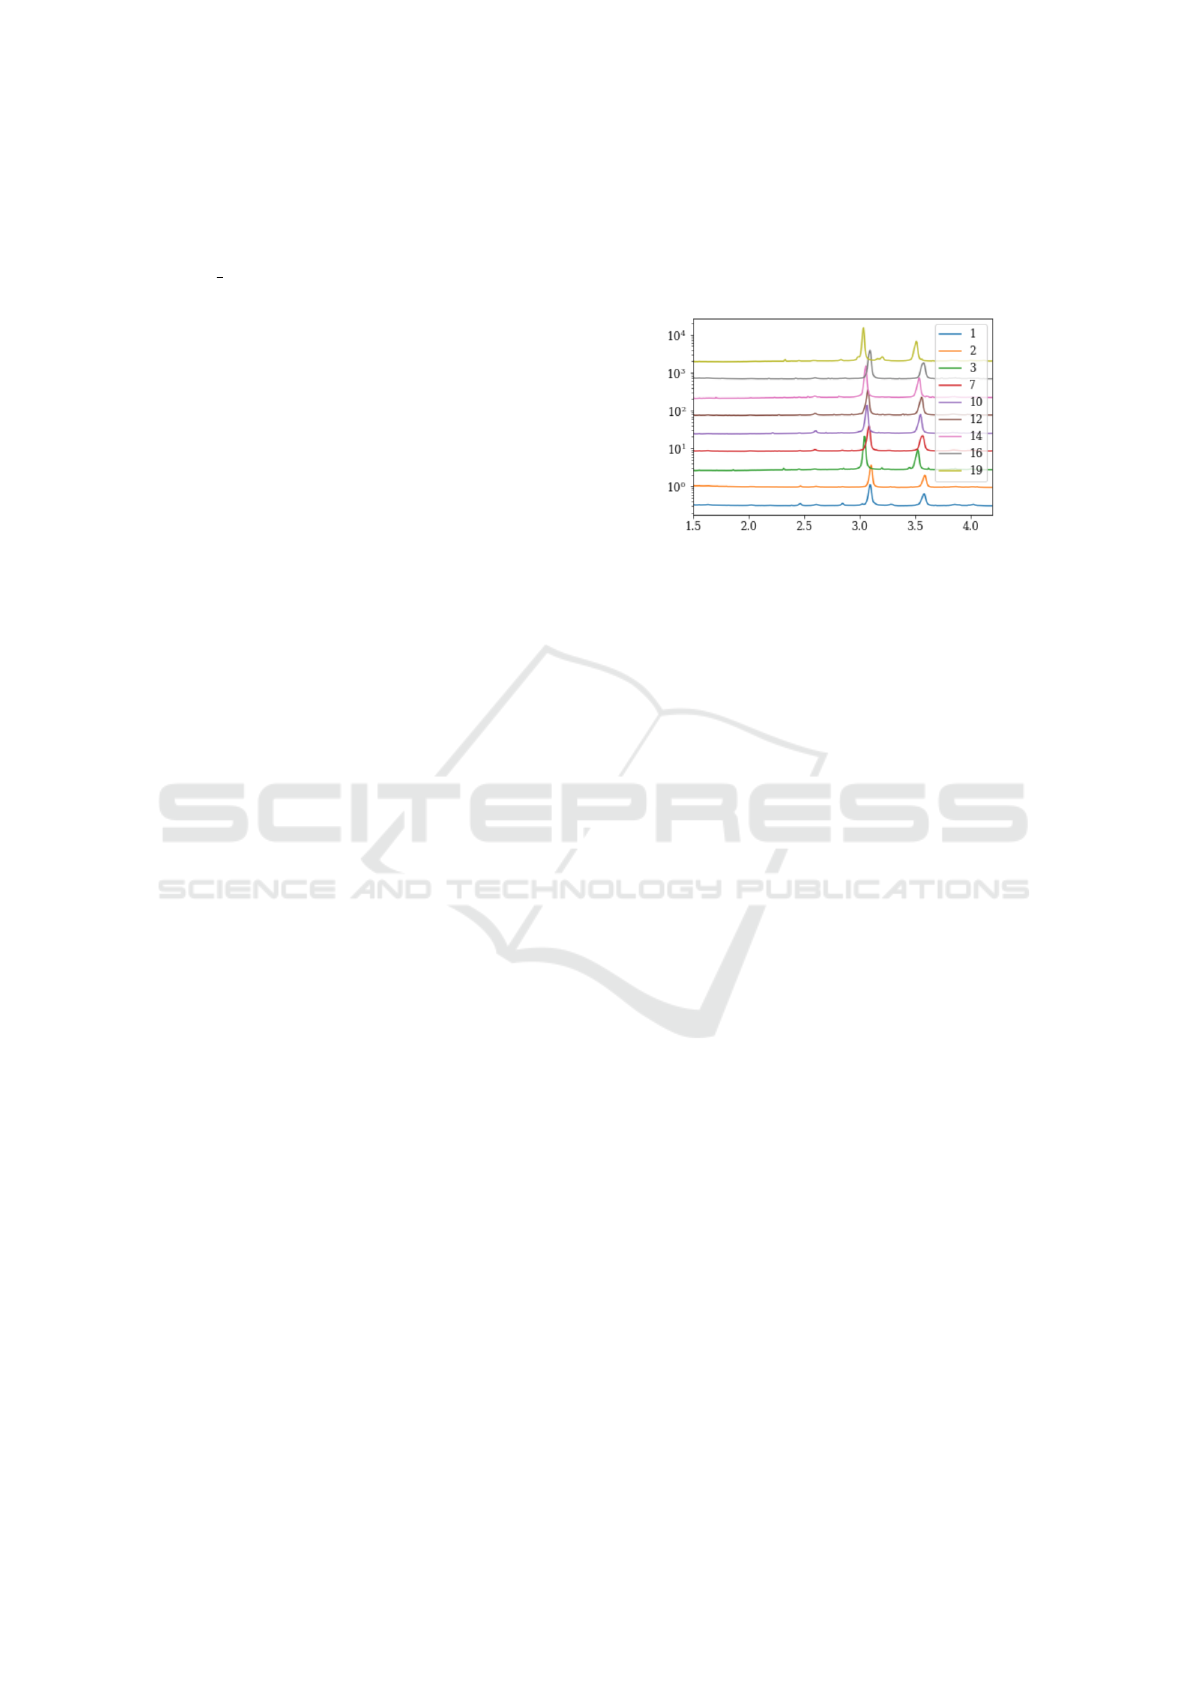
Figure 3: A candidate set of similar initial pure phases from
applying FCM algorithm on the Co-Ni-Ta dataset that can
be merged together to obtain the final composition-phase
diagram.
4.3 Merging Procedure
After analyzing the initial pure phase representations,
we observe that there are multiple sets of similar ini-
tial pure phases which should belong together. Fig-
ure 3 demonstrates one such candidate set contain-
ing nine initial pure phases similar to each other; they
have similar representations, suggesting that they be-
long to same phase and have same underlying crys-
tal structure. For the merging procedure, first we ob-
tain the dendogram by applying hierarchical cluster-
ing on the initial pure phase representations. Next,
we visualized and analyzed each set of similar initial
pure phases to decide which ones to combine, such
as the set of initial pure phases for Co-Ni-Ta shown
in Figure 3. We finally merged together sets of initial
pure phase representations to obtain the pure phases
in the final composition-phase diagrams as illustrated
in Figure 4. There are 9 final pure phases for both
composition spaces in our study; they have obvious
difference in their peak characteristics which repre-
sents different underlying crystal structures for their
corresponding samples. We updated the membership
for each sample to obtain the final composition-phase
maps shown in Figure 5. Comparison between the
shape and location of phase regions in the composi-
tion phase diagrams using the proposed method and
the manually computed phase diagrams by domain
experts in our team shows that they are in good agree-
ment with each other and concur with the expectations
of domain scientists.
Enhancing Phase Mapping for High-throughput X-ray Diffraction Experiments using Fuzzy Clustering
511
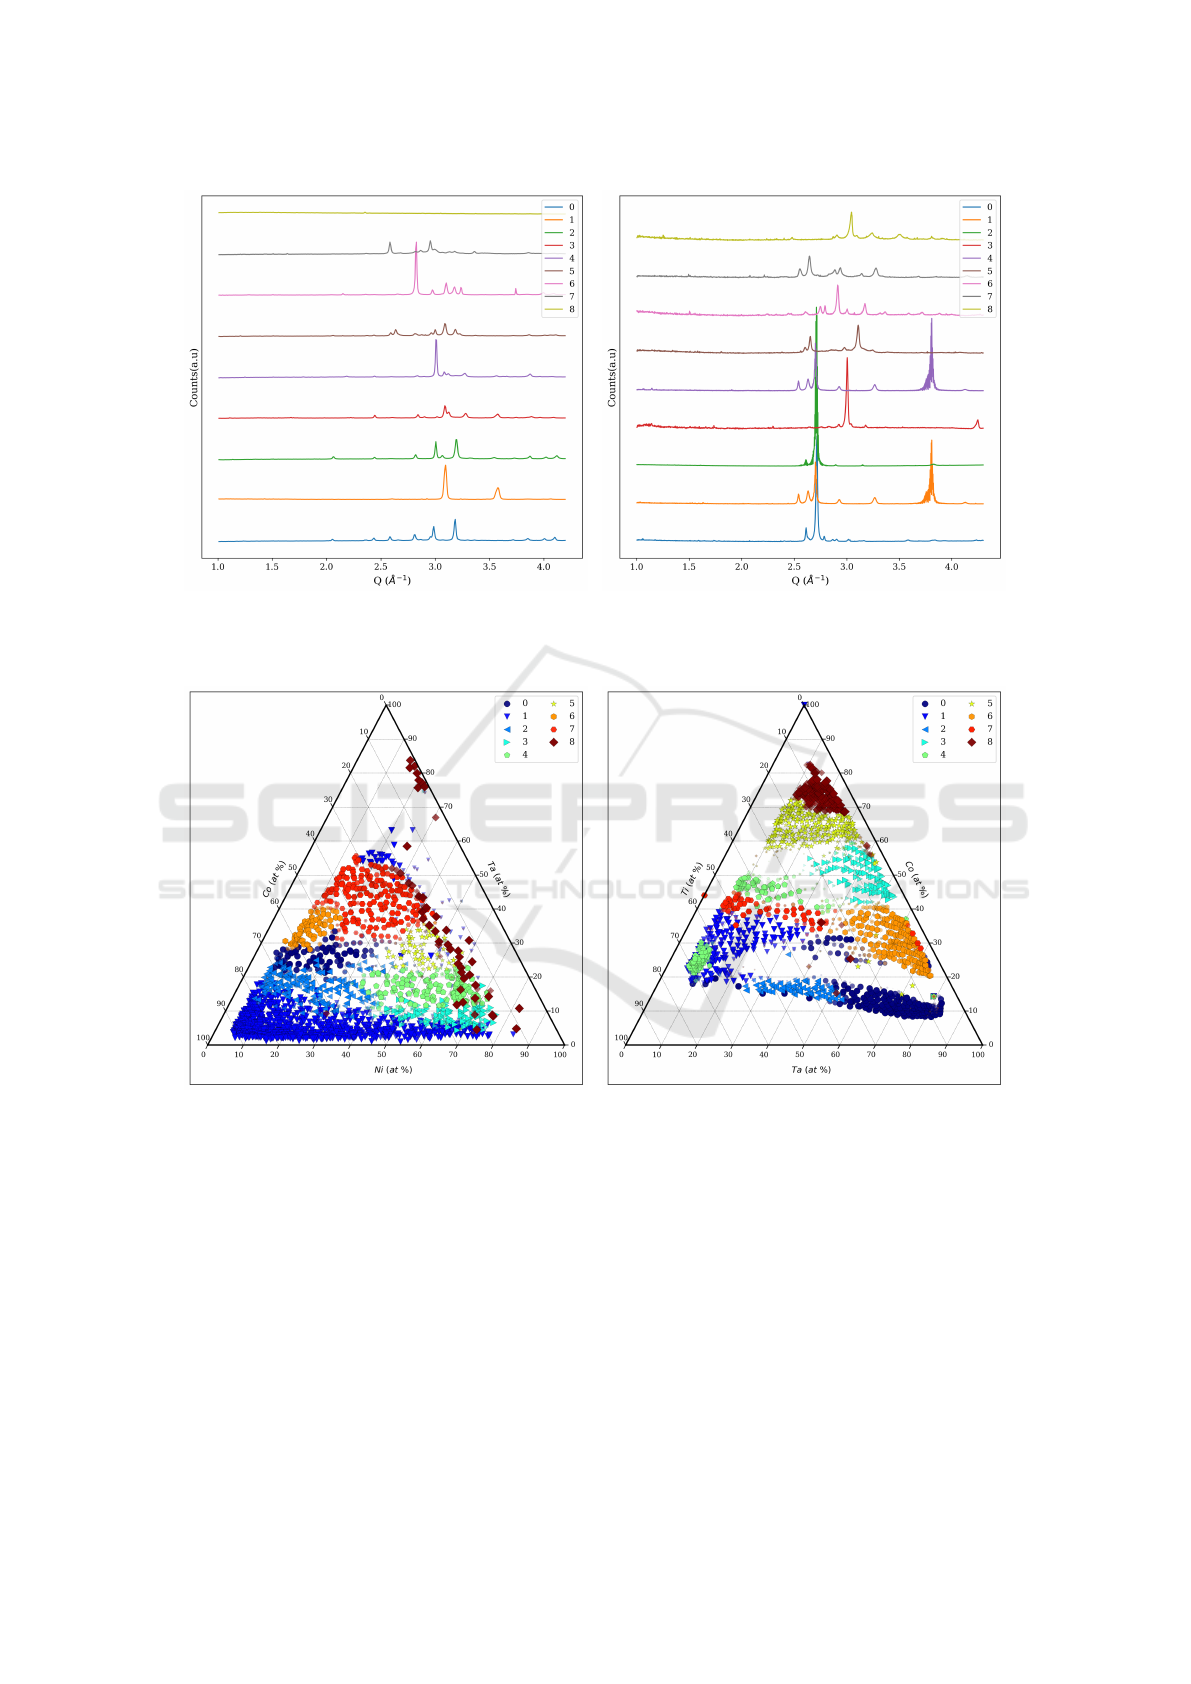
(a) Co-Ni-Ta (b) Co-Ti-Ta
Figure 4: Final pure phase representations after merging similar initial pure phases. The final pure phase representations are
significantly different from each other which illustrates the efficiency of the proposed approach.
(a) Co-Ni-Ta (b) Co-Ti-Ta
Figure 5: Final composition-phase diagram using proposed approach. There are 9 final pure phases for both ternary systems.
4.4 Comparison against Current
Approaches of Hard Clustering
Next, we compared the proposed approach against
the current practice of directly using hard cluster-
ing algorithms on the 1D XRD patterns (Bunn et al.,
2016; Hattrick-Simpers et al., 2016; Iwasaki et al.,
2017); these include hierarchical clustering and k-
means clustering. For hierarchical clustering, we ex-
perimented with all the available distance metrics in
SciPy (Jones et al., 01 ) such as cosine, correlation,
braycurtis, mahalanobis and euclidean. For k-means
clustering, we experimented with values of k in the
range of [5,20].
Figure 6 demonstrates one of the best phase clus-
tering results using hierarchical clustering on the two
datasets. There are a large number of clusters in both
cases- 64 clusters for Co-Ni-Ta and 91 clusters for
Co-Ti-Ta. Note that we experimented using all the
exhausting list of values for different metrics and pa-
rameters for hierarchical clustering, and Figure 6 rep-
resents one of the best results. From the composition-
phase diagrams, we observe that there are large clus-
ICPRAM 2021 - 10th International Conference on Pattern Recognition Applications and Methods
512
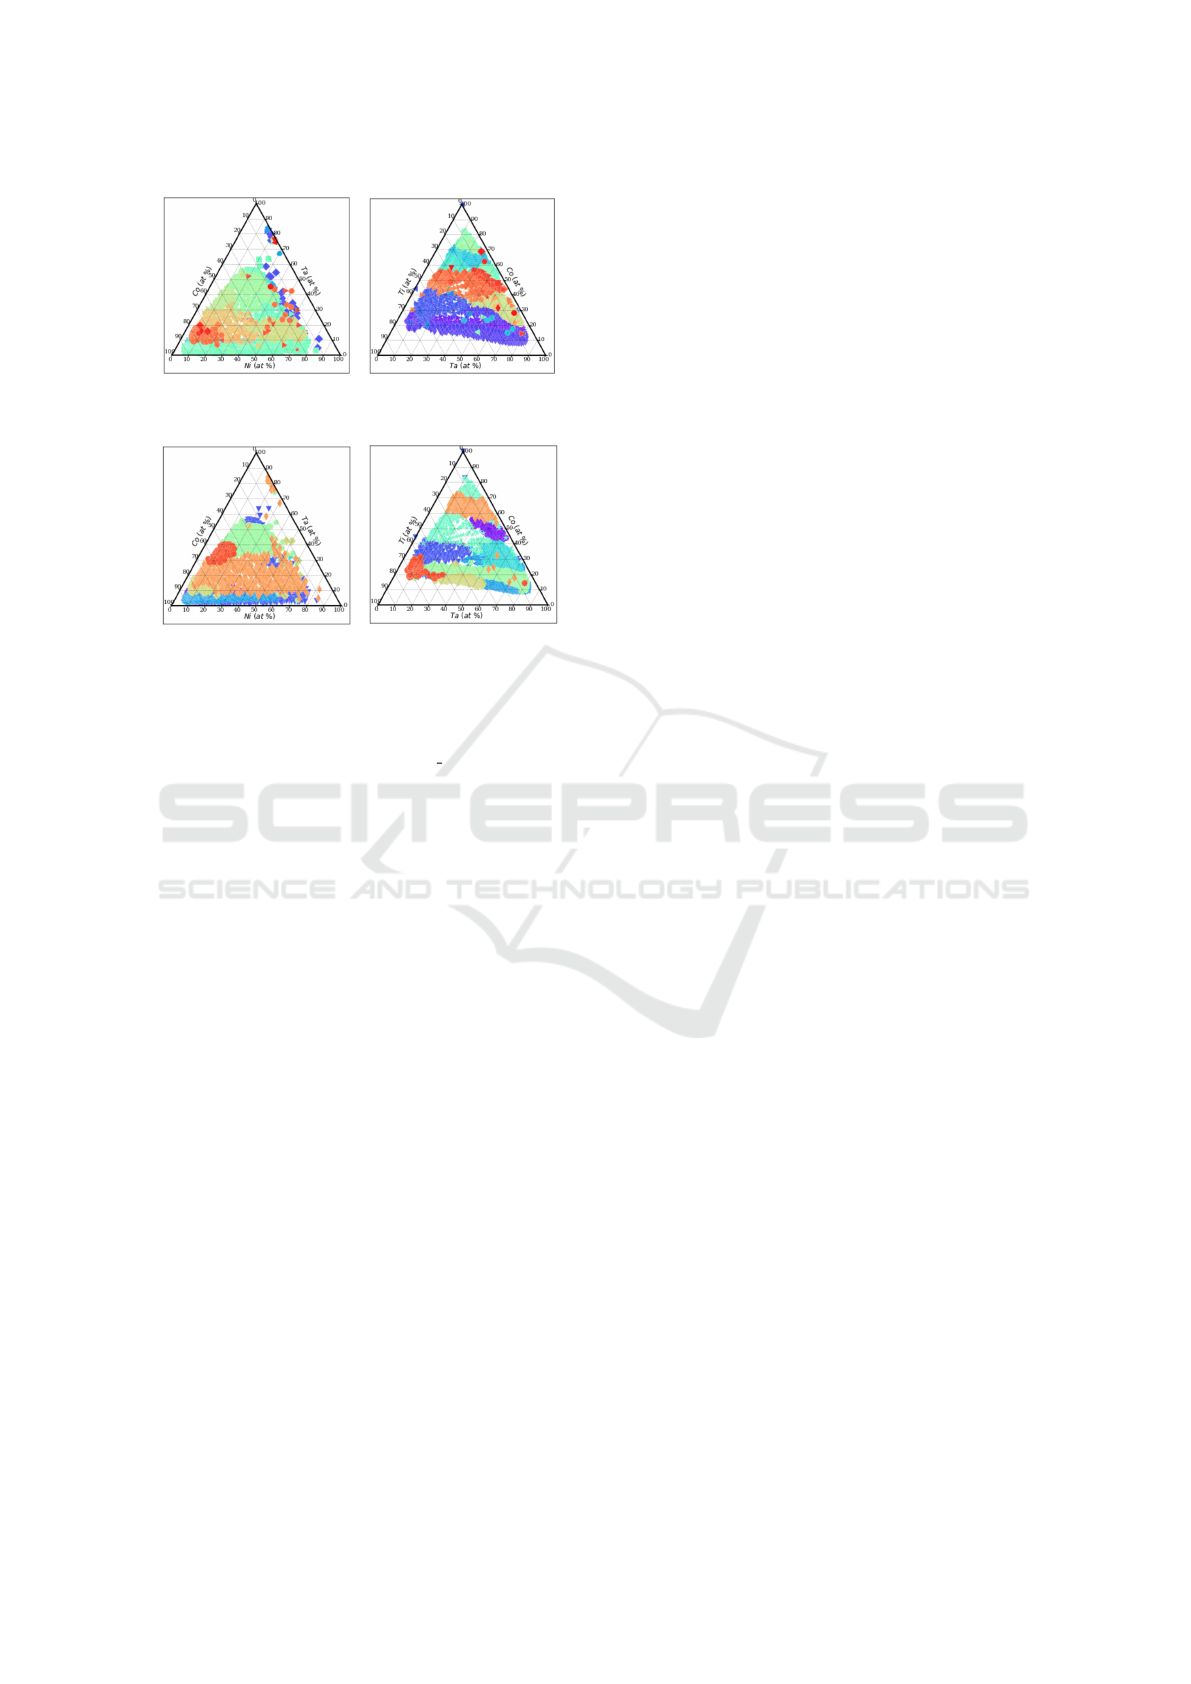
(a) Co-Ni-Ta, Hierarchical
Clustering
(b) Co-Ti-Ta, Hierarchical
Clustering
(c) Co-Ni-Ta, K-means
clustering
(d) Co-Ti-Ta, K-means
clustering
Figure 6: Composition-phase diagrams using current prac-
tice of directly applying hierarchical clustering and k-means
clustering. For hierarchical clustering, correlation is used as
the distance metric in both case, the hc param is 0.48828
for both cases; there are 64 clusters for Co-Ni-Ta and 91
clusters for Co-Ti-Ta. For k-means clustering, we present
clustering results from k = 9 here, since there are 9 phases
in the final phase diagram expected by domain experts.
ter regions, but the boundary between different phase
regions is not clear in either case. We observe more
clear clusters in the case of k-means clustering as
shown in Figure 6, but they do no agree with the ex-
pectation of domain experts. If we compare the re-
sults of k-means against hierarchical clustering, we
can clearly observe that composition phase diagram
from hierarchical clustering is closer to the domain
expectation. If we compare these hard clusters against
the results using phase clustering results obtained us-
ing the proposed technique, we find that multiple pure
phases from the proposed technique are clustered to-
gether in the phase clustering output using hierarchi-
cal clustering. If the clustering technique cannot han-
dle the difference between pure phases and mixed
phases, the resulting phase diagram can be incorrect.
Since a mixed phase region is generally located be-
tween its constituent pure phases, the distinction is not
clear if the clustering does not consider this property.
In contrast, there is a clear distinction between the
pure phase regions output by the proposed method;
the mixed phases are found to be well located between
their constituent phases. This illustrates the benefit of
using the proposed phase mapping approach for high-
throughput XRD experiments over the current prac-
tice of using hard clustering techniques which cannot
distinguish between pure phases and mixed phases.
5 CONCLUSIONS AND FUTURE
WORKS
In this paper, we presented a novel approach to en-
hance the phase mapping of high-throughput experi-
ment by combining the fuzzy c-means clustering al-
gorithm with effortless manual analysis by domain
experts using hierarchical clustering. The proposed
phase mapping approach is evaluated using samples
from high-throughput experiment for the composi-
tion space of two ternary alloys- Co-Ni-Ta and Co-
Ti-Ta. The results obtained using current cluster-
ing techniques illustrate that hard clustering algo-
rithms are not suitable for analysis of 1D XRD pat-
terns. Even though distance metrics which are re-
silient to peak shifting, such as dynamic time warp-
ing (DTW) and earth mover’s distance (EMD), they
still do not work for 1D XRD patterns. On the
other hand, we demonstrated that we can leverage
together a fuzzy clustering algorithm with the well
known euclidean metric, along with traditional hard
clustering algorithm (hierarchical clustering) with a
little manual analysis by domain experts to produce
composition phase diagram that closely resemble the
manually computed phase diagram by domain scien-
tists. This illustrates that handling the mixed phases
is a key issue in performing phase clustering analy-
sis for 1D XRD patterns. The results in this work
are compared against the potential manually com-
puted phase diagrams in past literature and validated
by domain experts. For both Co-Ni-Ta and Co-Ti-
Ta composition spaces, there are nine pure phases
present in the manually computed phase diagram
and hence, expected by domain experts. Although
the presented approach requires a small amount of
manual analysis of the initial pure phase represen-
tations for merging in the second step, we expect it
to significantly reduce the existing manual efforts re-
quired in the phase mapping of large volume of sam-
ples coming from high-throughput XRD experiments.
The code implementation of the proposed approach
is available at https://github.com/dipendra009/
FuzzyClustering. We plan to work towards au-
tomating the overall process in the future and release
resulting software for domain scientists for the analy-
sis of their high-throughput XRD datasets.
Enhancing Phase Mapping for High-throughput X-ray Diffraction Experiments using Fuzzy Clustering
513

ACKNOWLEDGMENT
This work was performed under the following
financial assistance award 70NANB14H012 and
70NANB19H005 from U.S. Department of Com-
merce, National Institute of Standards and Technol-
ogy as part of the Center for Hierarchical Materi-
als Design (CHiMaD), DND-CAT located at Sector
5 of the Advanced Photon Source (APS) at Argonne
National Lab supported by DOE under Contract No.
DE-AC02-06CH11357, the MRSEC program of the
National Science Foundation (DMR-1720139), and
the Soft and Hybrid Nanotechnology Experimental
(SHyNE) Resource (NSF NNCI-1542205). Partial
support is also acknowledged from DOE awards DE-
SC0014330, DE-SC0019358.
REFERENCES
Baraldi, A. and Blonda, P. (1999). A survey of fuzzy clus-
tering algorithms for pattern recognition. ii. IEEE
Transactions on Systems, Man, and Cybernetics, Part
B (Cybernetics), 29(6):786–801.
Bergerhoff, G., Hundt, R., Sievers, R., and Brown, I.
(1983). The inorganic crystal structure data base.
Journal of chemical information and computer sci-
ences, 23(2):66–69.
Bezdek, J. C. (1981). Objective function clustering. In
Pattern recognition with fuzzy objective function al-
gorithms, pages 43–93. Springer.
Bish, D. L. and Post, J. E. (1989). Modern powder diffrac-
tion, volume 20. Mineralogical Society of America
Washington, DC.
Bunn, J. K., Hu, J., and Hattrick-Simpers, J. R. (2016).
Semi-supervised approach to phase identification
from combinatorial sample diffraction patterns. JOM,
68(8):2116–2125.
Chung, J.-S. and Ice, G. E. (1999). Automated index-
ing for texture and strain measurement with broad-
bandpass x-ray microbeams. Journal of applied
physics, 86(9):5249–5255.
Cullity, B. (1978). Elements of xrd diffraction, addition-
wesley. Reading, MA.
Gilmore, C. J., Barr, G., and Paisley, J. (2004). High-
throughput powder diffraction. i. a new approach to
qualitative and quantitative powder diffraction pattern
analysis using full pattern profiles. Journal of applied
crystallography, 37(2):231–242.
Hattrick-Simpers, J. R., Gregoire, J. M., and Kusne, A. G.
(2016). Perspective: Composition–structure–property
mapping in high-throughput experiments: Turning
data into knowledge. APL Materials, 4(5):053211.
Iwasaki, Y., Kusne, A. G., and Takeuchi, I. (2017). Com-
parison of dissimilarity measures for cluster analysis
of x-ray diffraction data from combinatorial libraries.
npj Computational Materials, 3(1):4.
Jha, D., Kusne, A. G., Al-Bahrani, R., Nguyen, N., Liao,
W.-k., Choudhary, A., and Agrawal, A. (2019). Peak
area detection network for directly learning phase re-
gions from raw x-ray diffraction patterns. In 2019
International Joint Conference on Neural Networks
(IJCNN), pages 1–8. IEEE.
Jones, E., Oliphant, T., Peterson, P., et al. (2001–). SciPy:
Open source scientific tools for Python. [Online; ac-
cessed ¡today¿].
Klug, H. P. and Alexander, L. E. (1974). X-ray diffrac-
tion procedures: for polycrystalline and amorphous
materials. X-Ray Diffraction Procedures: For Poly-
crystalline and Amorphous Materials, 2nd Edition, by
Harold P. Klug, Leroy E. Alexander, pp. 992. ISBN 0-
471-49369-4. Wiley-VCH, May 1974., page 992.
Moore, D. M. and Reynolds, R. C. (1989). X-ray Diffraction
and the Identification and Analysis of Clay Minerals,
volume 322. Oxford university press Oxford.
Park, W. B., Chung, J., Jung, J., Sohn, K., Singh, S. P., Pyo,
M., Shin, N., and Sohn, K.-S. (2017). Classification of
crystal structure using a convolutional neural network.
IUCrJ, 4(4):486–494.
Peters, G., Crespo, F., Lingras, P., and Weber, R. (2013).
Soft clustering–fuzzy and rough approaches and their
extensions and derivatives. International Journal of
Approximate Reasoning, 54(2):307–322.
Tatlier, M. (2011). Artificial neural network methods for the
prediction of framework crystal structures of zeolites
from xrd data. Neural Computing and Applications,
20(3):365–371.
Warner, J. Scikit-fuzzy: A fuzzy logic toolbox for scipy.
Woolfson, M. M. and Woolfson, M. M. (1997). An introduc-
tion to X-ray crystallography. Cambridge University
Press.
ICPRAM 2021 - 10th International Conference on Pattern Recognition Applications and Methods
514
