
Synergy Conformal Prediction for Regression
Niharika Gauraha and Ola Spjuth
Department of Pharmaceutical Biosciences, Uppsala University, Uppsala, Sweden
Keywords:
Conformal Prediction, Machine Learning, Regression, Synergy, Ensemble Methods.
Abstract:
Large and distributed data sets pose many challenges for machine learning, including requirements on com-
putational resources and training time. One approach is to train multiple models in parallel on subsets of data
and aggregate the resulting predictions. Large data sets can then be partitioned into smaller chunks, and for
distributed data sets the need for pooling can be avoided. Combining results from conformal predictors using
synergy rules has been shown to have advantageous properties for classification problems. In this paper we
extend the methodology to regression problems, and we show that it produces valid and efficient predictors
compared to inductive conformal predictors and cross-conformal predictors for 10 different data sets from
the UCI machine learning repository using three different machine learning methods. The approach offers a
straightforward and compelling alternative to pooling data, such as when working in distributed environments.
1 INTRODUCTION
Data has become one of the key assets of many or-
ganizations, and the amount of data continues to in-
crease in virtually all domains; sometimes referred to
as Big Data (Hashem et al., 2015; Stephens et al.,
2015; Gandomi and Haider, 2015). Training statis-
tical (machine) learning models on large data sets
can be challenging from different perspectives (El-
ish and danah boyd, 2018). For example, large data
sets require substantial computational hardware, and
in some cases large data can be difficult to move into
a single computer (Zhou et al., 2017). A multitude of
approaches have been developed for machine learn-
ing on large data sets (Zhou et al., 2017; Peteiro-
Barral and Guijarro-Berdi
˜
nas, 2013). The most pop-
ular methodology is probably to train a global model
in distributed environments that preserves data local-
ity, using frameworks such as Apache Spark (Meng
et al., 2016). Another methodology is to distribute
(partition) data into smaller units and train multiple
models in parallel and aggregate predictions (Vapnik
and Izmailov, 2016).
Conformal Prediction is a relatively recent
methodology where conformal predictors are built on
top of standard machine learning algorithms and com-
plement the predictions with valid measures of confi-
dence (Vovk et al., 2005). The two main approaches
are Transductive Conformal Prediction (TCP) (Vovk,
2013) and Inductive Conformal Prediction (ICP) (Pa-
padopoulos, 2008) and they can be used for both clas-
sification and regression problems. The main draw-
back of using TCP is that it is computationally de-
manding; for every test example a re-training of the
model is required. ICP was developed to overcome
this issue; it has little computational overhead to the
underlying algorithm but there is some loss in terms
of informational efficiency due to a subset of training
examples are set aside for calibration. To address this
problem of information efficiency, ensembles of con-
formal predictors were introduced such as Cross Con-
formal Prediction (CCP) (Vovk, 2015) and Aggre-
gated Conformal Prediction (ACP) (Carlsson et al.,
2014a). The validity of TCP and ICP is proven in
that they produce 1 − ε expectation tolerance regions,
where ε is the selected significance level (Vovk et al.,
2005). However, the validity of ensembles of CPs has
not been theoretically proven and has been discussed
in (Carlsson et al., 2014a) and (Linusson et al., 2017).
Synergy Conformal Prediction (SCP) was re-
cently proposed to address the validity problem of en-
sembles of conformal predictors that combines mono-
tonic conformity scores instead of p-values (Gauraha
and Spjuth, 2018). Its applicability has been shown
in two scenarios; where data is partitioned in order to
reduce the total model training time, and where an en-
semble of different machine learning methods is used
to improve the overall efficiency of predictions.
In this paper, we extend the SCP methodology for
regression problems and explore its usefulness when
partitioning large data and aggregating results, and
also for working with distributed data without pooling
into a single dataset. The paper is organized in the fol-
lowing way. In section 2, we outline the background
212
Gauraha, N. and Spjuth, O.
Synergy Conformal Prediction for Regression.
DOI: 10.5220/0010229402120221
In Proceedings of the 10th International Conference on Pattern Recognition Applications and Methods (ICPRAM 2021), pages 212-221
ISBN: 978-989-758-486-2
Copyright
c
2021 by SCITEPRESS – Science and Technology Publications, Lda. All rights reserved

concepts and notations used throughout the paper. In
Section 3 we introduce synergy conformal prediction
for regression and discuss its properties. In Section
4 we perform numerical analysis on a set of real data
sets. In Section 5 we summarize our results, and in
Section 6 we conclude and discuss implications and
future outlook.
2 BACKGROUND
In this paper we mainly focus on regression problems
and assume exchangeability of observations. The ob-
ject space is denoted by X ⊂ R
p
, where p is the num-
ber of features, and label space is denoted by Y ⊂ R.
We assume that each example consists of an object
and its label, and its space is given as Z := X × Y .
In a classical regression setting, given ` data points
Z = {z
1
,...,z
`
} where each example z
i
= (x
i
,y
i
) is la-
beled, we want to predict the label of a new object
x
new
.
In the conformal prediction setting, a nonconfor-
mity measure is a way of measuring the strangeness of
an example in relation to the previous examples (Vovk
et al., 2005). In our experiments, we use the standard
regression nonconformity measure
α
i
= |y
i
− ˆy
i
|, (1)
where ˆy
i
is the estimated output for the object x
i
using regression algorithms such as Support Vector
Regression (SVR) or Random Forests (RF).
Definition 1. Inductive Conformal Prediction (ICP)
for Regression (Papadopoulos et al., 2002)
Given a training set of ` examples, Z = {z
1
,...,z
`
},
drawn from an exchangeable distribution P, the train-
ing data is first divided into a proper training set {Z
T
}
and a calibration set {Z
C
}, where (T,C) is a partition
of {1, ..., `}. The regression algorithm (e.g. SVR or
RF) is applied to the proper training set, and using the
decision rule a strangeness measure is associated with
every example in the calibration set. In particular, we
use the standard regression nonconformity measure
α
i
= |y
i
− f (x
i
)| = |y
i
− ˆy
i
|,i ∈ C (2)
where f : X → Y , is a prediction rule of the model
trained on the proper training set Z
T
, and ˆy is the
estimated output. To denote the dependency on the
proper training set we write the decision rule as
f (Z
T
,.). Let us denote by α
(1)
,...,α
(|C|)
the sequence
of all α
i
corresponding to the calibration set sorted in
the ascending order. Let x
new
(following the same dis-
tribution P) be the new object we want to predict, and
let ˆy
new
be its estimated label using the same function
f (Z
T
,.). The Prediction Interval (PI) for the new ob-
ject x
new
is then computed as
( ˆy
new
− α
(s)
, ˆy
new
+ α
(s)
), (3)
where s =
b
ε(|C| + 1)
c
, and ε ∈ (0, 1) is a chosen sig-
nificance level, and (1−ε) is the confidence level. We
denote an ICP by a tuple (Z
C
, f (Z
T
,.)), which con-
sists of the calibration Z
C
set and the decision rule
given by its training set, Z
T
.
As ICP uses only part of the training examples for
training its underlying algorithm, and part of the ex-
amples for calculating the α-scores, it may result in
lower informational efficiency. The Cross Confor-
mal Predictor (CCP) for regression was introduced
in (Papadopoulos, 2015) and is based on a cross-
validation approach which helps overcome the infor-
mational loss of ICP; instead of only using a subset
of the data as a calibration set, data is divided into K
disjoint folds where each fold is treated as the cali-
bration set, and the others as the proper training set.
Other ensembles of conformal predictors for classifi-
cation discussed in (Gauraha and Spjuth, 2018) have
also been effectively applied to regression problems.
Most of these ensembles methods for regression prob-
lems aim to get more informational efficient confor-
mal predictors by combining p-values (or by com-
bining prediction intervals). Since the combined p-
values need not be uniformly distributed, as a result
the final models are not guaranteed to be valid, see
(Linusson et al., 2017) for more details. Another re-
lated method is Ensemble Cross Conformal Predic-
tion (ECCP) (Beganovic and Smirnov, 2018) for clas-
sification settings, that has been shown to be com-
putationally efficient. The synergy conformal predic-
tion for classification was introduced in (Gauraha and
Spjuth, 2018) which is an ensemble method that com-
bines monotonic conformity scores, and is capable of
producing valid prediction interval.
3 REGRESSION SYNERGY
CONFORMAL PREDICTION
The objective of this paper is to extend SCP to re-
gression problems, which was originally inspired by
“Synergy of Monotonic Rules” proposed in (Vapnik
and Izmailov, 2016). For classification problems, it
has been shown that, by combining monotonic con-
formity scores of the calibration set and the test ex-
amples, SCP is capable of producing valid prediction
regions. As with SCP for classification, for regression
problems also one can suggest to combine nonconfor-
mity scores of the calibration set and test examples
computed from multiple trained models on the
Synergy Conformal Prediction for Regression
213

Algorithm 1: Synergy Conformal Predictor for Regression with data partitioning.
Input: training dataset:Z, object to predict:x
new
, a regression algorithm:A, number of partitions: M
Output: Prediction Interval (PI)
Step1: Split the training set into two smaller sets, {Z
T
} and the calibration set {Z
C
}. (T,C) is a partition
of {1,...,|Z|}.
Step2: Split the set Z
T
into M proper training sets, {Z
T
m
,m = 1, . . . , M}. (T
1
,...,T
M
) is a partition of T .
Step3: For each part Z
T
m
, train and construct the rule to generate nonconformity scores.
Step4: Compute the combined nonconformity scores across M models for each example in the
calibration set, α
j
, for j ∈ C, using eq. 5.
Step5: Compute the averaged estimated value across M regression models for the new object x
new
,
which results in ˆy
new
.
Step6: Compute prediction interval, PI using eq 3.
return PI
individual partitions of the proper training set. How-
ever, for regression settings it is difficult to compute
nonconformity score for a test example as the postu-
lated output can be a real number. Therefore, we pro-
pose to combine predicted outputs for test examples
for constructing the prediction intervals using Equa-
tion 3. Synergy conformal prediction for regression is
described in the following.
Consider ` examples, Z = {z
1
,...,z
`
}, drawn from
an exchangeable distribution P. Similar to ICP, the
training data is first divided into the proper training
set {Z
T
} and the calibration set {Z
C
}, where (T,C)
is a partition of {1, ..., `}. Then the proper training
data is further divided into M non-empty disjoint sub-
sets and each subset Z
T
m
,m = 1, . . . , M is then used for
training. Here (T
1
,...,T
M
) is a partition of T . The M
predictive models trained on the individual partitions
are then used to compute the nonconformity scores
for the calibration set denoted by α
m j
, for j ∈ C and
m = 1, . . . , M. For example,
α
m j
= |y
i
− f
m
(x
i
)|, (4)
where f
m
(x) is the prediction rule defined by the pre-
dictive model trained on the m
th
part of the train-
ing set. The aggregated nonconformity scores across
models are then defined as
α
j
=
1
M
∑
m
α
m j
. (5)
Let x
new
(follows the same distribution P) be
the object we want to predict, and let ˆy be the av-
eraged estimated value across models. The syn-
ergy conformal predictor corresponding to the tuple
(Z
C
, f
1
(Z
T
1
,.),..., f
m
(Z
T
M
,.)) is defined as a predic-
tion interval (PI) as given by eq. (3).
The SCP method differs from most of the other
ensemble methods discussed previously in that SCP
combines nonconformity scores rather than combin-
ing the conformal p-values or prediction intervals. In
the following, we discuss the validity property of Re-
gression SCP.
Proposition 1. The synergy conformal predictor for
regression is valid
Proof. For unpartitioned data, when the proper train-
ing set as a whole is used for training, in that case
SCP is exactly ICP and hence valid (Papadopoulos
et al., 2002). For partitioned training data, SCP
can be viewed as a single ICP (hence valid), when
the ensemble of M regression methods is consid-
ered as one function producing the (combined) non-
conformity scores. To illustrate this, let us con-
sider partitioning of the set Z
T
, into M subsets,
Z
T
1
,... , Z
T
M
, and let their corresponding decision
rules be f
1
(Z
T
1
,.),.. . , f
m
(Z
T
M
,.) respectively. De-
fine a new decision rule f (Z
T
,.) which combines
the estimated values of an example z, f (Z
T
,z) =
1
M
∑
M
m=1
f
m
(Z
T
m
,z). Then the nonconformity scores
can be computed using the combined estimated val-
ues. The pair {Z
C
, f (Z
T
,.)} forms an ICP correspond-
ing to the new decision rule f (Z
T
,.), hence valid.
4 EXPERIMENTS
We evaluate Regression SCP on ten regression
datasets from UCI machine learning repository (Lich-
man et al., 2013), namely Boston Housing Data
(Housing)Wine Quality (Wine), Parkinson Speech
Dataset with Multiple Types of Sound Recordings
(PD), Combined Cycle Power Plant (PowerPlant),
Energy Efficiency (Energy), Concrete Compressive
Strength (Concrete), Electrical Grid Stability Sim-
ulated Data (GridStability), Superconductivty Data
(SuperConduct), Condition Based Maintenance of
Naval Propulsion Plants (CBM) and SkillCraft1 Mas-
ter Table Dataset (Game). Since ICP and CCP, run-
ning on whole datasets, are computationally expen-
sive, we select randomly 2000 data points from larger
datasets. In all our experiments, the data is scaled
for target (or label) and for all features to be within
ICPRAM 2021 - 10th International Conference on Pattern Recognition Applications and Methods
214

Table 1: Datasets from UCI repository that are used in
the evaluation. Train refers to the number of examples in
the training set, Calib refers to the number of examples in
the calibration set, Test refers to the number of objects in
the test set, Features refer to the number of features in the
dataset.
Dataset Train Calib Test Features
Housing 282 122 102 13
Wine 1120 480 400 10
PD 582 250 208 26
PowerPlant 1120 480 400 4
Energy 429 185 154 8
Concrete 576 248 206 8
GridStability 1120 480 400 12
SuperConduct 1120 480 400 81
CBM 1120 480 400 16
Game 1120 480 400 18
the [0,1] range, as feature scaling improves the con-
vergence of the underlying optimization method and
target is scaled for better comparisons.
Four experiments were carried out (the exper-
iments will be explained in greater detail further
down), where each dataset was randomly divided into
a training and test subset of sizes using a 80 : 20 ratio.
The training set was further (randomly) divided into
proper training set and calibration set of sizes using
a 70 : 30 ratio. The specific breakdowns for training,
calibration and test sets are given in Table 1. Then the
proper training set was randomly partitioned into M
equal parts, and a model was trained on each individ-
ual part. We used three machine learning algorithms:
Support Vector Regression using linear kernel (SVR),
Support Vector Regression using RBF kernel (RBF-
SVR) (implemented in Python with LIBSVM) and
Random Forest (RF) (implemented in Python). The
corresponding hyper-parameters were learned using
5-fold cross-validation and the best value was used to
train the final model on the entire dataset. The esti-
mated target values ˆy were computed for each exam-
ple in calibration set and test set, and were averaged
across models. Then the predictions interval (PI) was
computed using the averaged predicted values accord-
ing to Equation 3. The whole process was repeated 10
times.
To assess a conformal predictor we consider valid-
ity and efficiency(Vovk et al., 2016; Svensson et al.,
2018). In our experiments, validity is empirically
assessed in terms of calibration plots; the plot of the
percentage of errors against ε ∈ (0,1) being close to
the bisector of the first quadrant with some statistical
fluctuations. We use size of the prediction interval as
the measure of efficiency; lower width implies better
informational efficiency and hence indicates a
‘better’ model.
4.1 Experiment 1: Synergy of
Conformal Prediction using the
Same Machine Learning Algorithm
on Partitioned Data
The objective of this experiment is to compare effi-
ciency of SCP with ICP on partitioned and unparti-
tioned data, using linear (linear SVR) and non-linear
(SVR with RBF kernel) regression methods. Inspired
by the experiments in (Vapnik and Izmailov, 2016)
we partition the proper training set into three equal
partitions in the SCP method, and results for the test
sets are shown in Table 2. To illustrate the quantita-
tive difference between ICP
p
, ICP and SCP, box plots
for dispersion of efficiencies are presented in Figures
1a and 1b for SuperConduct dataset (similar plots are
shown in the Appendix for the remaining datasets).
We also perform this experiment with more partitions
(5,7,9,11,15 and 20) for a couple of datasets selected
randomly, and the results are reported in Table 3.
From Table 2 we observe that ICP on unpartioned
data using non-linear regression method (RBF-SVR)
performs best for each individual measures as ex-
pected, whereas both ICP
p
linear and non-linear have
somewhat larger intervals (lower efficiency) as com-
pared to the corresponding SCPs for most of the
cases, which is more prominent for the non-linear
case. This pattern is repeated for the case when we
have more partitions which is evident from Table 3.
4.2 Experiment 2: Synergy of
Conformal Prediction using
Different Machine Learning
Algorithms on Partitioned Data
The objective of Experiment 2 is similar to Exper-
iment 1, with the difference that multiple machine
learning methods were used for the different parti-
tions. We use the same setup as in the previous exper-
iment with three equal partitions of the proper train-
ing set, but with three different machine learning al-
gorithms: linear SVR, Random Forest (RF) and SVR
using RBF kernel (RBF-SVR) for each partition. The
results are reported in Table 4. To illustrate the quan-
titative difference between ICP
p
and SCP, box plots
are presented in Figure 1c for Super Conduct dataset.
From Table 4 we observe that all ICP
p
have lower
efficiency as compared to the SCP for most of the
datasets.
Synergy Conformal Prediction for Regression
215

Table 2: Results from Experiment 1, Synergy of Conformal Prediction using the Same Machine Learning Algorithm on
Partitioned Data. Efficiency is calculated at confidence level 90% for linear SVR and non-linear SVR with RBF kernel is used
as the underlying machine learning algorithm. ICP
p
corresponds to the partition with the best efficiency, ICP to the efficiency
where the whole dataset is used, and SCP to the synergy conformal prediction with regression method.
Linear NonLinear
Dataset ICP
p
ICP SCP ICP
p
ICP SCP
Housing 0.316 0.312 0.309 0.282 0.219 0.249
Wine 0.203 0.201 0.204 0.207 0.195 0.199
PD 1.605 1.519 1.465 1.603 1.545 1.441
PowerPlant 0.207 0.208 0.209 0.191 0.19 0.186
Energy 0.265 0.28 0.276 0.255 0.177 0.245
Concrete 0.441 0.446 0.443 0.356 0.275 0.325
GridStability 0.430 0.426 0.422 0.235 0.177 0.209
SuperConduct 0.483 0.466 0.478 0.400 0.351 0.377
CBM 0.380 0.321 0.367 0.022 0.018 0.021
Game 0.534 0.533 0.538 0.535 0.528 0.535
Table 3: Results from Experiment 1, using different parti-
tions where non-linear SVR with RBF kernel is used as the
underlying machine learning algorithm.
Housing # Partitions ICP
p
ICP SCP
5 0.322 0.219 0.278
7 0.336 0.219 0.286
9 0.382 0.219 0.312
11 0.397 0.219 0.317
15 0.426 0.219 0.336
20 0.428 0.219 0.351
SuperConduct # Partitions ICP
p
ICP SCP
5 0.430 0.351 0.380
7 0.450 0.351 0.397
9 0.450 0.351 0.410
11 0.488 0.351 0.419
15 0.506 0.351 0.434
20 0.539 0.351 0.452
4.3 Experiment 3: Synergy of
Conformal Prediction using
Different Machine Learning
Algorithms on Unpartitioned Data
The objective of this study is to compare SCP with
ICP and CCP trained on the whole training set, in
order to show that using different machine learning
algorithms for training the same data (proper train-
ing set) in SCP also improves the informational effi-
ciency. In this experiment we use three different ma-
chine learning algorithms: linear SVR, RF and RBF-
SVR; the results are reported in Table 5. The results
of the individual ICPs and SCP are given in columns
2-4 and column 5 respectively. Column 6-8 shows
Table 4: Results from Experiment 2, Synergy of Conformal
Prediction using Different Machine Learning Algorithms
on partitioned Data. Efficiency is calculated at confidence
level 90% for ICP
p
and SCP with synergy of three differ-
ent machine learning algorithms: linear SVR, RF and RBF-
SVR. The SVR-ICP
p
corresponds to the ICP on first par-
tition with linear SVR as underlying algorithm, RF-ICP
p
to the ICP on second partition with RF as underlying algo-
rithm, RBF-SVR-ICP
p
to the third partition with SVR with
RBF as underlying algorithm, and SCP to the Synergy Con-
formal Prediction with Regression method.
Dataset SVR-
ICP
p
RF-
ICP
p
RBF-
SVR-
ICP
p
SCP
Housing 0.316 0.294 0.317 0.256
Wine 0.212 0.299 0.216 0.212
PD 1.605 1.600 1.603 1.393
PowerPlant 0.210 0.205 0.191 0.187
Energy 0.276 0.193 0.278 0.220
Concrete 0.441 0.309 0.356 0.317
GridStability 0.432 0.394 0.238 0.299
SuperConduct 0.485 0.424 0.400 0.382
CBM 0.381 0.412 0.022 0.224
Game 0.534 0.567 0.537 0.525
the average informational efficiency of Cross Confor-
mal Prediction (CCP) applied on the whole training
set with three fold cross conformal prediction using
linear SVR, RF and RBF-SVR as an underlying ma-
chine learning algorithm respectively. The prediction
intervals for CCP were combined by taking the me-
dians of the lower and upper bounds as suggested
in (Park and Budescu, 2015). It is important to note
that in this experiment the methods ICP (70:30), SCP
(70:30) and CCP (2/3:1/3, due to three folds) get al-
most the same amount of training and calibration data,
ICPRAM 2021 - 10th International Conference on Pattern Recognition Applications and Methods
216

and that SCP and ICP combines results from three dif-
ferent methods, and three folds respectively. To illus-
trate the quantitative difference between the ICP, SCP
and CCP, box plots are presented in Figure 1d for Su-
per Conduct dataset.
From Table 5 it is observed that efficiency of SCP
on unpartioned data is higher than ICP and CCP for
more than half of the datasets.
4.4 Experiment 4: Validity of
Conformal Predictors
In this section we study the validity of ICP, SCP and
CCP. We use the same setup as in Experiment 1, using
Random Forest (RF) with 10 trees as the underlying
machine learning algorithm. We also train three fold
CCP using RF with 10 trees. Calibration plots are
available in Figure 2, indicating that all models show
little deviation from validity.
5 DISCUSSIONS
The aim of this paper was to develop SCP for re-
gression and to explore its performance in different
settings. In Experiment 1, we considered partitioned
proper-training data with the same machine learning
algorithm applied on each partition. As with SCP for
classification, SCP for regression also succeeded in
combining the models (see Table 2) and for the linear
case achieved an efficiency that was on par with the
individual best ICP
p
, whereas in the non-linear case
using SVR with RBF kernel SCP showed improved
efficiency (lower median prediction interval width)
for all datasets as compared with ICP
p
. The differ-
ence between ICP trained on the entire dataset and
the SCP regression methodology is not large in abso-
lute numbers for the NonLinear case (Table 2), but we
observe a decrease the efficiency of SCP with a larger
number of partitions which is expected since the indi-
vidual sub-models are then trained on less data. Nev-
ertheless, SCP outperformed the best individual par-
tition ICP
p
in all cases. In Experiment 2, we con-
sidered partitioned proper training data with different
machine learning algorithms applied on each parti-
tion. Table 4 shows results from the evaluation, and
we note that in 7 out of 10 datasets, SCP has the low-
est (best) efficiency compared to the other methods
trained on individual partitions. We here argue that
using SCP for integrating predictions using different
machine learning models in most cases is superior
than relying on an individual prediction methodology.
This would resemble a real-world use case when dif-
ferent organizations have implemented different mod-
eling methods, are not able to share data, but are able
to share nonconfomity measures to make up an ag-
gregated prediction. In Experiment 3, we considered
unpartitioned proper training data with different ma-
chine learning algorithms, hence all individual parties
have access to the entire dataset but use different un-
derlying machine learning methods. Table 5 shows
that for 6 out of 10 datasets, SCP has improved effi-
ciency compared to the individual methods using ICP.
Further, the results comparing SCP with CCP show
that SCP integrating different machine learning meth-
ods is in all cases superior than using a three-fold CCP
with a single machine learning method. In Experi-
ment 4, results show that all method indicate valid
models (close to the bisector of the first quadrant),
with a small deviation observed for CCP. The attrac-
tive property for ICP to produce valid models while
aggregating results over multiple models constitutes
a clear improvement over previous aggregation meth-
ods for conformal predictors, such as reported in (Li-
nusson et al., 2017; Carlsson et al., 2014b).
The experiments show in general that SCP has
attractive properties for aggregating prediction inter-
vals, evaluated on a set of benchmark datasets using
different forms of data partitioning. While SCP do not
live up to producing as efficient models as for pooling
all data in one location and training an ICP, in almost
all cases it is advantageous compared to the best indi-
vidual model trained on partitioned data. This impli-
cates that SCP has good applicability in distributed or
federated settings, where data is located in different
locations and cannot be pooled due to privacy, regula-
tory, or practical reasons. We also envision that SCP
could be a foundation upon which implementations
can train individual partition in parallel, such as in
locality-aware Big Data frameworks. The main draw-
back of SCP is that it requires a calibration set that
is shared between individual partitions. This is likely
not a big concern when partitioning data, but it does
constitute an additional step when working with data
sources that are distributed.
6 CONCLUSIONS AND FUTURE
DIRECTIONS
We introduced Synergy Conformal Prediction for
regression and evaluated its validity and informa-
tional efficiency using various underlying machine
learning algorithms. The key outcome is that SCP
offers an alternative to pooling distributed data when
using inductive conformal predictors, with reduced
training time as models can be trained in parallel and
predictions aggregated, while still preserving validity.
Synergy Conformal Prediction for Regression
217
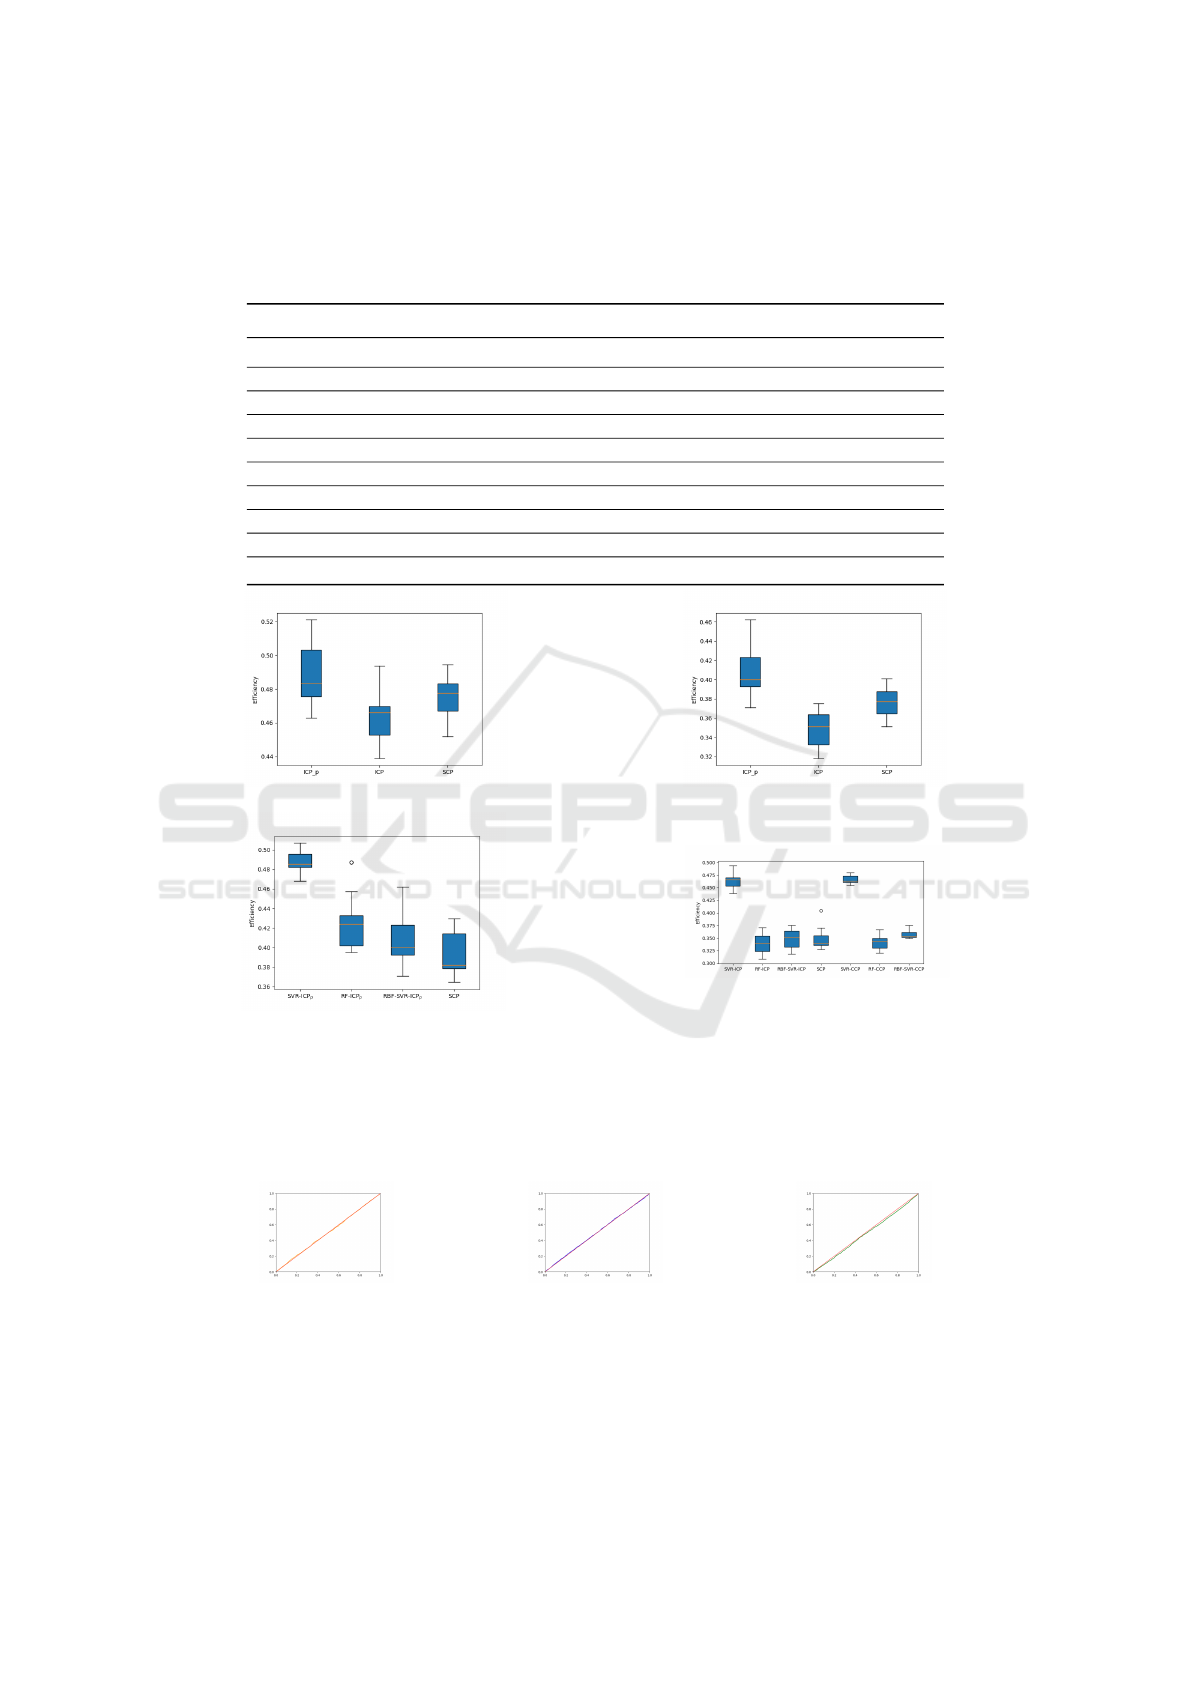
Table 5: Results from Experiment 3, Synergy of Conformal Prediction using Different Machine Learning Algorithms on
Unpartitioned Data. Efficiency is calculated at confidence level 90% for ICP, SCP and CCP on unpartitioned data using three
different machine learning algorithms (linear SVR, RF and RBF-SVR). Columns 2-4 shows results from ICP, the fifth column
shows results for SCP for an ensemble of different machine learning algorithms , and columns 6-8 shows results for three fold
CCPs.
Dataset SVR-ICP RF-ICP RBF-ICP SCP SVR-CCP RF-CCP RBF-CCP
Housing 0.312 0.233 0.219 0.216 0.316 0.241 0.224
Wine 0.201 0.258 0.195 0.194 0.209 0.256 0.199
PD 1.519 1.400 1.545 1.436 1.522 1.461 1.582
PowerPlant 0.208 0.196 0.190 0.180 0.205 0.195 0.186
Energy 0.28 0.190 0.177 0.168 0.294 0.188 0.184
Concrete 0.446 0.238 0.275 0.267 0.446 0.233 0.271
GridStability 0.426 0.315 0.177 0.251 0.419 0.324 0.180
SuperConduct 0.466 0.340 0.351 0.340 0.463 0.344 0.353
CBM 0.321 0.224 0.018 0.153 0.321 0.228 0.019
Game 0.533 0.533 0.528 0.516 0.534 0.533 0.531
(a) Linear SVR, partitioned data (b) RBF-SVR, partitioned data
(c) Different ML Models
(d) Unpartitioned data
Figure 1: Results from Experiment 1, 2 and 3 comparing the efficiency between different methods for the SuperConduct
dataset. (a and b): Experiment 1, comparison of individual ICPs trained on data partitions, ICP on the entire dataset, and
SCP where (a) linear SVR is used, and (b) RBF SVR is used as the underlying machine learning algorithm; (c): Experiment
2, comparing individual ICPs on partitions and SCP where three different algorithms (linear SVR, RF and RBF-SVR ) are
used on partitioned training data; (d): Experiment 3 comparing ICP, SCP and CCP where three methods (linear SVR, RF and
RBF-SVR ) are used on unpartitioned training data.
(a) ICP (b) SCP (c) CCP
Figure 2: Illustration of validity of ICP, SCP and CCP for Super Conduct dataset using random forest (with 10 trees) for
training all the underlying models.
ICPRAM 2021 - 10th International Conference on Pattern Recognition Applications and Methods
218

The efficiency of SCP does not reach the level of
ICP trained on pooled data, but efficiency is lower
(lower median prediction interval width) compared to
the predictions made on the best individual partition,
indicating attractive properties in distributed and fed-
erated settings as a valid confidence predictor. Future
directions when working on partitioned data include
(i) studying the effect of the number and size of data
partitions as well as overlapping partitions (ii) eval-
uating the effect of different nonconformity scores
and different underlying machine learning algorithms
with individual partitions.
REFERENCES
Beganovic, D. and Smirnov, E. (2018). Ensemble
cross-conformal prediction. In Proceedings of the
2018 IEEE International Conference on Data Min-
ing Workshops, ICDM Workshops, Singapore, Singa-
pore, November 17-20, 2018, pages 870–877, United
States. IEEE.
Carlsson, L., Eklund, M., and Norinder, U. (2014a). Ag-
gregated conformal prediction. In IFIP International
Conference on Artificial Intelligence Applications and
Innovations, pages 231–240. Springer.
Carlsson, L., Eklund, M., and Norinder, U. (2014b). Aggre-
gated conformal prediction. In Iliadis, L., Maglogian-
nis, I., Papadopoulos, H., Sioutas, S., and Makris, C.,
editors, Artificial Intelligence Applications and Inno-
vations, pages 231–240. Springer Berlin Heidelberg.
Elish, M. C. and danah boyd (2018). Situating methods in
the magic of big data and ai. Communication Mono-
graphs, 85(1):57–80.
Gandomi, A. and Haider, M. (2015). Beyond the hype: Big
data concepts, methods, and analytics. International
Journal of Information Management, 35(2):137–144.
Gauraha, N. and Spjuth, O. (2018). Synergy conformal pre-
diction. UU.
Hashem, I. A. T., Yaqoob, I., Anuar, N. B., Mokhtar, S.,
Gani, A., and Khan, S. U. (2015). The rise of “big
data” on cloud computing: Review and open research
issues. Information systems, 47:98–115.
Lichman, M. et al. (2013). Uci machine learning repository.
Linusson, H., Norinder, U., Bostr
¨
om, H., Johansson, U.,
and L
¨
ofstr
¨
om, T. (2017). On the calibration of ag-
gregated conformal predictors. In Gammerman, A.,
Vovk, V., Luo, Z., and Papadopoulos, H., editors, Pro-
ceedings of the Sixth Workshop on Conformal and
Probabilistic Prediction and Applications, volume 60
of Proceedings of Machine Learning Research, pages
154–173, Stockholm, Sweden. PMLR.
Meng, X., Bradley, J., Yavuz, B., Sparks, E., Venkataraman,
S., Liu, D., Freeman, J., Tsai, D., Amde, M., Owen,
S., et al. (2016). Mllib: Machine learning in apache
spark. The Journal of Machine Learning Research,
17(1):1235–1241.
Papadopoulos, H. (2008). Inductive conformal prediction:
Theory and application to neural networks. In Tools
in artificial intelligence, pages 315–329. InTech.
Papadopoulos, H. (2015). Cross-conformal prediction with
ridge regression. In International Symposium on Sta-
tistical Learning and Data Sciences, pages 260–270.
Springer.
Papadopoulos, H., Proedrou, K., Vovk, V., and Gammer-
man, A. (2002). Inductive confidence machines for re-
gression. In European Conference on Machine Learn-
ing, pages 345–356. Springer.
Park, S. and Budescu, D. V. (2015). Aggregating multiple
probability intervals to improve calibration. Judgment
and Decision Making, 10(2):130.
Peteiro-Barral, D. and Guijarro-Berdi
˜
nas, B. (2013). A
survey of methods for distributed machine learning.
Progress in Artificial Intelligence, 2(1):1–11.
Stephens, Z. D., Lee, S. Y., Faghri, F., Campbell, R. H.,
Zhai, C., Efron, M. J., Iyer, R., Schatz, M. C., Sinha,
S., and Robinson, G. E. (2015). Big data: astronomi-
cal or genomical? PLoS biology, 13(7):e1002195.
Svensson, F., Aniceto, N., Norinder, U., Cortes-Ciriano, I.,
Spjuth, O., Carlsson, L., and Bender, A. (2018). Con-
formal regression for quantitative structure–activity
relationship modeling—quantifying prediction uncer-
tainty. Journal of Chemical Information and Model-
ing, 58(5):1132–1140.
Vapnik, V. and Izmailov, R. (2016). Synergy of monotonic
rules. The Journal of Machine Learning Research,
17(1):4722–4754.
Vovk, V. (2013). Transductive conformal predictors. In
IFIP International Conference on Artificial Intelli-
gence Applications and Innovations, pages 348–360.
Springer.
Vovk, V. (2015). Cross-conformal predictors. Annals of
Mathematics and Artificial Intelligence, 74(1-2):9–28.
Vovk, V., Fedorova, V., Nouretdinov, I., and Gammerman,
A. (2016). Criteria of efficiency for conformal predic-
tion. In Symposium on Conformal and Probabilistic
Prediction with Applications, pages 23–39. Springer.
Vovk, V., Gammerman, A., and Shafer, G. (2005). Algo-
rithmic learning in a random world. Springer Science
& Business Media.
Zhou, L., Pan, S., Wang, J., and Vasilakos, A. V. (2017).
Machine learning on big data: Opportunities and chal-
lenges. Neurocomputing, 237:350 – 361.
Synergy Conformal Prediction for Regression
219
APPENDIX
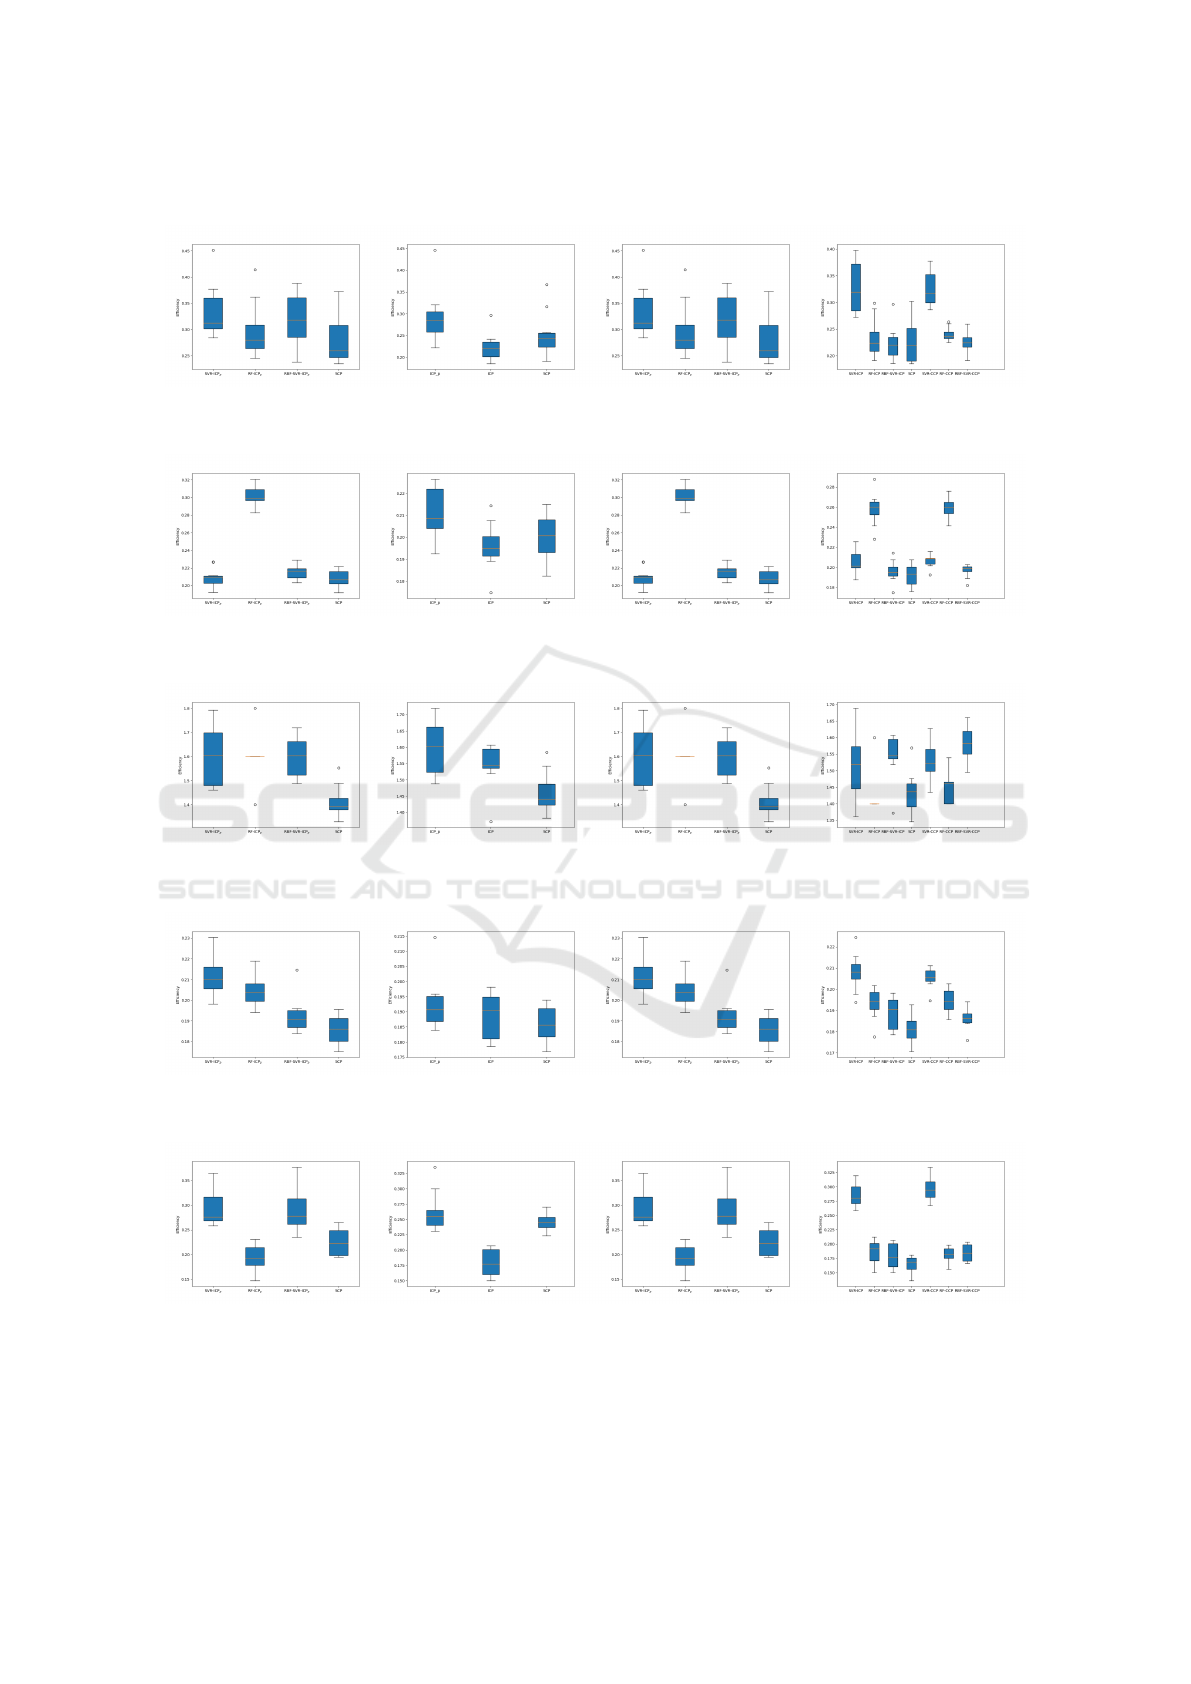
(a) Linear SVR (b) RBF-SVR (c) Different ML Models (d) Unpartitioned data
Figure 3: Results from Experiment 1, 2 and 3 comparing the efficiency between different methods for Housing dataset.
(a) Linear SVR (b) RBF-SVR (c) Different ML Models (d) Unpartitioned data
Figure 4: Results from Experiment 1, 2 and 3 comparing the efficiency between different methods for Wine dataset.
(a) Linear SVR (b) RBF-SVR (c) Different ML Models (d) Unpartitioned data
Figure 5: Results from Experiment 1, 2 and 3 comparing the efficiency between different methods for PD dataset.
(a) Linear SVR (b) RBF-SVR (c) Different ML Models (d) Unpartitioned data
Figure 6: Results from Experiment 1, 2 and 3 comparing the efficiency between different methods for PowerPlant dataset.
(a) Linear SVR (b) RBF-SVR (c) Different ML Models (d) Unpartitioned data
Figure 7: Results from Experiment 1, 2 and 3 comparing the efficiency between different methods for Energy dataset.
ICPRAM 2021 - 10th International Conference on Pattern Recognition Applications and Methods
220
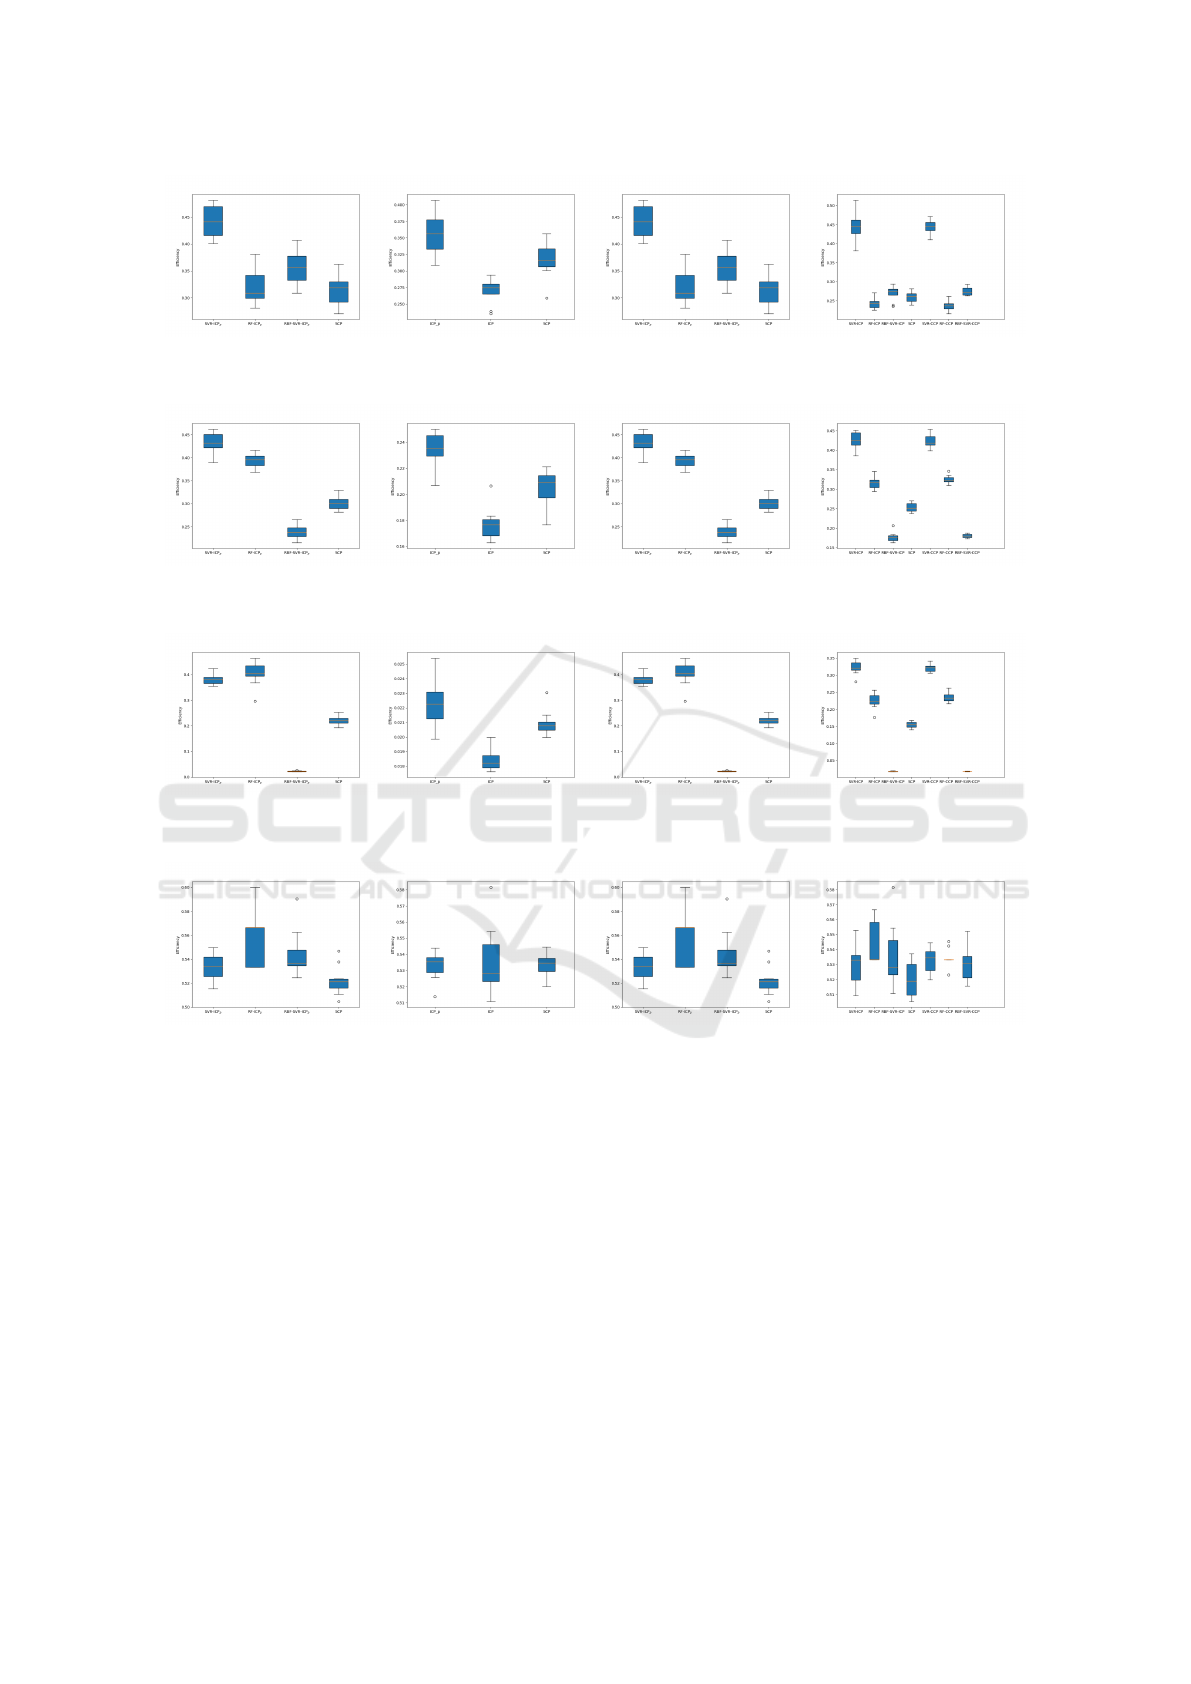
(a) Linear SVR (b) RBF-SVR (c) Different ML Models (d) Unpartitioned data
Figure 8: Results from Experiment 1, 2 and 3 comparing the efficiency between different methods for Concrete dataset.
(a) Linear SVR (b) RBF-SVR (c) Different ML Models (d) Unpartitioned data
Figure 9: Results from Experiment 1, 2 and 3 comparing the efficiency between different methods for GridStability dataset.
(a) Linear SVR (b) RBF-SVR (c) Different ML Models (d) Unpartitioned data
Figure 10: Results from Experiment 1, 2 and 3 comparing the efficiency between different methods for CBM dataset.
(a) Linear SVR (b) RBF-SVR (c) Different ML Models (d) Unpartitioned data
Figure 11: Results from Experiment 1, 2 and 3 comparing the efficiency between different methods for Game dataset.
Synergy Conformal Prediction for Regression
221
