
Integration of Multiple RGB-D Data of a Deformed Clothing Item into
Its Canonical Shape
Yasuyo Kita
1
, Ichiro Matsuda
1
and Nobuyuki Kita
2
1
Dept. Electrical Engineering, Faculty of Science and Technology, Tokyo University of Science, Noda, Japan
2
TICO-AIST Cooperative Research Laboratory for Advanced Logistics,
National Institute of Advanced Industrial Science and Technology (AIST), Tsukuba, Japan
Keywords:
Recognition of Deformable Objects, Robot Vision, Automatic Handling of Clothing.
Abstract:
To recognize a clothing item so that it can be handled automatically, we propose a method that integrates
multiple partial views of the item into its canonical shape, that is, the shape when it is flattened on a planar
table. When a clothing item is held by a robot hand, only part of the deformed item can be seen from one
observation, which makes the recognition of the item very difficult. To remove the effect of deformation, we
first virtually flatten the deformed clothing surface based on the geodesic distances between surface points,
which equal their two-dimensional distances when the surface is flattened on a plane. The integration of
multiple views is performed on this flattened image plane by aligning flattened views obtained from different
observations. Appropriate view directions for efficient integration are also automatically determined. The
experimental results using both synthetic and real data are demonstrated.
1 INTRODUCTION
Recently, the demand for the automatic recognition of
daily objects has increased aimed at robots working in
the daily lives of people. The recognition of clothing
items for the handling of clothing is a typical example.
Large shape variation that originates from the
physical deformation of clothing items makes the task
of recognizing the items challenging. Deformation
also reduces the size of the area that can be viewed
from one direction as shown in Fig. 1, where a cloth-
ing item is handled by a robot. It is not easy to de-
termine the clothing type (e.g., trousers) or to localize
the best position to grasp next (e.g. the corner of the
waist) from such a partial view of the item in curved
shape. Therefore, many studies on clothing recog-
nition for automatic handling have first attempted to
spread the clothing item to reduce the level of defor-
mation from a canonical shape, that is, the shape when
the item is flattened on a plane (F. Osawa and Kamiya,
2007) (Hu and Kita, 2015) (D. Triantafyllou and As-
pragathos, 2016) (A. Doumanoglou, 2014). However,
selecting proper positions to grasp for good spreading
is another difficult recognition problem. Additionally,
such a strategy requires extra actions and time. Using
the fewest handling actions that directly connect to
the task goal is desirable.
A totally different approach from those, virtual
flattening, was proposed (Kita and Kita, 2016), which
calculates the shape of a clothing item flattened on
a plane from the three-dimensional (3D) data of its
deformed shape. This approach has the following
advantages for automatic handling of clothing items.
First, it can avoid extra handling actions that do not
directly connect to its task. Second, the obtained flat-
tened shape nearly equals the item’s canonical shape,
that is a typical shape of each clothing item we imag-
ine. Therefore, once the flattened shape is obtained,
clothing type and size can be relatively easily deter-
mined. In addition, each part of the virtual flattened
shape can have the linkage of the 3D coordinates in
the current deformed shape. Therefore, the 3D infor-
mation necessary for the next action, such as the 3D
location and normal direction of a waist corner, is di-
rectly known using the linkage between the flattened
shape and observed RGB-D data, as illustrated by the
red line in Fig. 1. Concretely, the method calculates
the boundary of a flattened shape based on the cal-
culation of geodesic line, which is the shortest path
between two points on an arbitrary curved surface.
However, the results were limited to the flattening of
partial view or a simple combination of them (Y.Kita
and N.Kita, 2019).
910
Kita, Y., Matsuda, I. and Kita, N.
Integration of Multiple RGB-D Data of a Deformed Clothing Item into Its Canonical Shape.
DOI: 10.5220/0010228209100918
In Proceedings of the 16th International Joint Conference on Computer Vision, Imaging and Computer Graphics Theory and Applications (VISIGRAPP 2021) - Volume 5: VISAPP, pages
910-918
ISBN: 978-989-758-488-6
Copyright
c
2021 by SCITEPRESS – Science and Technology Publications, Lda. All rights reserved
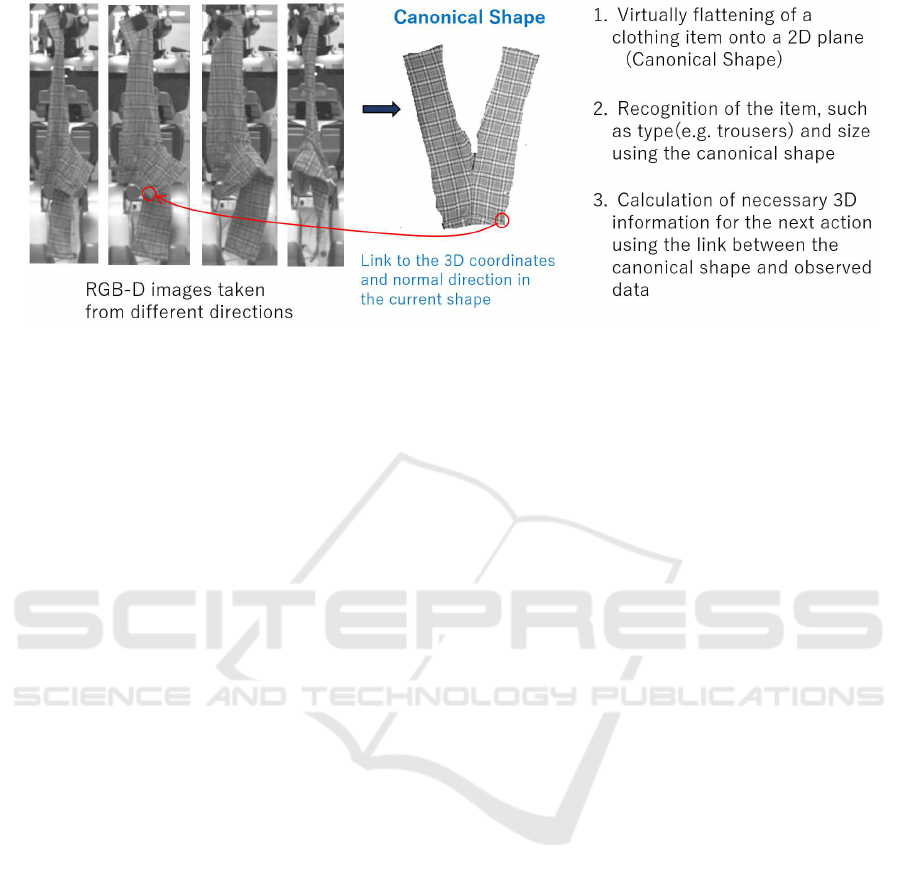
Figure 1: Strategy: recognition of a hanging clothing item using its canonical shape calculated from multiple RGB-D data.
In this study, we propose a method to calculate not
only the boundary contour but also the inside area of
the virtually flattened view. Hereafter, we refer to the
shape after virtual flattening as the flattened view. The
flattened views calculated from multiple 3D observed
data are integrated on the flattened plane by aligning
them using the attributes of each pixel in the flattened
view images, such as intensity (color) and 3D coordi-
nates, inherited from the corresponding 3D observed
points.
The contributions of the present work are sum-
marized as follows: (1) flattening of whole clothing
surface area, (differently from only contours of the
surface (Y.Kita and N.Kita, 2019); (2) integration of
multiple 3D views onto the 2D flattened plane; (3) au-
tomatic determination of efficient view directions for
the integration.
The paper is organized as follows. Section 2 sur-
veys related works. Sections 3 and 4 explain the
methods of flattening the 3D clothing surface and of
integrating the flattened views. Section 5 presents
and discusses the experimental results using both syn-
thetic and actual clothing items. Section 6 summa-
rizes our work and discusses plans for future work.
2 RELATED WORK
As described in Section 1, most of existing meth-
ods first spread the clothing item before recogniz-
ing the clothing item. Osawa et al. (F. Osawa and
Kamiya, 2007) proposed a method that re-grasps the
lowest point of a clothing item twice to open the
item and reduce the deformation variation. However,
the shapes that form after the actions are not nec-
essarily discriminating and there is often undesired
twisting of the item. Hue et al.(Hu and Kita, 2015)
proposed a method of finding the appropriate grasp-
ing point for bringing an item into a small number
of limited shapes from a sequence of 3D data ob-
tained from various viewing directions. However, de-
tection of appropriate points for the action is not so
easy. Recently, many researchers applied a learning
approach for handling clothing items, some of which
are dealing with hanging clothes(A. Doumanoglou,
2014)(I. Mariolis and Malassiotis, 2015)(E. Corona
and Torras, 2018)(Stria and Hlavac, 2018). However,
huge number of data for learning is required and its
applicability to other settings of robots and sensors
is uncertain. In addition, the output of most of the
method is just a type of category and does not indicate
any information of the clothing state that is necessary
to determine next action.
The method of calculating flattened surface with-
out actual flattening (Kita and Kita, 2016) uses the
geodesic distances on the surface observed by a 3D
range sensor. Since 3D range data observed from one
direction, in most of times, does not show the whole
surface of the item due to curving of the surface, the
method was extended to integrate two views captured
from largely different directions (Y.Kita and N.Kita,
2019). However, the latter assumed that the corre-
spondence between some surface points in different
views are given. It is difficult to automatically de-
tect multiple reliable point correspondences under the
scenario in which each observed view shows only a
small part of the surface. Additionally, these meth-
ods calculate only the boundary shape of the flattened
clothing item, but do not flatten its inside area.
The flattening of a 3D surface onto a 2D plane
has been studied mainly regarding graphical 3D mod-
els and/or uniformly dense 3D data using finite ele-
ment meshes(Zhong and Xu, 2006) or a voxel rep-
resentation(R. Grossmann and Kimme, 2002). How-
ever, both mesh-based and voxel-based methods as-
Integration of Multiple RGB-D Data of a Deformed Clothing Item into Its Canonical Shape
911
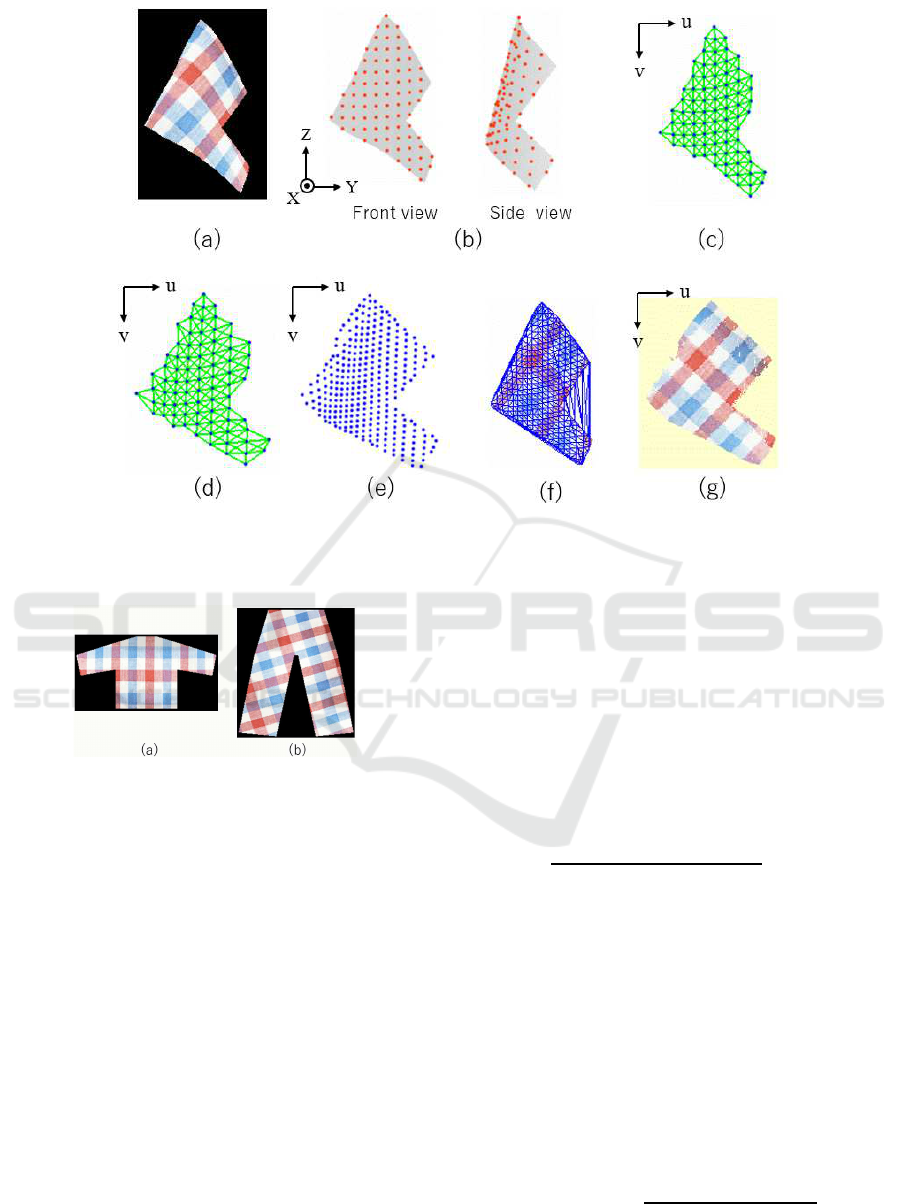
Figure 2: Flattening process: (a) synthetic RGB-D data; (b) sampled 3D points (orange points) on the observed 3D points
(grey dots); (c) initial state using sampled points (blue point), P
12
n
with pairs of B(n
1
,n
2
) = 1 (green line); (d) convergence
state for P
12
n
; (e) convergence state for P
6
n
; (f) triangulation using P
6
n
as vertices; and (g) flattened view.
Figure 3: Model used for synthetic data: (a) a long-sleeved
shirt; and (b) trousers.
sume uniformly dense 3D data of objects, which is
not always the case for observation data in the real
world. To calculate a geodesic line directly from 3D
point clouds obtained by a range sensor or stereo cam-
eras, (Y.Kita and N.Kita, 2019) adopts an approach
that calculates geodesic lines in a mesh-free way, pro-
posed by Kawashima et al (T. Kawashima, 1999). In
this paper, by sampling points from a clothing surface
with small distances, we approximate the geodesic
distances between the neighboring points by the Eu-
clidean distances.
3 FLATTENING OF OBSERVED
3D SURFACE
We assume that a clothing surface can be flattened
onto a 2D image plane F(u,v). The input of our
method is RGB-D data of a clothing item: 3D point
cloud, P
n
(n = 1, ...,N). Flattening can be formulated
as the problem of calculating the 2D coordinates of
P
n
on the plane, that is, (u
n
,v
n
). when the surface is
flattened.
We focus on that the geodesic line length of two
surface points equals with the 2D distance between
the points when the surface is flattened on a 2D plane.
That is, the geodesic lengths give distance constraints
among (u
n
,v
n
). Concretely, the coordinates should
satisfy the equation
q
(u
n
1
− u
n
2
)
2
+ (v
n
1
− v
n
2
)
2
= G
n
1
,n
2
, (1)
where G
n
1
,n
2
is the geodesic distance between P
n
1
and
P
n
2
on the surface.
Because high accuracy of the flattened shape is not
necessarily required for our purpose, by only using
point pairs in the close vicinity, we approximate the
geodesic distance between two points by the 3D Eu-
clidean distance between them in the 3D point cloud,
E
n
1
,n
2
,
By representing the use/disuse of E
n
1
,n
2
as
B(n
1
,n
2
) = {1,0}, flattening becomes the minimiza-
tion problem of the equation
H(u, v) =
N−1
∑
n
1
=1
N
∑
n
2
=n
1
+1
B(n
1
,n
2
)(
q
(u
n
1
− u
n
2
)
2
+ (v
n
1
− v
n
2
)
2
− E
n
1
,n
2
)
2
.
(2)
VISAPP 2021 - 16th International Conference on Computer Vision Theory and Applications
912

The solution is then obtained by solving 2N simul-
taneous equations, where the two equations for each
P
n
are
∂H(u,v)
∂u
n
= 0,
∂H(u,v)
∂v
n
= 0.
To simplify the search of neighboring points, we
record the observed 3D points P
n
in a depth image
D(i, j), where each pixel (i
n
, j
n
) has the 3D coordi-
nates of the point observed in the pixel direction. We
sample the surface points from D(i, j) with some in-
terval d to obtain a reasonable number of points P
d
n
(n = 1, ...,N
d
) for practically solving the simultaneous
equations. Although a small sampling width yields
high-resolution flattening, the calculation of a large
number of equations without an appropriate initial es-
timate is time-consuming and leads to instability. To
avoid this, we start with a large d and use the result as
the initial state for high-resolution flattening.
Fig. 2 shows an example of these processes us-
ing the artificial 3D shape in 2(a), which is synthe-
sized through the simulation of physical deformation
of the clothing model in Fig. 3(a), when the cloth-
ing item is held at one bottom corner using Maya
nCloth(GOULD, 2004). The grey dots and orange
points in Fig. 2(b) illustrate the 3D points recorded in
D(i, j) and points P
12
n
sampled with the interval of 12
pixels. Figs. 2(c) and 2(d) show the initial state using
(u
n
,v
n
) = (i
n
, j
n
) and the result of solving the mini-
mization of Eq. (2), respectively: the blue points and
green lines illustrate P
12
n
and pairs of B(n
1
,n
2
) = 1.
Using the result as the initial state of points P
6
n
sam-
pled with the interval of 6 pixels, the flattened state for
a high resolution is calculated as shown in Fig. 2(e).
By interpolating the inside area based on Delaunay
triangulation using the resultant points as its vertices,
as shown in Fig. 2(f), the flattened image of the 3D
surface in Fig. 2(a), F(u, v), is obtained, as shown in
Fig. 2(g).
In order to use the attribute of each pixel of the
flattened view at the following alignment stage, we
record nine attributes for each pixel in F(u, v) by in-
heriting ones of the corresponding 3D point: color in-
formation (r, g,b), 3D coordinates (x,y,z), and normal
directions (n
x
,n
y
,n
z
).
4 INTEGRATION OF
FLATTENED VIEWS
The integration of flattened views is performed by
aligning them on the flattened view plane. This strat-
egy has the advantage of decreasing the search space
of the alignment from the 3D space into the 2D space,
that is, six degrees of freedom to three degrees of free-
dom, which increases the stability and efficiency of
the alignment.
Under the scenario in which a clothing item is
held by a (robot) hand, the clothing surface is curved
and/or folded, mainly in the horizontal direction. To
observe hidden parts behind the leftmost (or right-
most) boundaries of the clothing regions, the cloth-
ing item is rotated along the vertical axis through the
holding position. Here, we call the leftmost (or right-
most) boundary as an “occluding edge “ if the bound-
ary divides one surface into visible and hidden parts.
4.1 Calculation of the Appropriate
Rotation Angle
We start with the observed data taken from the view
direction that provides the largest observed area of the
clothing surface. The flattened view calculated from
the data is extended by adding a flattened view calcu-
lated from a new observation after rotating the item
so that the parts around the occluding edge move to
more center. To align a new flattened view to the
current view correctly, a sufficient overlapping area
is necessary between the current and additional flat-
tened views. From this viewpoint, the rotation angle
should be small. By contrast, if the angle is too small,
the newly added area is small and meaningless.
To automatically determine an appropriate ro-
tation angle, we adopt the following processes. To
simplify the explanation, we explain the processes by
considering only the leftmost occluding edge. In the
case of the rightmost occluding edge, the steps of 3
and 4 are slightly changed to fit the right side.
1. Calculate the Z-angle of each pixel in the current
flattened view
We focus on the component of the surface normal
that is perpendicular to the Z-axis, the vertical axis,
and calculate its angle from the X-axis (the direction
of the camera) as illustrated in the diagram under
Fig. 4(a). The value is tan
−1
(n
y
/n
x
) ∗ 180/π, and
is called the Z-angle hereafter. The Z-angle of each
pixel in the current flattened view F(u,v) is stored as
F(u, v).a. The intensity values in Fig. 4(a) show the
value of (F(u,v).a+ 90) of the flattened view in Fig.
2(g) under the assumed range of the measurement
limit of the range sensor |F(u,v).a| < A
w
. We used
A
w
= 50 degrees in all the experiments in this study.
In the process below, only the pixels within the range
are considered.
Integration of Multiple RGB-D Data of a Deformed Clothing Item into Its Canonical Shape
913
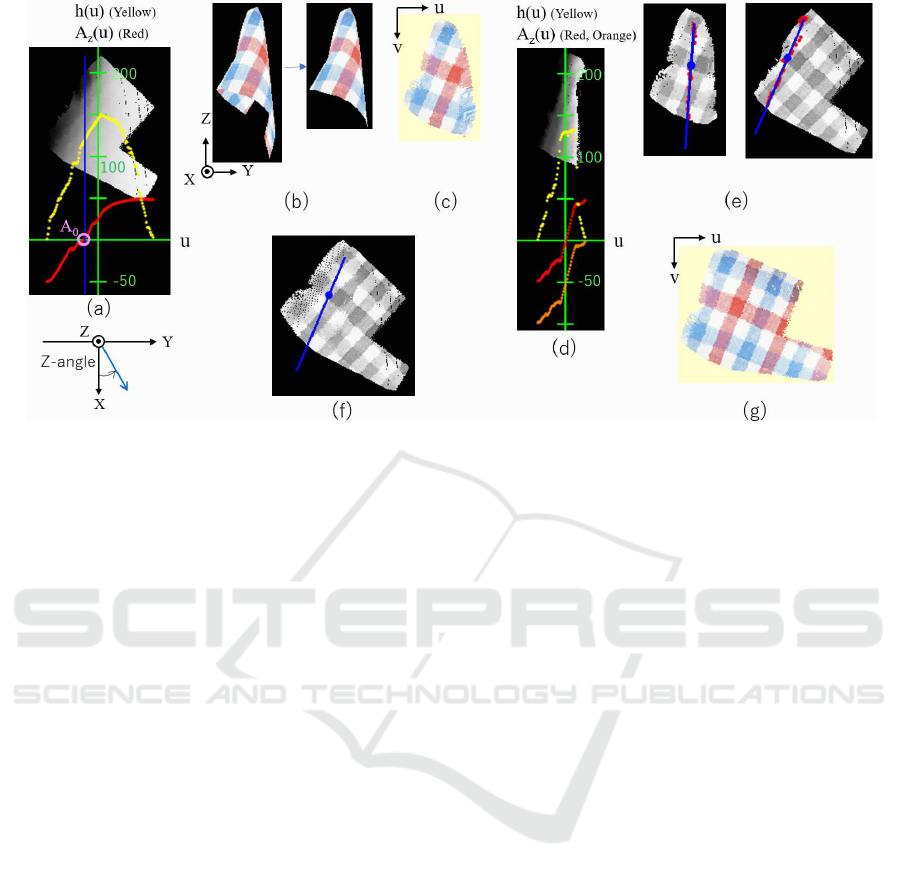
Figure 4: Integration process: (a) histogram and average Z-angle for the row of u of the current flattened view; (b) selected
view for addition; (c) flattened view of the selected view; (d) histogram and average Z-angle for the row of u of the additional
flattened view; (e) corresponding lines and points based on the Z-angle; (f) initial state for alignment; and (g) renewed flattened
view.
2. Calculate the number of pixels h(u) and the aver-
age Z-angle A
z
(u)
h(u) is the number of pixels having the same u coordi-
nates. Under the situation where the clothing surface
is curved in the horizontal direction, the points of the
same u have similar Z-angle. We calculate the aver-
age of them, A
z
(u). The yellow and red lines in Fig.
4(a) show h(u) and A
z
(u), respectively, in the coor-
dinates, (u,h(u)) and (u,A
z
(u)), illustrated by green
lines.
3. Find the Z-angle A
0
= A
z
(u
b
), where
∑
u
b
u=0
h(u) >
S
0
.
The blue line in Fig. 4(a) represents u = u
b
, where
the area from the occluding line exceeds the desirable
overlapped area size S
0
. The pink circle that is the in-
tersection of the blue line and the red line shows A
0
.
S
0
is set based on the expected area size of the cloth-
ing item.
4. Determine the rotation angle A = A
w
− A
0
To have a common area of size S
0
, the Z-angle A
0
should be within the measurement limit range after
the A rotation; that is, A
0
+ A < A
w
. To consider the
maximum value under the condition, the next view
direction is set to A = A
w
− A
0
.
The left and right images in Fig. 4(b) show a
synthetic observation after rotating the item by A =
50 − 0 = 50 degrees, and its front-side area only. In
this study, we assume that only the 3D data of the side
of interest is segmented by pre-processing the data.
Fig. 4(c) is the flattened view calculated from this 3D
data using the method explained in Section 3.
4.2 Alignment of Two Flattened Views
The initial estimate of the alignment is also deter-
mined based on the Z-angle. First, the h
1
(u) and
A
1
z
(u) of the additional flattened view are calculated,
where the superscript 1(0) corresponds to the addi-
tional (current) flattened views. The yellow, red, and
orange lines in Fig. 4(d) show the h
1
(u), A
1
z
(u), and
A
1
z
(u) − A. The last value represents the Z-angle be-
fore A-degree rotation, that is, the value in the first
(current) flattened view. The overlap of the range
of A
0
z
(u) and the range of (A
1
z
(u) − A) represents the
range of the Z-angle of surface points that are ob-
served in both data.
To find the corresponding pixels between the two
flattened views, pixels with the Z-angle of the median
value of the overlapped range, A
m
, are detected from
the current flattened view, whereas pixels with the Z-
angle of (A
m
+ A) are detected from the additional
flattened view. The red points in Fig. 4(e) represent
the pixels. Then, the first principle axes of the de-
tected pixels on the images are calculated as shown
by the blue lines in Fig. 4(e). Pixels that have the
same z value (height in the 3D space) along the lines
are searched to find a pair of corresponding pixels.
The initial estimate of 2D translation and 1D rotation
are determined so that the corresponding pixels and
lines coincide. Fig. 4(f) shows the initial estimate.
VISAPP 2021 - 16th International Conference on Computer Vision Theory and Applications
914
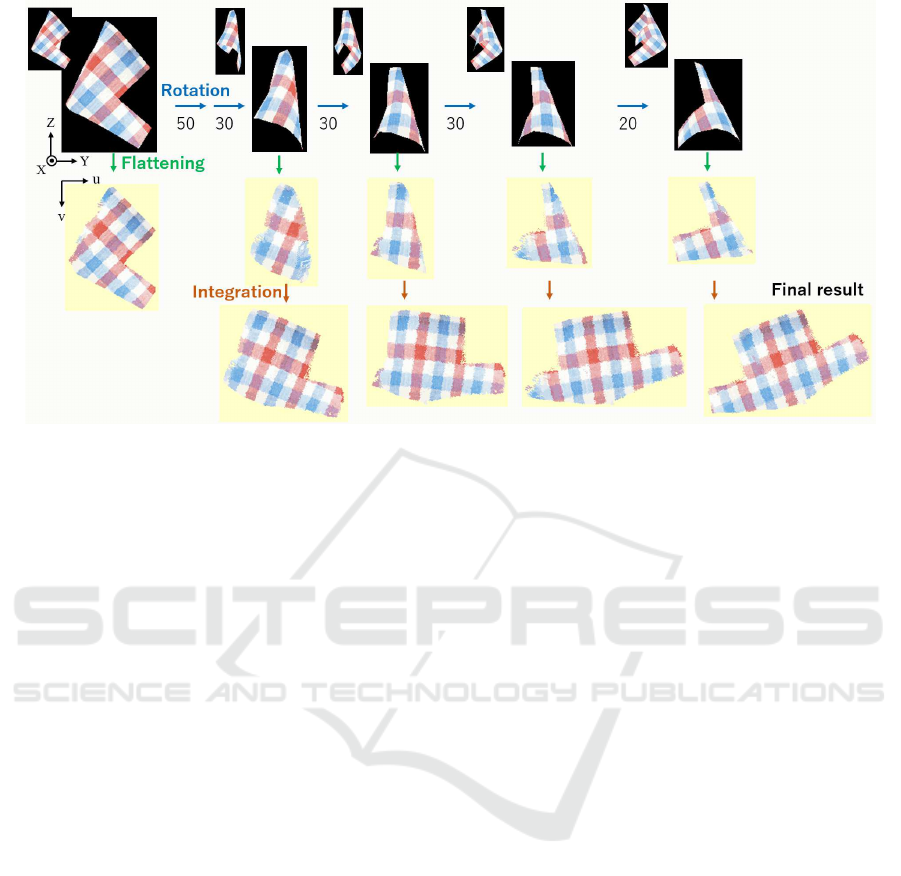
Figure 5: Experimental results using the synthetic data of a long-sleeved shirt.
The final alignment is obtained by searching the best
match by adding some translational and rotational dis-
turbance to the initial state. As criteria to assess the
goodness of the alignment, we use the intensity and z
(height) attributes of the flattened views.
4.3 Renewal of the Flattened View
When a pixel in the renewed flattened view has two
observed data from both the current and additional
flattened view, the data of the latter is selected in the
half area that includes the occluding edge. In the other
half side, the Z-angle of the corresponding pixels is
checked and the data that has a smaller absolute an-
gle is selected because the 3D data observed with a
smaller absolute Z-angle is more reliable. The orien-
tation of the renewed flattened view is set as the same
as the additional flattened view, so that the angle dif-
ference from the next-added flattened view becomes
smaller. Fig. 4(g) shows the renewed flattened view.
5 EXPERIMENTS
To examine the validity of the proposed method and
also its practical applicability, we conducted experi-
ments using both artificial data and the data of actual
clothing items observed by an RGB-D sensor. Long-
sleeved shirts and trousers were used in the both ex-
periments because they are two typical clothing types
and have more a complicated shape than other types,
such as skirts. We assume the scenario in which a
robot grasps a clothing item at its lowest point after
arbitrary picking it up, which is often used to decrease
the shape variation. After this basic action, the cloth-
ing item should be held at any tip of the sleeves/legs
or any corner of the bottom/top lines. In both experi-
ments, the minimum and maximum angle of rotation
were set to 10 and 50 degrees, respectively, with the
selection step of 10 degrees.
5.1 Experiments using Artificial RGB-D
Data
Artificial RGB-D data were generated from the 3D
shape obtained by synthetically deforming the two
models in Fig. 3 using Maya nCloth(GOULD, 2004).
Fig. 5 shows a case in which a long-sleeved shirt
was held at a corner of the waist. The top left im-
age in Fig. 5 shows the starting view, which had the
largest observed area, and the image below is its flat-
tened view obtained using the method described in
Section 3. From the leftmost and rightmost Z-angle
values, -49.0 and 20.0, respectively, only the left part
was searched for occluded parts of the surface. Using
the method described in Section 4, the flattened view
was extended gradually using observed data obtained
by rotating the item by 50, 30, 30, 30, and 20 degrees,
as shown in Fig. 5. For the views in which only a
small part of the surface was visible, the rotation an-
gles were determined to be smaller. As a result, six
effective observations, the view direction of 0, -50, -
80, -110, -140, and -160 degrees from the initial state,
were used, which led to efficient and good flattening
(the bottom right image).
Integration of Multiple RGB-D Data of a Deformed Clothing Item into Its Canonical Shape
915
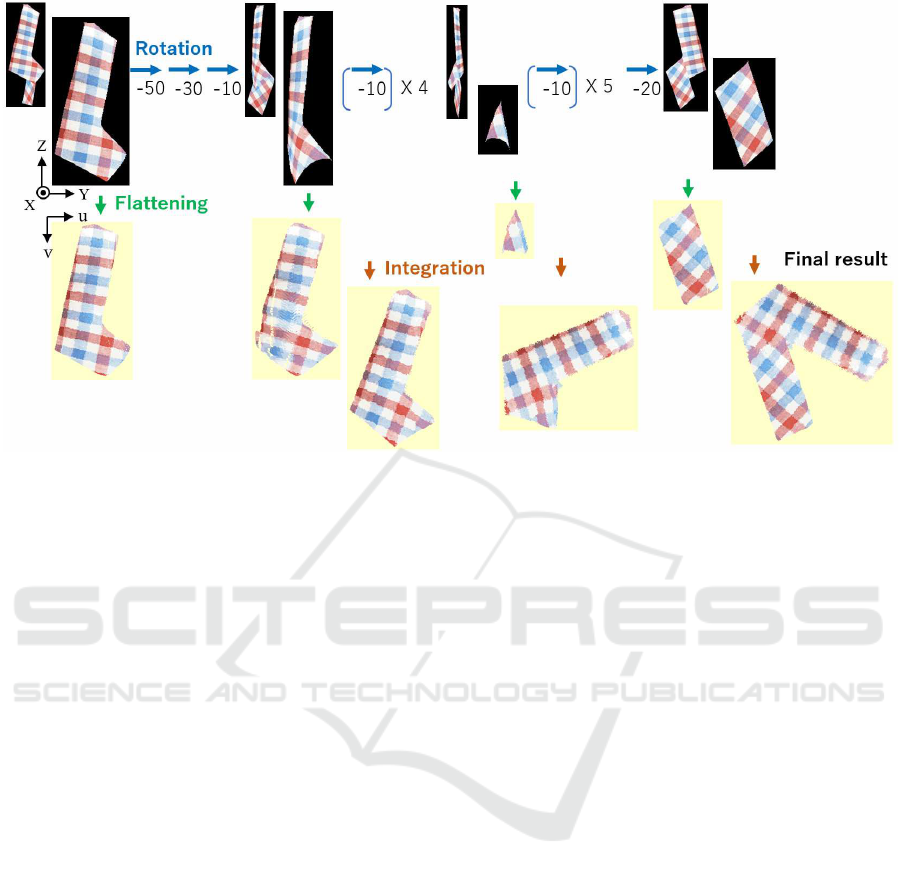
Figure 6: Experimental results using the synthetic data of trousers.
Fig. 6 shows a case in which trousers were held
at the tip of one leg. In this case, the fold at the joint
of the thigh of one leg was fairly steep. As a result,
within a long range of -90 to -180 degrees from the
initial state, only a small part of the surface was visi-
ble. The proposed method properly decreased the ro-
tation angles in the range so that it succeeded in ob-
taining the entire surface, as shown in the final result.
The view directions used were 0, 50, 80, 90, 100, 110,
120, 130, 140, 150, 160, 170, 180, and 200 degrees.
5.2 Experiments using Real Clothing
Items
We also conducted preliminary experiments using
real clothing items by observing them using an RGB-
D sensor: RealSense D435 (RealSense, 2020). Each
clothing item was hung at any tip of the sleeves/legsor
any corner of the bottom/top lines and captured while
it was rotated by 10 degrees around the vertical axis
through the holding position. As noted previously, the
3D data that belongs to one side of the surface of in-
terest should be extracted from all the observed data
before applying the proposed method. We found that
the 3D data outputted from RealSense were strongly
smoothed, and two surfaces were often smoothly con-
nected. Because this made automatic segmentation
very difficult, we manually extracted the 3D data of
only the surface of interest.
Fig. 7(a) shows the results of the flattening of a
long-sleeved shirt with a green checkered pattern held
at the tip of a sleeve. Seven views were selected to
obtain the flattened view of the entire surface, specif-
ically, taken from 0, -40, -50, -60, -90, -130, and -160
degrees from the initial view direction. Although the
resultant flattened view, shown in Fig. 7(c), is not as
realistic compared with the physically flattened shape
shown in Fig. 7(b), it has a sufficiently close shape
to enable the recognition of the clothing type and ap-
proximate size.
Fig. 8 shows another two results. Fig. 8 (a) shows
the result of a pair of trousers when it was held at a
corner of the waist. An entire surface was flattened
using seven view directions: 0, -50, -70, -80, -90,-
100, and -150 degrees. However, the flattening of the
trousers held at the tip of one leg failed at the steep
fold of one leg. Although the 3D shape was similar
to the synthetic shape in Fig. 6, actual sensor data
did not have sufficient resolution to correctly align the
flattened views of small parts.
Although an entire surface was flattened when a
long-sleeved shirt with a small floral print was held
at a tip of one sleeve, flattening failed when the same
item was held at a corner of the bottom line, as shown
in Fig. 8 (b). The failure occurred when the proposed
method attempted to add the flattened view of -170
degrees to the flattened view integrated up to -120 de-
grees (the right image) because of the wrong initial
estimate of the alignment. This occurred because the
corresponding lines based on the Z-angle were badly
determined because of the planarity of the overlapped
area. To avoid this, the approach to finding initial cor-
respondences should be improved rather than using
only surface points with the medium value of the Z-
VISAPP 2021 - 16th International Conference on Computer Vision Theory and Applications
916
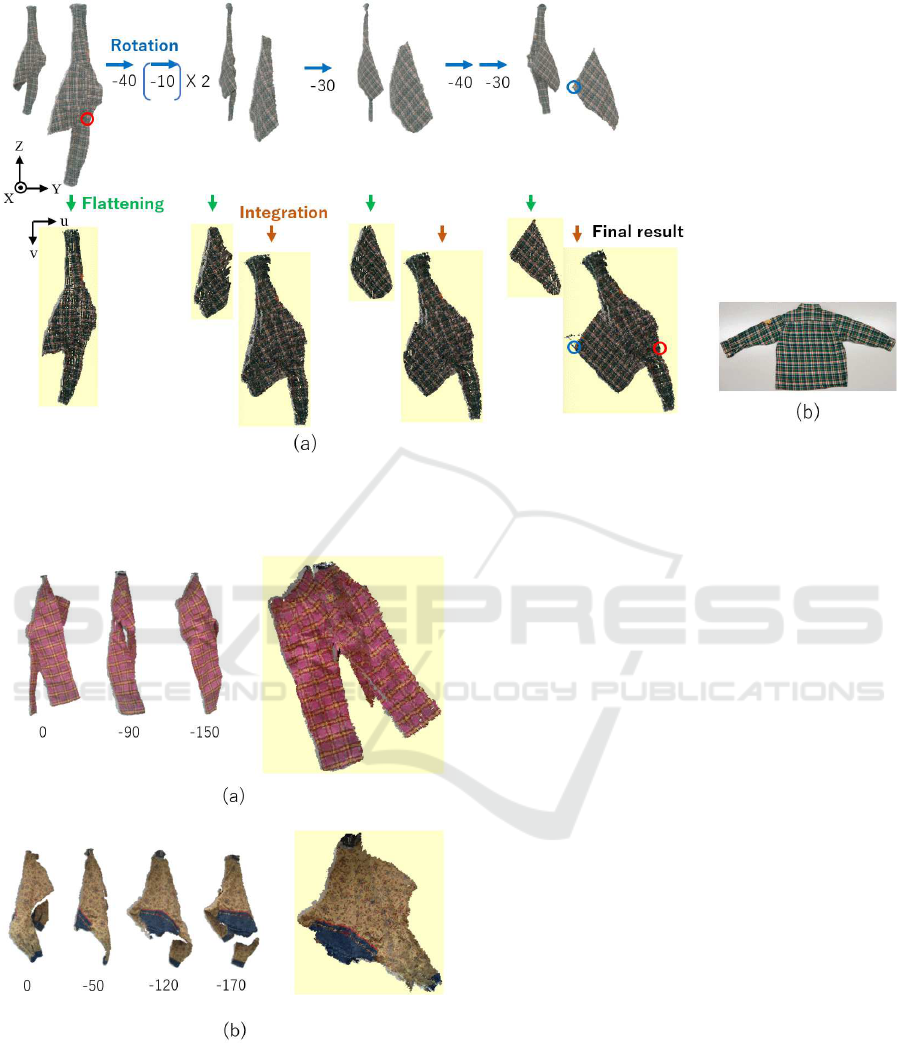
Figure 7: Experimental results using an actual long-sleeved shirt: (a) flattening processes; and (b) photo of the item physically
flattened on a table.
Figure 8: Experimental results using two more clothing
items: (a) final flattened view with 3D views used for in-
tegration (trousers with a pink checkered pattern); and (b)
final flattened view (failed) with 3D views used for integra-
tion (a long-sleeved shirt with a small floral print).
angle range of commonly observed points. However,
even though this flattened view was not an entire view,
it looked informative to assess the clothing type.
6 CONCLUSION
We proposed a method of deriving the canonical
shape of a clothing item held in the air by a robot
hand. The method is based on the virtual flattening of
a deformed clothing surface onto a 2D plane. Since
the flattened view calculated from the RGB-D data
observed from one direction is partial, flattened views
obtained from different view directions are integrated
on the 2D plane to get whole surface. The method
also automatically calculates the view direction which
efficiently add parts unseen by the time.
From the experimental results, the resultant flat-
tened shape was close to its canonical shape, which is
beneficial for recognizing the clothing item. It should
be noted that the resultant canonical shape was not as
realistic, but had the advantage that each pixel had a
link to the 3D point of the current deformed shape.
The red circle (shoulder) and blue circle (corner of
the bottom line) in Fig. 7 show examples. There-
fore, once the next action is decided based on clothing
type recognition, such as “grasp one of the shoulders
(or one of the corners of the bottom line)” for shirts,
the robot can immediately know how and to where it
should move its hand to perform the action.
A problem that remains is the automatic segmen-
tation of one surface from all the observed data; the
difficulty of the problem largely depends on the accu-
racy of the 3D sensor used.
Integration of Multiple RGB-D Data of a Deformed Clothing Item into Its Canonical Shape
917

ACKNOWLEDGEMENTS
The authors thank Dr. Y. Kawai and Mr. R. Takase
for their strong support of this research, especially 3D
data acquisition by Mr. Takase. This work was mainly
done while the first author was at National Institute of
Advanced Industrial Science and Technology (AIST).
and was supported by a Grant-in-Aid for Scientific
Research, KAKENHI (16H02885).
REFERENCES
A. Doumanoglou, A. Kargakos, T.-K. K. S. M. (2014). Au-
tonomous active recognition and unfolding of clothes
using random decision forests and probabilistic plan-
ning. In International Conference in Robotics and Au-
tomation (ICRA) 2014, pages pp.987–993.
D. Triantafyllou, I. Mariolis, A. K. S. M. and Aspragathos,
N. (2016). A geometric approach to robotic unfolding
of garments. Robotics and Autonomous Systems, Vol
75:pp. 233–243.
E. Corona, G. Alenya, A. G. and Torras, C. (2018). Active
garment recognition and target grasping point detec-
tion using deep learning. Pattern Recognition, Vol.
74:pp. 629–641.
F. Osawa, H. S. and Kamiya, Y. (2007). Unfolding of mas-
sive laundry and classification types by dual manip-
ulator. Journal of Advanced Computational Intelli-
gence and Intelligent Informatics, Vol. 11, No.5:457–
463.
Gould, D. A. D. (2004). Complete Maya Programming.
Morgan Kaufmann Pub.
Hu, J. and Kita, Y. (2015). Classification of the category
of clothing item after bringing it into limited shapes.
In Proc. of International Conference on Humanoid
Robots 2015, pages pp.588–594.
I. Mariolis, G. Peleka, A. K. and Malassiotis, S. (2015).
Pose and category recognition of highly deformable
objects using deep learning. In International Confer-
ence in Robotics and Automation (ICRA) 2015, pages
pp.655–662.
Kita, Y. and Kita, N. (2016). Virtual flattening of clothing
item held in the air. In Proc. of 23rd International
Conference on Pattern Recognition, pages pp.2771–
2777.
Intel RealSense depth camera D435
https://www.intelrealsense.com/depth-camera-d435/
on 03/21/2020
R. Grossmann, N. K. and Kimme, R. (2002). Com-
putational surface flattening:a voxel-based approach.
IEEE Trans. on Pattern Anal. and Machine Intelli.,
vol. 24, no.4.
Stria, J. and Hlavac, V. (2018). Classification of hang-
ing garments using learned features extracted from
3d point clouds. In Proc. of Int. Conf. on Intelligent
Robots and Systems (IROS 2018), pages pp.5307–
5312.
T. Kawashima, S. Yabashi, H. K. Y. (1999). Meshless
method for searching geodesic line by using moving
least squares interpolation. In Research Report on
Membrane Structures, pages pp. 1–6.
Y.Kita and N.Kita (2019). Virtual flattening of a clothing
surface by integrating geodesic distances from differ-
ent three-dimensional views. In Proc. of Int’l Conf. on
Computer Vision Theory and Applications (VISAPP
2019), pages 541–547.
Zhong, Y. and Xu, B. (2006). A physically based method
for triangulated surface flattening. Computer-Aided
Design, Vol. 38:pp. 1062–1073.
VISAPP 2021 - 16th International Conference on Computer Vision Theory and Applications
918
