
On Glyph Design for Wind Information in En-Route Air Traffic Control
Linda Pfeiffer
1 a
, Michelle Martinussen
2
and Paul Rosenthal
3 b
1
Institute of Data Science, German Aerospace Center DLR, Jena, Germany
2
Independent Researcher, Germany
3
Institute for Visual and Analytic Computing, University of Rostock, Rostock, Germany
Keywords:
Air Traffic Control, Wind Visualization, Empirical Study.
Abstract:
Information about the wind situation is crucial for en-route air traffic controllers. In this paper, we compare
several glyph designs for showing wind direction and speed by the means of an empirical study. The different
designs are based on arrows, wind barbs, and text. During the study, we are measuring response times and
accuracy. Moreover, we collect evidence of the applicability of those designs in en-route air traffic control by
qualitative feedback from air traffic controllers. Our findings suggest, that the often-used wind barbs are less
suited for assessing wind speed and direction. Instead, a combination of arrow and text should be favored.
1 INTRODUCTION
Since weather phenomena have a vast impact on air-
craft behavior, air traffic controllers have to consider
their effects in the planning of air traffic to ensure safe
and fluent traffic flows. Wind influences, for example,
the aircraft’s speed and its climb rate. Hence, this in-
formation should constantly be available to the con-
troller. Within this piece of work, we focus on the
representation of wind data for displays in en-route
air traffic control.
Air traffic controllers are facing a highly demand-
ing task that includes the consideration of a multi-
tude of information. Usually, an air traffic controller
is seeking to plan the air traffic about 20 minutes in
advance. However, constant changes in the flight sit-
uation, high traffic load, and unexpected events may
require the controllers to decide within seconds. An
intuitive and quickly perceivable representation of in-
formation is crucial in these situations. Current air
traffic control interfaces in Germany represent wind
either as a 2-dimensional field of wind barbs on a
crowded weather display or in purely textual form.
Both approaches are less suitable for fast and intuitive
assessment in time-limited situations.
We conducted initial interviews with 6 air traffic
controllers (4 male, 2 female) with a work experience
ranging from several months to 30 years. We asked
a
https://orcid.org/0000-0003-0135-6060
b
https://orcid.org/0000-0001-9409-8931
them about their weather data needs and concrete ex-
periences they have with the current weather repre-
sentations. These interviews showed that an initial
rough overview (no exact numbers) of the wind situa-
tion is needed and sufficient for the controllers. Also,
giving wind information over the whole horizontal ex-
tent of the sector they are responsible for is unnec-
essary, as in en-route sectors the wind changes only
little in the horizontal extent. Instead, wind informa-
tion is needed for several altitudes within the sector,
since the wind situation could change a lot between
altitudes. Based on these spatial requirements we sug-
gest a table-like design, representing wind speed and
direction by glyphs and/or text in several altitudes.
Note, that this design is not meant to be part of the
main radar view that shows the aircraft’s positions,
since it may interfere with tasks like conflict detec-
tion. Similar to current weather displays, it is planned
as a separate view next to the radar view.
In this paper we provide a comparison of several
glyph designs based on arrows, wind barbs, and text
that show wind direction and speed. We quantita-
tively compare them in terms of their response times
and accuracy when assessing wind speed and direc-
tion. In addition, we report on the suitability of the
approaches for the application domain, based on ex-
pert feedback on the designs.
164
Pfeiffer, L., Martinussen, M. and Rosenthal, P.
On Glyph Design for Wind Information in En-Route Air Traffic Control.
DOI: 10.5220/0010227701640172
In Proceedings of the 16th International Joint Conference on Computer Vision, Imaging and Computer Graphics Theory and Applications (VISIGRAPP 2021) - Volume 3: IVAPP, pages
164-172
ISBN: 978-989-758-488-6
Copyright
c
2021 by SCITEPRESS – Science and Technology Publications, Lda. All rights reserved

2 RELATED WORK
Techniques for visualizing wind are mainly subject in
the domain of flow and vector field visualization (Bu-
jack and Middel, 2020; Johnson and Hansen, 2004;
Laramee et al., 2004; Post et al., 2003). Within
this domain, there are three groups of common ap-
proaches: glyphs (Borgo et al., 2013), showing mag-
nitude and direction of the flow, geometric struc-
tures (McLoughlin et al., 2010; Reina et al., 2019),
like streamlines or path lines, and techniques that blur
textures with the flow (e.g. Line Integral Convolution
(LIC) (Cabral and Leedom, 1993)).
As we are not interested in representing a whole
vector field and all of its details, we focus on the
glyph-based designs that better reflect single data
points. For representing the flow’s direction and mag-
nitude, classical designs like arrows or wind barbs,
often used in meteorology, exist, but also more ad-
vanced designs that try to encode further information.
Examples are the Flow Radar Glyphs (Hlawatsch
et al., 2011) and the pathline glyphs (Hlawatsch et al.,
2014) by Hlawatsch et al., that include information
about time dependent dynamics, as well as the glyph
design suggested by Wittenbrink et al. (Wittenbrink
et al., 1996), that includes uncertainty information.
There is also a bunch of work assessing percep-
tual effects of and comparing classical glyph designs
to other vector field representations by the means of
an empirical study. Their findings suggest that arrows
on a regular grid induce larger errors on an advection
task than various streamlines, streamlets, and LIC ap-
proaches (Laidlaw et al., 2005; Pineo and Ware, 2010;
Ho et al., 2015). In addition, they are less accurate and
sometimes even slower when identifying and classi-
fying critical points in a flow field (Laidlaw et al.,
2005; Ho et al., 2015). Otherwise, arrows encoding
the field’s magnitude by length are better suited than
streamlets, streamlines, and LIC for tasks where a vi-
sual attraction to regions with high speed is needed
(Ho et al., 2015). However, these tasks are specific to
the visualization of a whole flow field, while we are
more interested in the assessment of orientation and
magnitude at a specific point.
One step into the direction of this aim was done
by Martin et al. (Martin et al., 2008). They found, that
when reading wind barbs and estimating these over an
area people usually underestimated wind speed and
had a counter-clockwise bias in direction estimation.
The task of estimating wind speed and direction at a
specific point in a flow field was investigated in two
studies by Ware, Pilar, and Plumlee. They found that
streamlines with arrowheads and curved wind barbs
are more accurate than classical wind barbs in esti-
mating wind direction, while they did not find any dif-
ference in speed assessment (Pilar and Ware, 2013).
The other study compared wind barbs with an arrow-
like design encoding magnitude by relative size and
traces/pathlets. They did not find any difference in the
direction assessment. However, they found that path-
lets outperformed wind barbs, which outperformed
the arrow-like design in speed estimation (Ware and
Plumlee, 2013).
Based on theories in neuroscience, Ware derived
recommendations on the visualization of flow fields
(Ware, 2008). He recommended using flow parallel
streamlines instead of arrows for representing orien-
tation and suggested several approaches for the design
of asymmetry in order to perceive the direction’s sign.
The application of these results can only partially
be transferred to our designated scenario. For one
thing, flow parallel methods, like streamlines, are not
applicable in a scenario with only a few data points
among one spatial dimension and the comparison of
glyph based designs is restricted to wind barbs and
arrowheads encoding speed by relative size. For an-
other, we expect the assessment of wind speed and
direction at a certain point to be less complex in our
scenario, as participants only need to interpolate be-
tween two glyphs instead of four glyphs in a whole
vector field.
3 WIND VISUALIZATION
DESIGNS TO BE COMPARED
As mentioned above, en-route air traffic controllers
need only one wind data point per sector in the hor-
izontal extent but several data points in the vertical
extent. These data points should be regularly sampled
over the whole vertical extent of a flight sector (e.g.,
every 50th flight level, that represents 5,000 feet in
altitude) having an overlap of at least 30 flight lev-
els to the sectors above and beneath. Using this sam-
pling rate, 6 data points are enough to cover an aver-
age en-route sector in Germany. We decided to en-
code altitude by position on the y-axis, since this best
supports the usual mental model of altitude. This de-
cision leads to a table-like design positioning glyphs
and/or text, encoding wind magnitude and direction,
equidistantly on top of each other.
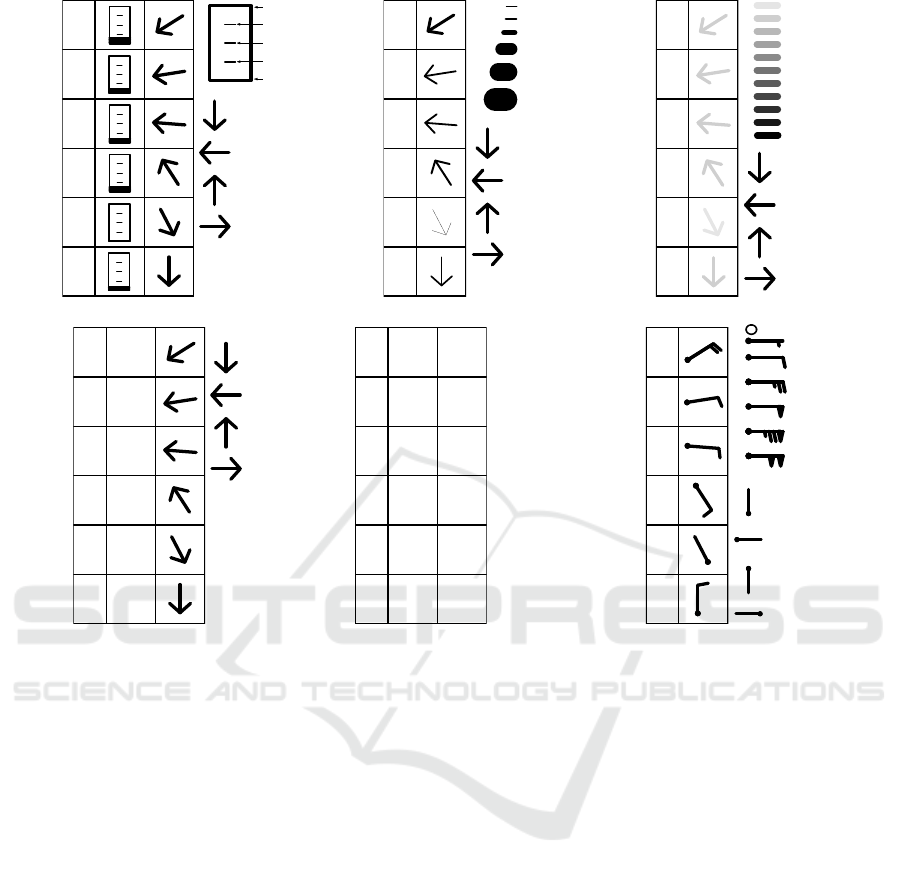
As wind direction and speed should be easily as-
sessable , we compare several data point representa-
tions (see Figure 1) by means of an empirical study.
Encoding wind direction by slope best supports spa-
tial reasoning. Thus, all glyphs encode wind di-
rection by slope, leaving several options for encod-
ing wind speed. Length is, according to Mackinlays
On Glyph Design for Wind Information in En-Route Air Traffic Control
165
50
100
150
200
250
300
75kn
50kn
25kn
100kn
0kn
0°
from N to S
90°
from E to W
180°
from S to N
270°
from W to E
(a) ProgressBarArrow
50
100
150
200
250
300
5kn
25kn
10kn
50kn
75kn
100kn
0°
from N to S
90°
from E to W
180°
from S to N
270°
from W to E
(b) WidthArrow
50
100
150
200
250
300
0-9kn
10-19kn
20-29kn
30-39kn
40-49kn
50-59kn
60-69kn
70-79kn
80-89kn
90-99kn
>=100kn
0°
from N to S
90°
from E to W
180°
from S to N
270°
from W to E
(c) ValueArrow
50
100
150
200
250
300
18kn
11kn
11kn
12kn
1kn
10kn
0°
from N to S
90°
from E to W
180°
from S to N
270°
from W to E
(d) TextArrow
50
100
150
200
250
300
18kn
11kn
11kn
12kn
1kn
10kn
55°
80°
95°
150°
335°
0°
0° = from N to S
90° = from E to W
180° = from S to N
270° = from W to E
(e) TextText
50
100
150
200
250
300
0kn
5kn
10kn
25kn
50kn
75kn
100kn
0°
from N to S
90°
from E to W
180°
from S to N
270°
from W to E
(f) WindBarbs
Figure 1: Illustration of the wind visualizations, compared in our study. The first column represents the altitude followed by
wind speed and direction.
ranking of visual variables, after position most effec-
tive for encoding quantitative data (Mackinlay, 1986).
Hence, we included a design using a progress bar
(ProgressBarArrow) and a design encoding speed
by line width (WidthArrow). Color value is less effec-
tive (Mackinlay, 1986), but it seemed natural to com-
bine color value with an arrow without affecting its
shape, so we included the design ValueArrow. Due
to comparison to the representations used in current
interfaces we also included textual representations as
well as a classical wind barb design.
4 USER STUDY
In a context with limited time for decision making,
such as air traffic control, the fast and accurate ex-
traction of information is of major importance. Thus,
we set up an online experiment in order to judge the
intuitive assessment of wind, using the suggested vi-
sualization designs in terms of response time and ac-
curacy. This quantitative part of the study is comple-
mented by qualitative feedback from air traffic con-
trollers, to get a deeper understanding of the applica-
bility of the designs in practice.
4.1 Methods
Participants. We decided to conduct the quanti-
tative part with both, novices and experts and the
qualitative part with expert users only. On the one
hand, this allows us to measure the intuitive assess-
ment of the glyphs and, thus, prevents any bias to-
wards one option because of extensive training. On
the other hand, despite restricted access to air traf-
fic controllers, we get an impression on the specific
characteristics of the application domain. 54 novices
(mainly students) participated in the experiment (16
female, 37 male, 1 unknown). Their age ranged be-
tween 18 and 63 years with an average of 28 years.
Furthermore 9 experts aged between 22 and 48 years
with an average of 31 years (2 female and 7 male)
completed the study. 8 of the experts were working
as air traffic controllers in Germany and 1 was an air
traffic control student. Their work experience in en-
route sectors ranged from 1 year to 26 years with an
IVAPP 2021 - 12th International Conference on Information Visualization Theory and Applications
166
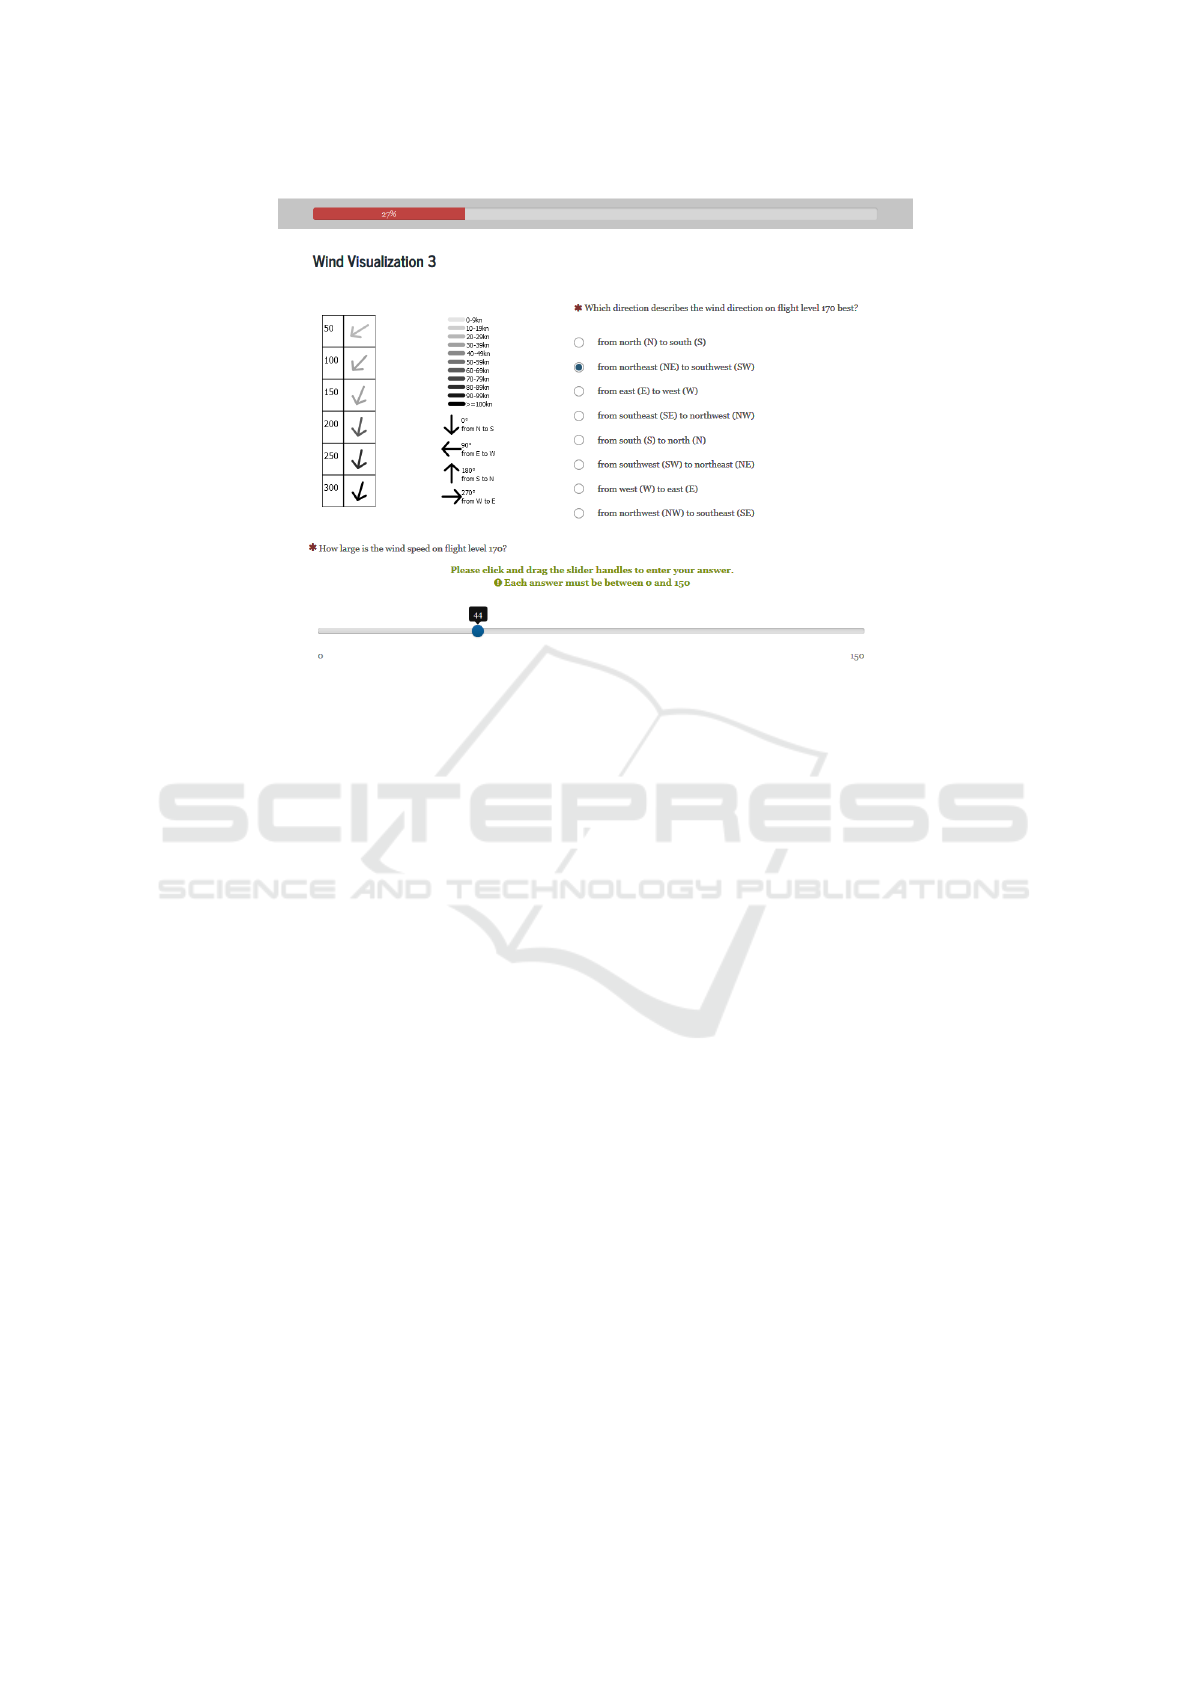
Figure 2: Screenshot of the interface presented to the participants.
average of 10 years. Except for 6 persons, all partic-
ipants claimed to have normal or corrected to normal
vision. One person had dyschromatopsia. The partic-
ipants did not receive any reward.
Materials. We planned the experiment as an online
experiment, which allowed us to have more partici-
pants in a short time period, but hindered us from con-
trolling hardware-related displaying issues, like dif-
ferences in color.
We prepared six scenarios based on weather
datasets from Nancy, France. They were obtained
from the open-source access of the National Oceanic
and Atmospheric Administration of the U.S. Depart-
ment of Commerce (NOAA Datasets, 2016). In order
to map the values on every 50th flight level of a sec-
tor ranging from the 105th to the 256th flight level,
a linear interpolation of the original data points was
computed. From each of the scenarios, we gener-
ated one stimulus with each of the six visualizations.
As the experiment followed a within-subjects design
approach, each participant saw each of the scenar-
ios in another visualization, while the mapping be-
tween scenario and visualization type was randomly
assigned.
Procedure. After a welcome text and the partici-
pant information sheet, the experiment started by col-
lecting some demographic data (gender, age, and vi-
sion) and information about the professional experi-
ence in air traffic control (e.g. years of experience,
country of employment, and whether the participant
is mainly operating in en-route sectors).
In order to get familiar with the upcoming task,
a training example was presented to the participants.
Then, they were asked to judge the wind direction
and wind speed at a certain altitude (See Figure 2 for
a screenshot). We advised participants to answer as
fast as possible. The altitude in question was usu-
ally located between two of the displayed data points.
Participants solved this task once with each visualiza-
tion type in a randomized order. Per participant, the
scenarios were randomly assigned to the visualization
type, such that each scenario was seen once by the
participant. Each visualization type was briefly intro-
duced to the participants by the explanations shown
in Figure 1, before answering the questions regarding
this visualization type.
We measured the error in speed judgments in
knots, the error in direction judgments on an eight-
point wind rose, as well as response times in sec-
onds. Expert users finished by answering a post-
questionnaire about what they liked and disliked
about the designs.
Quantitative Analysis. First, we transformed the
individual answers to an comparable error measure.
For wind speed, we subtracted the correct value be-
longing to the corresponding scenario from the esti-
mated value. Negative values, hence, indicate an un-
derestimation, positive values an overestimation. For
calculating the absolute wind direction error, the dis-
On Glyph Design for Wind Information in En-Route Air Traffic Control
167
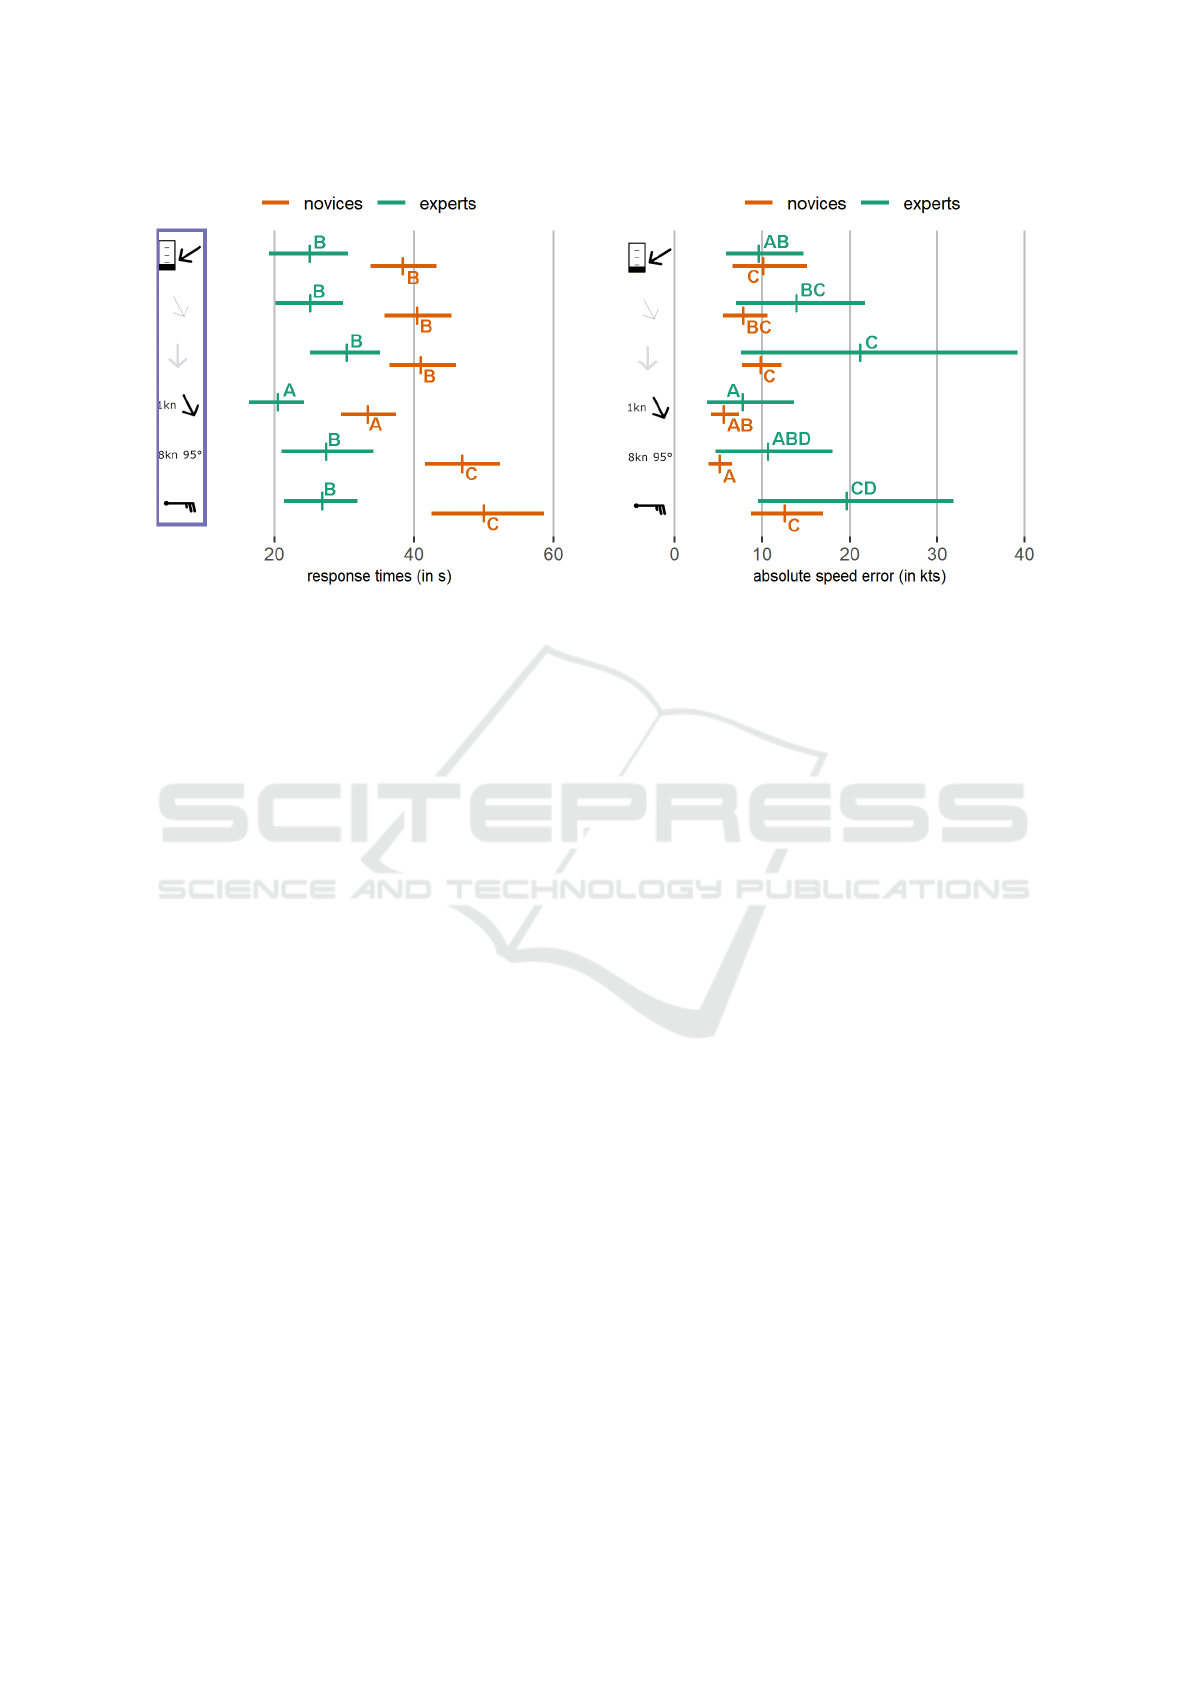
Figure 3: Average response time for novices (orange) as
well as experts (green), visualized with the corresponding
95% bootstrapped confidence intervals for each visualiza-
tion design. Letters denote significance groups. That is, two
conditions sharing the same letter do not differ significantly.
Designs enclosed by a violet border show a significant dif-
ference between novices and experts.
tance to the correct answer on a 8-point wind rose was
calculated. Hence, the wind direction error is a value
between 0 and 4. For the non-absolute direction er-
ror positive values indicate a clockwise bias and neg-
ative values indicate a counter-clockwise error, while
an 180
◦
error was set to 0.
In order to compare the visualization designs ac-
cording to the errors in estimating wind speed and di-
rection as well as response time, we computed for
each design 95% confidence intervals, respectively.
Since the data did not reflect the assumption of nor-
mality, we decided to use a bootstrapping approach
instead of computing conventional confidence inter-
vals. We drew 10,000 bootstrap samples, computed
their means, and computed the 95% confidence inter-
vals using the percentile method (Efron and Tibshi-
rani, 1986). Accordingly, we calculated 95% confi-
dence intervals for the paired differences between the
designs for inferential analysis. If one of the latter
confidence intervals does not contain the value zero,
their difference can be considered as statistically sig-
nificant at a significance level of α = 0.05. We did
these computations once for the group of novices and
once for the group of experts. Furthermore, we cal-
culated 95% confidence intervals for the differences
between experts and novices.
Qualitative Analysis. For analyzing the qualitative
feedback for each design, we encoded and classified
the data using a bottom up coding approach. In a sec-
Figure 4: Average absolute speed error for novices (orange)
as well as experts (green) visualized with the corresponding
95% bootstrapped confidence intervals for each visualiza-
tion design. Letters denote significance groups. That is, two
conditions sharing the same letter do not differ significantly.
ond cycle, we classified whether each comment was
positive about the design in question or negative and
counted those.
4.2 Quantitative Part: Results
The point estimates, their corresponding 95% boot-
strapped confidence intervals, as well as significance
groups (significant differences only exist between
those groups) are illustrated in Figures 3, 4, and 5.
The paired differences between the designs are shown
in the appendix.
Response Time. Most obvious, air traffic con-
trollers performed with a mean of 25.83 seconds
about 15.67 seconds faster than novices. The differ-
ences between the expert group and the novices were
significant for each design. Both groups performed
significantly fastest ((α < 0.05) with the TextArrow
design (significance group A). In contrast to the ex-
perts, there was a third significance group (C) con-
sisting of the WindBarbs and TextText designs that
showed significantly slower response times than any
other design for novices.
Speed Error. Concerning the absolute speed error,
the resulting significance groups are not as clearly
separated as for the response times. Nevertheless,
novices were significantly more accurate using one
of the designs encoding speed as text than they were
using the designs ProgressBarArrow, ValueArrow,
IVAPP 2021 - 12th International Conference on Information Visualization Theory and Applications
168
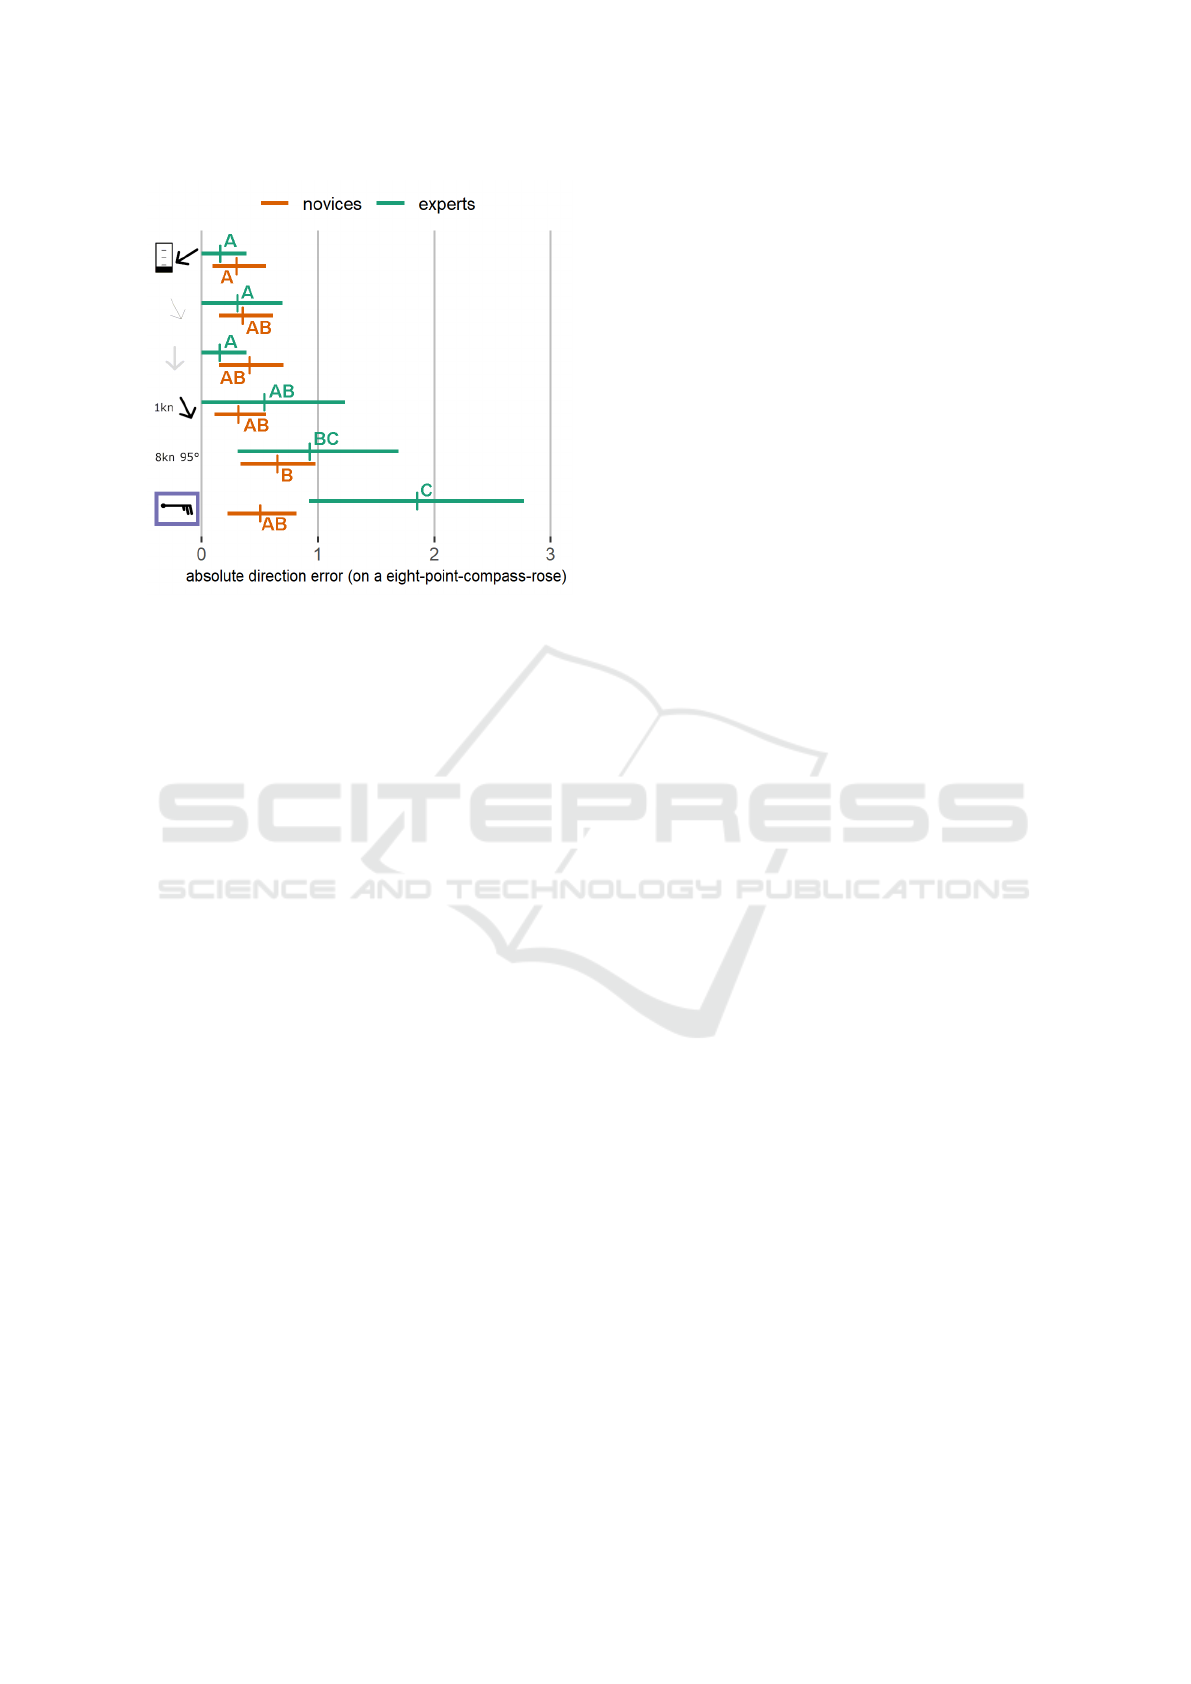
Figure 5: Average direction error for novices (orange) as
well as experts (green) visualized with the corresponding
95% bootstrapped confidence intervals for each visualiza-
tion design. Letters denote significance groups. That is, two
conditions sharing the same letter do not differ significantly.
Designs enclosed by a violet border show a significant dif-
ference between novices and experts.
or WindBarbs. Within the experts group, this ten-
dency is less clear. Air traffic controllers, however,
showed additionally significant differences between
the ProgressBarArrow design and the WindBarbs
and ValueArrow designs. There were no significant
differences between air traffic controllers and novices.
Considering the non-absolute values of the speed
error, the confidence intervals of the design TextText
showed a systematic overestimation of the val-
ues in both groups (Novices: [1.2830, 4.6981],
Experts: [3.3846, 17.3850]). Additionally, the
designs ProgressBarArrow and WindBarbs were
overestimated by the novices ([0.6159, 10.4810],
[4.0566, 13.3770]).
Direction Error. Regarding the direction error, we
barely found significant differences for novices. Only
with ProgressBarArrow participants seemed to per-
form more accurate than with TextText. Although
the results are not significant, it seems that partic-
ipants tend to be more accurate with an arrow de-
sign than with TextText or WindBarbs. This ten-
dency is confirmed by the results of the experts group.
WindBarbs led to significantly less accurate answers
than the arrow-based designs did. Except for the
TextArrow design, there were also significant differ-
ences between the TextText design and the arrow-
based designs. Surprisingly, we found only one sig-
nificant difference between air traffic controllers and
novices. Even though air traffic controllers should be
trained in reading wind barbs, they performed signif-
icantly less accurate with the WindBarbs design than
novices did.
Considering the non-absolute direction error,
we only found a slight but significant bias for
the ValueArrow design in the novices group.
Novices tended to have a slight clockwise bias
([0.0370, 0.2037]). Beyond this, we didn’t find any
further biases for the assessment of direction.
4.3 Quantitative Part: Discussion
Within the application domain, a fast and accurate as-
sessment of the current wind speed and direction on
each flight level is necessary. Our results show that
air traffic controllers are significantly faster in making
their decisions at a similar accuracy level than novices
are. The, nevertheless, quite long response times be-
tween 20 and 30 seconds on average are no reason
to worry, since they can be explained by the time
needed for entering the responses and the unfamil-
iar representation (remember that participants judged
wind speed and direction only once for each visual-
ization type).
Our results for speed error suggest using a design
representing speed as text. However, this result has
to be seen within the realm of the limitations of this
study. One limitation may be the measuring method.
We asked participants to report speed in knots. There
is thus a natural favor for the textual representations,
as they directly provide this value, so that the partic-
ipants did not have to transfer the representation and
the only error that remains arises from interpolation
between levels. Nevertheless, the results for the ex-
perts group do also suggest rather using a progress
bar for speed representation than using wind barbs or
an encoding via value, which perfectly aligns with
Mackinlays ranking of visual variables (Mackinlay,
1986).
The results in direction error suggest using an ar-
row based design in the application domain for repre-
senting direction instead of text or wind barbs. Espe-
cially air traffic controllers were less accurate with the
latter designs than they were with most of the arrow-
based designs.
In accordance with the before-mentioned encod-
ings, the response times clearly suggest using the
TextArrow design. However, these results have to
be seen in the light of the same shortcomings regard-
ing the measurement method. Despite the choice of
the best suitable glyph design for representing wind
direction and speed in en-route air traffic control, our
results suggest that the currently used designs are a
fairly bad choice. Novices are significantly slower
On Glyph Design for Wind Information in En-Route Air Traffic Control
169

when using purely textual representations or wind
barbs. Using more intuitive designs would especially
help air traffic control students. Even more critical is
the finding that actual air traffic controllers are clearly
less accurate when using wind barbs.
When comparing our results to the related work,
we were not able to confirm the findings by Martin et
al. (Martin et al., 2008). In contrast to their finding
that wind barbs lead to a systematic underestimation
of wind speed when assessed over an area, we found
a systematic overestimation of wind speed when in-
terpolated between two wind barbs. Neither could we
find any counterclockwise bias when assessing wind
direction. Also, a general conclusion whether arrows
or wind barbs are generally better suited for speed and
direction assessment is not feasible. While Ware and
Plumlee showed that arrows, encoding speed by size,
performed worse than wind barbs in speed assessment
(Ware and Plumlee, 2013), we did not find any sig-
nificant difference between wind barbs and the arrow
designs encoding speed by width or value. And while
our results suggest, either by being slower or by less
accurate results, that wind barbs are less suited for
representing direction than arrows are, the authors did
not find any significant differences between their de-
signs in direction error.
4.4 Qualitative Part: Results and
Discussion
Encoding Direction. For the different encodings of
wind direction, there were most positive comments
(28) about representing wind direction by an arrow.
Arrows were perceived by the controllers as easy
and fast to read, intuitive, and as a clear encoding.
While for most of the participants the arrow’s ac-
curacy was good, two controllers still had concerns
about it. These controllers, however, did enjoy the
good readability and quick overview provided by ar-
rows. Adding some pop-up information, showing the
exact numbers when focusing a certain arrow, may
solve the issues about accuracy. Encoding wind di-
rection as text was mainly enjoyed due to the accu-
racy, but was criticized due to the slow reading speed.
Most questionable was the encoding of wind direc-
tion with wind barbs as at least one participant was
confused about the direction and four more found the
direction hard to determine. The issues with reading
direction from wind barbs are also reflected by the air
traffic controllers accuracy in the quantitative part of
the study.
Encoding Speed. In contrast to our expectation,
there were only a few positive comments on the sev-
eral graphical encodings of speed. Encoding speed as
width or value of an arrow was perceived by two con-
trollers as suitable for a good but imprecise overview.
Apart from the lack of accuracy, these designs were
criticized for not being intuitive, readable, and for
their ’ugly’ appearance. Similarly, the wind barbs’
speed encoding was perceived by one controller as
suitable for a fast overview, but, apart from this, it
was perceived as slow to read (because of count-
ing), not intuitive, and awkward. Even though the
ProgressBarArrow design was more accurate than
the ValueArrow and WindBarbs designs, air traffic
controllers did not find any positive words about this
design. Similarly, as the aforementioned designs, it
was criticized for its lack of accuracy and for neither
being intuitive nor easily readable. In contrast to the
other encodings for wind speed, text was liked by 7
controllers due to its accuracy and clarity. Even if the
quantitative results may be in favor of the text based
encoding due to the measuring method, it is still the
most liked encoding for speed.
Further Design Issues. Two controllers indicated
to prefer designs combining direction and speed in
one symbol, which reduces the number of objects on
the screen. Unfortunately, these designs were per-
ceived as hard to read, even by the aforementioned
two controllers. There were some comments for im-
provement about the designs, showing wind direction
and speed in separated glyphs, since in aviation the
usual way to declare wind is to show the direction in
degrees first, followed by the speed. Thus, changing
the order of the columns may increase the readability
for air traffic controllers. Additionally, the ordering
of the rows should be inverted to better represent the
increasing altitude from the ground.
Summary. Similar to the quantitative results, the
qualitative results suggest using a combination, en-
coding direction by an arrow and speed by a number,
while wind barbs seem to be less suited for the ap-
plication domain. When judging a glyph design, air
traffic controllers are highly concerned about the ac-
curacy a design offers but prefer also a design pro-
viding a quick overview. For better applicability in
the domain, columns and rows of the table should be
ordered such that speed representation follows direc-
tion and that flight levels follow an ascending order-
ing from the ground to the top.
IVAPP 2021 - 12th International Conference on Information Visualization Theory and Applications
170

5 CONCLUSION
We compared the assessment of wind direction and
speed using several glyph and text-based represen-
tations by means of an empirical experiment as
well as qualitative feedback by air traffic controllers.
Quantitative and qualitative results, both suggest that
WindBarbs are less suited for a quick but fairly ac-
curate overview of the wind data. In addition, both
results highlight a design, encoding speed by text and
direction by an arrow (TextArrow) for the applica-
tion in en-route air traffic control. However, the exact
numbers should be accessible on demand, as these are
needed for the communication to pilots.
ACKNOWLEDGEMENTS
This work was partly done at the former Visual Com-
puting Laboratory at Chemnitz University of Technol-
ogy, Germany. We thank all of our study participants.
REFERENCES
Borgo, R., Kehrer, J., Chung, D. H. S., Maguire, E.,
Laramee, R. S., Hauser, H., Ward, M., and Chen,
M. (2013). Glyph-based Visualization: Foundations,
Design Guidelines, Techniques and Applications. In
Sbert, M. and Szirmay-Kalos, L., editors, Eurograph-
ics 2013 - State of the Art Reports. The Eurographics
Association.
Bujack, R. and Middel, A. (2020). State of the art in flow
visualization in the environmental sciences. Environ-
mental Earth Sciences, 79(2).
Cabral, B. and Leedom, L. C. (1993). Imaging vector fields
using line integral convolution. In Proceedings of the
20th Annual Conference on Computer Graphics and
Interactive Techniques, SIGGRAPH ’93, pages 263—
-270, New York, NY, USA. Association for Comput-
ing Machinery.
Efron, B. and Tibshirani, R. (1986). Bootstrap methods
for standard errors, confidence intervals, and other
measures of statistical accuracy. Statistical Science,
1(1):54–75.
Hlawatsch, M., Leube, P., Nowak, W., and Weiskopf, D.
(2011). Flow Radar Glyphs—Static Visualization
of Unsteady Flow with Uncertainty. IEEE Trans-
actions on Visualization and Computer Graphics,
17(12):1949–1958.
Hlawatsch, M., Sadlo, F., Jang, H., and Weiskopf, D.
(2014). Pathline glyphs: Pathline glyphs. Computer
Graphics Forum, 33(2):497–506.
Ho, H.-Y., Yeh, I.-C., Lai, Y.-C., Lin, W.-C., and Cherng,
F.-Y. (2015). Evaluating 2D Flow Visualization Using
Eye Tracking. Computer Graphics Forum, 34(3):501–
510.
Johnson, C. and Hansen, C. (2004). Visualization Hand-
book. Academic Press, Inc., USA.
Laidlaw, D., Kirby, R., Jackson, C., Davidson, J., Miller,
T., da Silva, M., Warren, W., and Tarr, M. (2005).
Comparing 2D Vector Field Visualization Methods: A
User Study. IEEE Transactions on Visualization and
Computer Graphics, 11(01):59–70.
Laramee, R. S., Hauser, H., Doleisch, H., Vrolijk, B., Post,
F. H., and Weiskopf, D. (2004). The state of the art
in flow visualization: Dense and texture-based tech-
niques. Computer Graphics Forum, 23(2):203–221.
Mackinlay, J. (1986). Automating the design of graphical
presentations of relational information. ACM Trans.
Graph., 5(2):110–141.
Martin, J. P., Swan, J. E., Moorhead, R. J., Liu, Z., and Cai,
S. (2008). Results of a User Study on 2D Hurricane
Visualization. Computer Graphics Forum, 27(3):991–
998.
McLoughlin, T., Laramee, R. S., Peikert, R., Post, F. H., and
Chen, M. (2010). Over two decades of integration-
based, geometric flow visualization. Computer
Graphics Forum, 29(6):1807–1829.
NOAA Datasets (2016). Datasets by the US National
Oceanic and Atmospheric Administration (NOAA).
url: http://www1.ncdc.noaa.gov/pub/data/igra/, Last
accessed: September 11, 2016.
Pilar, D. H. F. and Ware, C. (2013). Representing Flow
Patterns by Using Streamlines with Glyphs. IEEE
Transactions on Visualization and Computer Graph-
ics, 19(8):1331–1341.
Pineo, D. and Ware, C. (2010). Neural modeling of flow
rendering effectiveness. ACM Transactions on Ap-
plied Perception, 7(3):1–15.
Post, F. H., Vrolijk, B., Hauser, H., Laramee, R. S., and
Doleisch, H. (2003). The state of the art in flow visu-
alisation: Feature extraction and tracking. Computer
Graphics Forum, 22(4):775–792.
Reina, G., Gralka, P., and Ertl, T. (2019). A decade
of particle-based scientific visualization. European
Physical Journal Special Topics, 227(14):1705–1723.
Ware, C. (2008). Toward a Perceptual Theory of Flow Visu-
alization. IEEE Computer Graphics and Applications,
28(2):6–11.
Ware, C. and Plumlee, M. D. (2013). Designing a bet-
ter weather display. Information Visualization, 12(3-
4):221–239.
Wittenbrink, C., Pang, A., and Lodha, S. (Sept./1996).
Glyphs for visualizing uncertainty in vector fields.
IEEE Transactions on Visualization and Computer
Graphics, 2(3):266–279.
On Glyph Design for Wind Information in En-Route Air Traffic Control
171
APPENDIX
Table 1: 95% bootstrapped confidence intervals based on 10,000 bootstrap samples for the differences between the designs
based on novices data. Confidence intervals not containing the value 0 can be interpreted as significant differences at an
significance level α = 0.05.
Design A Design B Response Times Abs Speed Error Abs Direction Error
Lower Upper Lower Upper Lower Upper
DesignA DesignB LowerRT UpperRT LowerSE UpperSE LowerDE UpperDE
ProgressBarArrow WidthArrow -6.2465 2.0909 -2.2495 7.3264 -0.3704 0.2593
ProgressBarArrow ValueArrow -5.9669 0.8138 -2.8846 3.7115 -0.4630 0.2407
ProgressBarArrow TextArrow 1.0194 9.0271 1.2500 8.4038 -0.2963 0.2773
ProgressBarArrow TextText -13.3200 -4.4443 1.6923 9.5385 -0.6667 -0.0370
ProgressBarArrow WindBarbs -17.2430 -6.5378 -8.4231 3.6154 -0.61111 0.1852
WidthArrow ValueArrow -4.8371 3.5065 -5.3585 1.6792 -0.4074 0.2963
WidthArrow TextArrow 3.1122 11.1290 -0.6226 5.4717 -0.2593 0.3148
WidthArrow TextText -11.1120 -2.1104 0.3208 5.3396 -0.6852 0.0741
WidthArrow WindBarbs -15.6310 -3.7218 -10.0940 0.5849 -0.5185 0.2037
ValueArrow TextArrow 3.8624 11.4510 2.1698 6.3774 -0.2037 0.4074
ValueArrow TextText -10.4100 -1.5302 2.2453 7.2075 -0.6296 0.1296
ValueArrow WindBarbs -15.9550 -3.1163 -7.3019 1.5472 -0.4259 0.2593
TextArrow TextText -17.6730 -9.6813 -1.3962 2.2264 -0.7222 0.0370
TextArrow WindBarbs -23.7140 -10.7690 -11.4520 -2.8118 -0.4629 0.0921
TextText WindBarbs -9.0652 2.4856 -11.8300 -3.3774 -0.2778 0.5926
Table 2: 95% bootstrapped confidence intervals based on 10,000 bootstrap samples for the differences between the designs
based on experts data. Confidence intervals not containing the value 0 can be interpreted as significant differences at an
significance level α = 0.05.
Design A Design B Response Times Abs Speed Error Abs Direction Error
Lower Upper Lower Upper Lower Upper
DesignA DesignB LowerRT UpperRT LowerSE UpperSE LowerDE UpperDE
ProgressBarArrow WidthArrow -4.2253 3.7315 -11.3080 2.3846 -0.4615 0.1539
ProgressBarArrow ValueArrow -11.9680 0.9354 -28.3850 0.0769 -0.2308 0.2308
ProgressBarArrow TextArrow 0.5324 8.6446 -2.1538 5.7692 -1.0000 0.0000
ProgressBarArrow TextText -7.6269 2.3646 -9.4615 6.0000 -1.3846 -0.2308
ProgressBarArrow WindBarbs -6.0369 2.7438 -19.3080 -1.3077 -2.6154 -0.8462
WidthArrow ValueArrow -12.3090 0.8669 -23.2310 6.3058 -0.1539 0.4615
WidthArrow TextArrow 0.5039 8.5784 0.3846 12.3850 -0.8462 0.3077
WidthArrow TextText -9.2322 3.7253 -4.3077 10.1540 -1.3846 0.0000
WidthArrow WindBarbs -5.7967 2.3331 -15.5370 4.5385 -2.3846 -0.6923
ValueArrow TextArrow 5.2793 1.5269 1.7692 28.7690 -1.0769 0.1539
ValueArrow TextText -2.5392 9.3899 0.3846 22.8460 -1.4615 -0.2308
ValueArrow WindBarbs -2.7183 9.7161 -11.2310 16.7690 -2.6923 -0.7692
TextArrow TextText -11.4740 -2.6846 -9.5385 3.0000 -1.0769 0.3846
TextArrow WindBarbs -11.7590 -0.5194 -20.6150 -3.2308 -2.1538 -0.5385
TextText WindBarbs -5.3284 8.3773 -21.5380 2.1538 -1.9231 0.0769
Table 3: 95% bootstrapped confidence intervals based on 10,000 bootstrap samples for the differences between experts and
novices. Confidence intervals not containing the value 0 can be interpreted as significant differences at an significance level
α = 0.05.
Difference Response Time Absolute Speed Error Absolute Direction Error
Lower Upper Lower Upper Lower Upper
ProgressBarArrow 5.9165 20.7683 -5.7688 6.8269 -0.1595 0.4444
WidthArrow 8.6454 22.4990 -14.1160 1.1726 -0.3746 0.4259
ValueArrow 3.8039 17.8624 -29.2452 2.4469 -0.0826 0.6083
TextArrow 7.3457 18.4133 -8.2467 2.2322 -0.9501 0.3490
TextText 11.0097 28.0319 -13.1233 0.6240 -1.0883 0.4401
WindBarbs 14.1151 33.1170 -19.9535 4.1292 -2.3063 -0.3761
IVAPP 2021 - 12th International Conference on Information Visualization Theory and Applications
172
