
Movement Entropy in a Gardening Design Task as a Diagnostic
Marker for Mental Disorders: Results of a Pilot Study
Sebastian Unger
1
, Sebastian Appelbaum
2
, Thomas Ostermann
2
and Christina Niedermann
2,3
1
Didactics and Educational Research in Health Science, Witten/Herdecke University, Germany
2
Methods and Statistics in Psychology, Faculty of Health, Witten/Herdecke University, Germany
3
Fine Arts, University of Applied Sciences and Arts Ottersberg, Germany
Keywords: Mental Health, Garden Design, Movement Analysis, Heatmap Analysis, Entropy, Homography.
Abstract: Movement, actions, and intentions are important psychological skills in human behavior. Studies have shown
correlations between movement activity and a variety of mental disorders. In this context, planning and
designing of gardens and outdoor spaces as an intentional activity might play an important role as a marker
for mental health. Thus, in this study, 16 subjects (8 female) aged between 19 and 60 were asked to do a
gardening task in an experimentally constructed environment while their movement activity was recorded
with a camera from a fixed viewpoint. Movement heatmaps and entropy then was calculated and correlated
with mental state measured via the Global Severity Index (GSI) of the Brief Symptom Inventory (BSI-18)
questionnaire. After finding an optimal grid size of the heatmaps, we were able to find a moderate negative
correlation of r = -0.463 between these quantities in an overall of both genders, explaining 21.4 % of variance.
After considering the gender of the test group, a noticeable gender effect could be revealed. We found a
significant interaction effect of entropy with gender meaning that a lower movement entropy in a gardening
task correlates with a higher mental distress for men, but lower for women. Multivariate regression found that
this model explained 77.44 % of variance (R = 0.88). Despite of these promising results, further investigations
in this area should overcome some limitations in this pilot study in the field of position tracking and movement
feature extraction.
1 INTRODUCTION
Movement, actions, and intentions are important
psychological skills in human behavior. A recent
systematic review of the relationships between motor
proficiency physical abilities and academic
performance in mathematics and reading tasks
showed that motor proficiency was able to predict the
academic performances of children and adolescents,
in particular in the early years of school (Macdonald
et al., 2018). Other reviews from the field of clinical
psychology showed correlations between
pathological movement features and a variety of
mental disorders. A recent review of Rohani et al.
(2018) found significant correlations between
behavioral features and depressive mood symptoms
in adults, while the review of Zhu et al. (2019) found
that physical activity of children and adolescents is
associated with a reduced risk of experiencing
anxiety. Other studies in patients suffering from
dementia reported in (Collier et al., 2018) suggest that
human movement analysis can be used as a diagnostic
marker for early dementia. In this respect, the
intentional meaning of movement seems to play an
important role. According to (Clark et al., 2015; p.1)
mindful movement “may improve the functional
quality of rehearsed procedures, cultivating a
transferrable skill of attention”.
Hence and in agreement with the findings of
(O’Brien et al., 2017), continuous and everyday
monitoring of activity and motion could be a
promising real-world biomarker for early detection of
mental disorders.
With respect to the definition of “real world”,
studies in elderly populations found that the planning
and designing of gardens and outdoor spaces was
attributed as an intentional activity with importance
for active daily living (Kim and Ohara, 2010; Milke
et al., 2009; Wang and Glicksman, 2013; Yen et al.,
2014). Moreover, gardening seems to have a low
threshold with respect to participation and a high
degree of prior experience or interest for a broad
range of participants (Bleasdale et al., 2011).
Unger, S., Appelbaum, S., Ostermann, T. and Niedermann, C.
Movement Entropy in a Gardening Design Task as a Diagnostic Marker for Mental Disorders: Results of a Pilot Study.
DOI: 10.5220/0010227203370343
In Proceedings of the 14th International Joint Conference on Biomedical Engineering Systems and Technologies (BIOSTEC 2021) - Volume 5: HEALTHINF, pages 337-343
ISBN: 978-989-758-490-9
Copyright
c
2021 by SCITEPRESS – Science and Technology Publications, Lda. All rights reserved
337

Our pilot study thus aimed at investigating, how
gardening activity could be assessed and used as a
diagnostic marker in an experimental setting. We
therefore used human movement entropy. As
described in (O’Brien et al., 2017), entropy is
interpreted as a measure that describes how “vital” a
movement is. Low entropy thus represents stationary
and slow movement, while a high entropy is
associated with expansive and faster movement
behavior.
According to a study of Rohani et al. (2018)
movement entropy was found to have a negative
correlation with mental burden. Thus, a high entropy
would indicate a better mood of the participants,
which is the underlying hypothesis of this pilot study.
2 METHODS
2.1 Setting and Participants
The study was announced in the Witten/Herdecke
University and University staff members, their
relatives and friends and students were invited to
participate in the study on a voluntary basis.
Prior to the gardening task, all participants had to
sign an informed consent form and were asked to
complete a questionnaire, including demographic
items such as age, gender, self reported gardening
experience, creativity as well as the Brief Symptom
Inventory (BSI-18) to assess the mental state
expressed by the global severity index (GSI) of the
BSI-18 (Spitzer et al., 2011).
The main task for the participants consisted in
creating a landscape in a 2.5 x 2.5 m squared sandpit
area (Figure 1) in a maximum of 30 min (minutes).
Material to be used included plants, flowers,
branches and stones. They were allowed to use the full
space of the gardening area and were not limited in
their spatial movement or in times of resting.
Participants started from an identical point and were
videotaped with a user-independent camera installed
on a tripod at a height of 1.50 m and a 30-degree angle.
Ethical approval for this study was obtained from
the ethical committee of Arts Therapies of the
University of Applied Science, Nürtingen. The
complete study description is provided in
(Niedermann and Ostermann, 2019).
2.2 Data Acquisition
To analyze movement behavior, all videos of the test
group were played by a self-developed windows
application to manually track the positions of the
A
B
Figure 1: Setting of the sandpit from the camera perspective
(a) before and (b) after the gardening task.
participants. For this task, five psychology students
(3females and 2 males between the ages 21 and 24)
from the Department of Psychology and
Psychotherapy of the Witten/Herdecke University
volunteered. They were asked to always follow the
movements of the subjects by holding the mouse
pointer as near as possible to the subjects’ ankle.
Since some of the videos were quite long and the
student’s ability to concentrate should not be
overstrained, they could pause the movement tracking
process at any time. During this period, the tracking
automatically stopped.
In order to compensate distortions and other
sources of error that could arise from the tracking, the
whole set of the videos was fed through the analysis
software of each individual volunteer as shown in
Figure 2. While the students followed the movements,
Figure 2: Experimental setup.
HEALTHINF 2021 - 14th International Conference on Health Informatics
338

a background process tracked the position of the
mouse pointer. The interval between two time points
was set at 100 ms (milliseconds). Due to the 30-
degree angle between camera and ground, the
collected coordinates (x
i
, y
i
) were transformed by a
homography approach.
This approach is based on the Direct Linear
Transform (DLT), which uses a 2D (two-
dimensional) transformation matrix H (Hartley and
Zissermann, 2003). For the calculation of this 3 x 3
normalized matrix, a special case was considered, i.e.
there were 8 degrees of freedom and the position h
33
was set to one. The remaining eight 2D points
(P
1
... P
4
and P’
1
... P’
4
) were obtained by measuring
the corners of the projected sandpit using the
following formula:
𝐴
𝐴
𝐴
𝐵
ℎ
⋮
ℎ
(1)
For each point pair P
j
and P’
j
(j = 1…4) two rows
of the matrix A were calculated as follows:
⎝
⎜
⎜
⎜
⎜
⎜
⎛
𝑃
𝑃
1
0
0
0
𝑃
𝑃′
𝑃
𝑃′
0
0
0
𝑃
𝑃
1
𝑃
𝑃′
𝑃
𝑃′
⎠
⎟
⎟
⎟
⎟
⎟
⎞
𝑎
𝑎
(2)
The same algorithm was applied to matrix B,
except that only the projection points were needed:
𝑃′
𝑃′
𝑏
𝑏
(3)
Figure 3 visualizes the viewpoints, one (O) that is
related to the location of the camera and is the state
before the transformation and one (O’) that represents
the state after the homography was applied. Both
point in the direction of the sandpit. The two 2D
planes that are located in between show the resulting
sandpit from each view. Whereas it is formed as an
isosceles trapezoid near the bottom, looking from
viewpoint O, from viewpoint O’ it is drawn as square,
which is in the middle of its plane.
The whole data, including the calculated
coordinates, video length, video identifier and date,
was exported as a comma-separated values file (CSV-
file) for further statistical analysis.
Figure 3: Viewpoints toward the sandpit.
2.3 Data Processing
For data processing, the images from the total of five
data sets were combined into a single one for each of
the 16 videos, using a special algorithm implemented
in R, which summarized the pixel coordinates of the
related images in disjoint intervals with a span of 0.5
s (seconds). Every interval contained around 20
measurement points, from which the median was
taken to set the pixel of the final image. Compared to
averaging with the mean, the advantage of this
method is that the original trace of the subjects could
be retained.
Based on the approach of (Riungu et al., 2018)
who analyzed park visitors’ spatial behavior,
heatmaps were created as a graphical aid to analyze
place and frequency of the participants’ movement in
the work environment. In this heatmaps, any point
that was ever visited from the participant were
highlighted in color. The range of the colors starts
with dark red, meaning that the pixel coordinate was
tracked once. If there is more than one visit, a lighter
color is indicated, up to a pure white, which denotes
the highest visiting frequency. All other pixels of the
output image, i.e. coordinates that never occurred at
least once, remained in a dark black.
Based on the distribution of the movement,
Shannon’s entropy E was calculated. It is based on a
system of mutually exclusive and exhaustive spatial
clusters A
1
, A
2
, …, A
n
and a set of probabilities p
1
:=
p(A
1
), p
2
:= p(A
2
), …, p
n
:= p(A
n
), describing the
probability of having visited a respective cluster
(Ostermann and Schuster., 2015), and has been
applied in a variety of settings in health services
research. Then, the entropy is given by
𝐸
𝑝
,…,𝑝
𝑝
𝑙𝑜𝑔 𝑝
(4)
where 0 log 0 = 0 is assumed.
Movement Entropy in a Gardening Design Task as a Diagnostic Marker for Mental Disorders: Results of a Pilot Study
339
Because of an unknown optimal grid size for
producing the maps, several densities were used in
order to find the optimal resolution, regarding to the
cluster dimension. For that reason, Pearson’s
correlation coefficient of the global severity index
GSI and the movement entropy was calculated and
plotted against the grid size g of the clusters. In a final
step, a curve was fitted through the points using an
ordinary least square (OLS) approach. We assumed a
convergence of the correlation from a certain grid size
and thus used the exponential approach
𝑟𝑎𝑒
𝑐
(5)
to fit the curve. After the parameters a, b, and c were
found, the optimal grid was determined for the grid
size g where the tangent had a slope m = -1. This
specific point divides the e-function into two
symmetrically equal parts and was determined using
the first derivation:
𝑟
𝑏𝑎𝑒
1
(6)
To detect for further associations, we finally fitted
a multivariate regression model with the GSI as
dependent variable and entropy, gender and two self-
assessed items (gardening experience and creativity)
as independent variables.
3 RESULTS
Sixteen individuals (8 female) aged between 19 and
60 years (x
̅
age
= 28.67 years) participated in this pilot
study. Scores of the GSI showed a range of 2 to 27
points indicating a low to moderate mental burden.
The length of the videos ranged between 4.00 min to
30.00 min (x
̅
length
= 23.00 min).
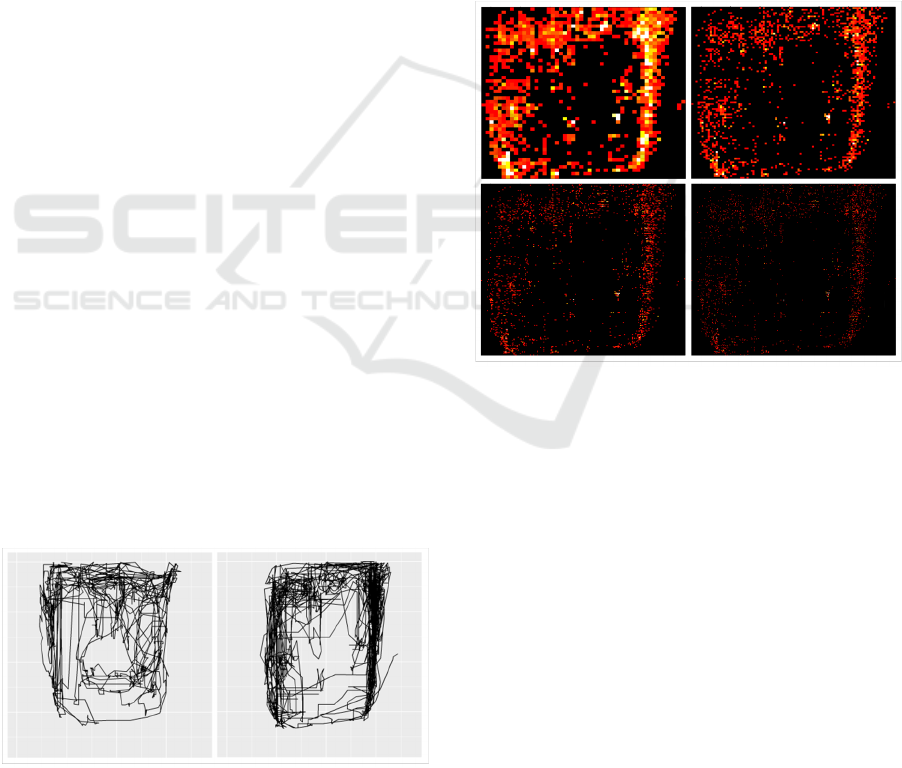
An example of the trajectory lines is given in
Figure 4. This example shows two dissimilar
Figure 4: Trajectory lines of a participant with a high BSI
on the left and a participant with a low BSI on the right. The
white lines exemplify a given grid.
movement styles. The tracing lines on the left belongs
to a participant with an extraordinarily high GSI
value. Other than the trajectories on the right, which
visualizes the active movement style of a participant
with a very low GSI value, these lines visually seem
less condensed and thin while the trajectories on the
right are bold indicating a higher pixel density and
thus a more active movement in the same area.
Figure 5 displays four heatmaps, corresponding to
the right participant of Figure 4. The maps were
created by using different grid sizes. From left to right
and from top to bottom, the raster increases in width
and height. A closer look reveals that this increases
the image resolution, too. If these heatmaps were
compared to those from the left participant of Figure
4, the latter would show a much lower distribution of
track points, resulting in an inferior entropy.
Figure 5: Heatmaps using different raster sizes. Top left ≙
50 x 50. Top right ≙ 100 x 100. Bottom left ≙ 200 x 200.
Bottom right ≙ 300 x 300.
Pearson’s correlation coefficient of the global
severity index GSI and the movement entropy plotted
against the grid size g of the clusters is displayed in
Figure 6. The red line denotes the curve found by
OLS-regression and is given by the following
exponential function:
𝑟0.44 𝑒
.
0.476
(7)
Using equation (6), an optimal grid was found at
g = 198.8, which resulted in a rounded grid size of
200 x 200 considered as optimum.
HEALTHINF 2021 - 14th International Conference on Health Informatics
340
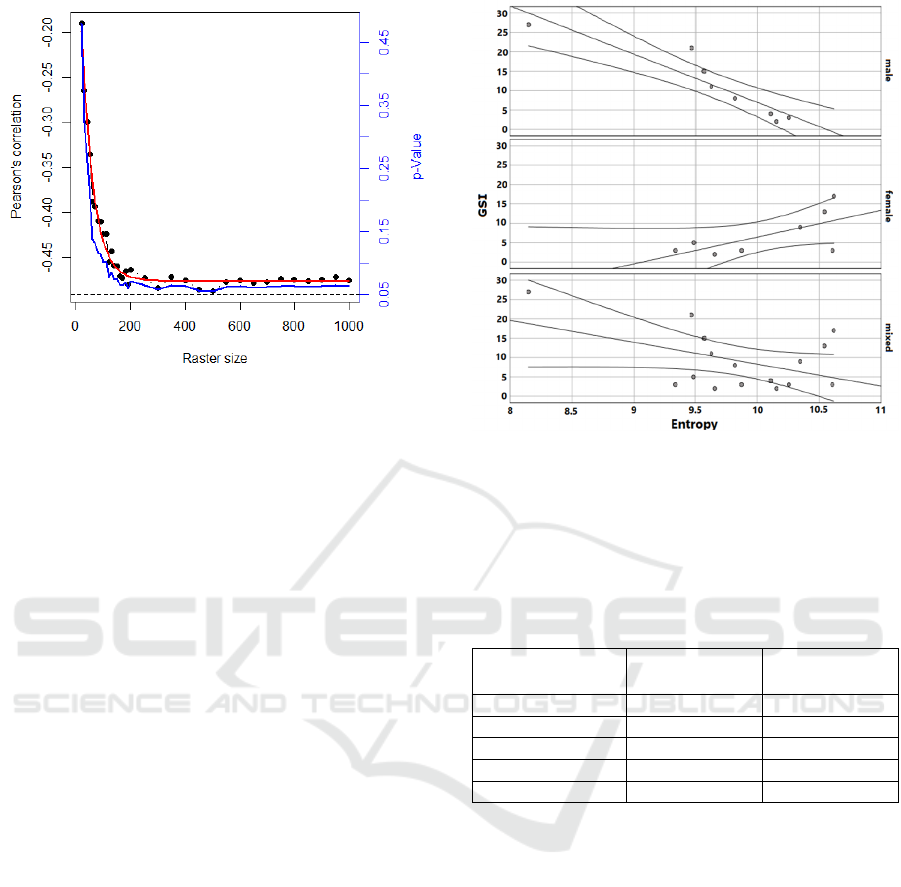
Figure 6: Correlation between the size of the raster and
Pearsons’s r (approximated as red curve) as well as the
corresponding p values (blue curve).
Looking at the optimum point, the Pearson’s
correlation value of r
0
= -0.463 nearly reached the
maximum of all the values, which ranged between
r
min
= -0.19 and r
max
= -0.487. Statistical significance
with a value of p
0
= 0.071 was slightly missed and
ranged between p
min
= 0.48 and p
max
= 0.056 for all
grid sizes (see the blue line in Figure 6).
Thus as a first result, it could be assumed that a
more vital and spacious movement can be associated
with lower mental burden which is displayed in the
bottom graph of Figure 7, in which the GSI is plotted
against the movement entropy for all participants for
the optimal grid size.
However, a closer examination of the dataset by
dividing it into two gender-based subgroups revealed
a clear gender specific effect, similar as found by Van
Tuyckom et al. (2012). The assumption made above
only applies to males (top graph of Figure 7), while
females participants behaved in the complete
opposite way (middle graph of Figure 7), presumably
to compensate their depressive mood with an
increased activity in order to achieve a feeling of
satisfaction by looking at their work of art afterwards
on the gardening task (Milligan et. al., 2004).
In addition to the visual illustration of the gender
effect, it was also statistically verified: whereas the
correlation between the GSI and the entropy strongly
increased in the females’ group (r
females
= 0.661),
there was an extremely sharp decrease in the
correlation line for the males (r
males
= -0.922).
Finally, using a multiple regression model with
the independent variables entropy, gender and the
product of both, a high significance could be obtained
(p < 0.001 for all predictors; r = 0.88). Other
Figure 7: GSI plotted against the movement entropy for all
participants for the optimal grid size of g = 200 x 200
separated into three gender groups.
variables such as self reported gardening experience
or creativity did not have any influence on the
outcome as it is shown in Table 1 below.
Table 1: Results of the multivariate regression model.
Variable Standardized β Significance
Entropy -2.544 0.001
Gender -13.086 0.001
Entropy × Gender 13.841 0.001
Experience 0.001 0.995
Creativity 0.117 0.518
4 CONCLUSIONS
In the field of garden and landscape design,
therapeutic studies have already shown effectiveness
(Clatworthy et al., 2013). In the field of diagnostics,
however, there were so far only rudimentary
approaches to record corresponding movement and
behavior patterns.
In this pilot study we thus aimed at investigating,
whether a reduced spatial movement in a gardening
task was related to higher value of mental distress. By
using a movement entropy approach and after finding
an optimal grid size, we finally were able to find a
highly significant association between these
quantities, which however were moderated by gender
and explained 77.4 % of variance. We thus can
assume that depending on the gender, movement
Movement Entropy in a Gardening Design Task as a Diagnostic Marker for Mental Disorders: Results of a Pilot Study
341

entropy in a gardening task is significantly associated
with mental distress.
This result is in accordance with other findings in
the field of human movement analysis. In the
Systematic Review of Rohani et al. (2018), entropy
amongst other features was the most promising
candidate to predict mental distress in 6 of 46
included studies. Moreover, the amount of explained
variance was also comparable with the results of an
exploratory study (Saeb et al, 2015) on depressive
symptom severity in daily-life behavior and
normalized entropy as an indicator of mobility
between favorite locations (r
2
= 33.64 %, p = 0.012).
Other approaches which examined the movement
patterns in drawing tests also found associations of
cognitive impairment and drawing entropy (Robens
et al., 2019). And in contrast to potentially similar
measures like pixel density (Unger et al., 2020), the
association between entropy and the GSI was more
pronounced.
From a methodological point of view, a further
important effect could be discovered. Changing the
size of the raster that ran over the input images had a
clear impact on the correlation of entropy and GSI:
The larger the dimensions was adjusted, the higher
was the amount of correlation. This went down until
a raster size of around 300 x 300 pixels after which
the amount of coefficient seemed to stagnate.
An explanation for this effect could be that a raster
with a lower resolution only generates heatmaps, in
which the clusters for the calculation are too close
together. However, the constant course of the curve,
after reaching the optimal value at a grid size of 200,
could be an indicator that the true value of r is located
within this area.
Despite of these promising results, there are also
some limitations. First of all, the number of
participants is too low to draw any statistically robust
conclusions out of our analyses. As this study was a
pilot study, we did not primarily focus on a sufficient
sample size to detect significant correlations, but
rather tried to investigate the feasibility of the
approach. Thus, our conclusions have to be
interpreted with care.
In addition, other specific factors would be
expected to influence movement entropy such as
creativity or previous gardening experience.
Although this was only a pilot study we were able to
show, that these variables did not influence our
results, indicating that no prior gardening experience
or a special amount of creativity is needed. However,
further studies should try to replicate our results with
a higher sample size to determine whether the results
remain stable.
Moreover, our result could be improved by
looking at the intersection lines that would result from
connecting two geographic tracing points. On the
other hand, this method is much more complex and
would rather appreciate the precise position of the
subjects.
From a technical point, the automatic object
detection and electronic tracking methods as
summarized in (Hatwar et al., 2018) might be used to
get a more precise picture of movement patterns. In
addition, the markerless measurement and evaluation
of kinetic features as proposed in (Trujillo et al.,
2019) might also contribute to a more differentiated
movement analysis without deterioration of the
original setup and might produce more reliable data.
REFERENCES
Bleasdale, T., Crouch, C., & Harlan, S. L. (2011).
Community gardening in disadvantaged neighborhoods
in Phoenix, Arizona: Aligning programs with
perceptions. Journal of Agriculture, Food Systems, and
Community Development, 1(3), 99-114.
Clark, D., Schumann, F. & Mostofsky, S.H. (2015).
Mindful movement and skilled attention. Frontiers in
Human Neuroscience, 9, 297.
Clatworthy, J., Hinds, J. & Camic, M.P. (2013). Gardening
as a mental health intervention: a review. Mental Health
Review Journal, 18(4), 214–225.
Collier, S., Monette, P., Hobbs, K., Tabasky, E.,
Forester, B. P. & Vahia, I. V. (2018). Mapping
Movement: Applying Motion Measurement
Technologies to the Psychiatric Care of Older Adults.
Current Psychiatry Reports, 20(8), 64.
Ghosh, S. & Ghosh, S.K. (2018). Exploring the association
between mobility behaviours and academic
performances of students: a context-aware traj-graph
(CTG) analysis. Progress in Artificial Intelligence,
7(4), 307–326.
Hartley, R. & Zisserman, A. (2003). Multiple view
geometry in computer vision (2nd ed.). Cambridge
University Press.
Hatwar, R.B., Kamble, S.D., Thakur, N.V. & Kakde, S.
(2018). A Review on Moving Object Detectionand
Tracking Methods in Video. International Journal of
Pure and Applied Mathematics, 118(16), 511–526.
Kim, D. & Ohara, K. (2010). A Study on the Role of
Gardening and Planning of Green Environments for
Daily Use by Residents in Senior Housing. Journal of
Asian Architecture and Building Engineering, 9(1), 55–
61.
Macdonald, K., Milne, N., Orr, R., & Pope, R. (2018).
Relationships between motor proficiency and academic
performance in mathematics and reading in school-
aged children and adolescents: a systematic review.
International journal of environmental research and
public health, 15(8), 1603.
HEALTHINF 2021 - 14th International Conference on Health Informatics
342

Milke, D.L., Beck, C.H.M., Danes, S. & Leask, J. (2009).
Behavioral Mapping of Residents’ Activity in Five
Residential Style Care Centers for Elderly Persons
Diagnosed with Dementia: Small Differences in Sites
Can Affect Behaviors. Journal of Housing for the
Elderly, 23(4), 335–367.
Milligan, C., Gatrell, A. & Bingley, A. (2004). Cultivating
health: therapeutic landscapes and older people in
northern England. Social Science & Medicine, 58,
1781–1793.
Niedermann, C. & Ostermann, T. (2019). Zur Bedeutung
von Gartengestaltung für die Erfassung mentaler
Gesundheit: Konzeptentwurf eines Pilotprojekts. In C.
Schulze-Stampa & K. Schoch (Eds.), In/ter/ven/tion: in
mit durch Kunst (5th ed., pp. 58–63). Hochschule für
Künste im Sozialen Ottersberg.
O'Brien, J. T., Gallagher, P., Stow, D., Hammerla, N.,
Ploetz, T., Firbank, M., Ladha, C., Ladha, K., Jackson,
D., McNaney, R., & Ferrier, I. N. (2017). A study of
wrist-worn activity measurement as a potential real-
world biomarker for late-life depression. Psychological
medicine, 47(1), 93-102.
Ostermann, T., & Schuster, R. (2015). An Information-
theoretical Approach to Classify Hospitals with
Respect to Their Diagnostic Diversity using Shannon's
Entropy. Proceedings of the International Conference
on Health Informatics 2015: 325-329.
Riungu, G. K., Peterson, B. A., Beeco, J. A. & Brown, G.
(2018). Understanding visitors’ spatial behavior: a
review of spatial applications in parks. Tourism
Geographies, 20(5), 833–857.
Robens, S., Heymann, P., Gienger, R., Hett, A., Müller, S.,
Laske, C., Loy, R., Ostermann, T. & Elbing, U. (2019).
The Digital Tree Drawing Test for Screening of Early
Dementia: An Explorative Study Comparing Healthy
Controls, Patients with Mild Cognitive Impairment, and
Patients with Early Dementia of the Alzheimer Type.
Journal of Alzheimer's Disease: JAD, 68(4), 1561–
1574.
Rohani, D. A., Faurholt-Jepsen, M., Kessing, L. V., &
Bardram, J. E. (2018). Correlations between objective
behavioral features collected from mobile and wearable
devices and depressive mood symptoms in patients with
affective disorders: systematic review. Journal of
medical Internet research, mHealth and uHealth, 6(8),
e165.
Spitzer, C., Hammer, S., Löwe, B., Grabe, H. J., Barnow,
S., Rose, M., Wingenfeld, K., Freyberger, H. J. &
Franke, G. H. (2011). The short version of the Brief
Symptom Inventory (BSI -18): preliminary
psychometric properties of the German translation.
Fortschritte der Neurologie-Psychiatrie, 79(9), 517–
523.
Saeb, S., Zhang, M., Karr, C. J., Schueller, S. M., Corden,
M. E., Kording, K. P., & Mohr, D. C. (2015). Mobile
phone sensor correlates of depressive symptom severity
in daily-life behavior: an exploratory study. Journal of
medical Internet research, 17(7), e175.
Trujillo, J.P., Vaitonyte, J., Simanova, I. & Özyürek, A.
(2019). Toward the markerless and automatic analysis
of kinematic features: A toolkit for gesture and
movement research. Behavior Research Methods,
51(2), 769–777.
Unger, S., Ostermann, T., Appelbaum, S. & Niedermann,
C. (2021). Tracking Human Spatial Motion in the
Design of Gardens as a Potential Method to detect
Mental Disorders – A Pilot Study. Acta Horticulture,
Accepted for publication.
Van Tuyckom, C., Van de Velde, S., & Bracke, P. (2012).
Does country-context matter? A cross-national analysis
of gender and leisure time physical inactivity in Europe.
European Journal of Public Health, 23(3), 452–457.
Wang, D. & Glicksman, A. (2013). “Being Grounded”:
Benefits of Gardening for Older Adults in Low-Income
Housing. Journal of Housing for the Elderly, 27(1-2),
89–104.
Yen, I. H., Flood, F. J., Thompson, H., Anderson, L. A. &
Wong, G. (2014). How design of places promotes or
inhibits mobility of older adults: Realist synthesis of 20
years of research. Journal of Aging and Health, 26(8),
1340–1372.
Zhu, X., Haegele, J. A., & Healy, S. (2019). Movement and
mental health: Behavioral correlates of anxiety and
depression among children of 6–17 years old in the US.
Mental Health and Physical Activity, 16, 60-65.
Movement Entropy in a Gardening Design Task as a Diagnostic Marker for Mental Disorders: Results of a Pilot Study
343
