Optimizing Hospital Room Layout to Reduce the Risk of Patient Falls
Sarvenaz Chaeibakhsh
1
, Roya Sabbagh Novin
1
, Tucker Hermans
2
, Andrew Merryweather
1
and Alan Kuntz
2
1
Department of Mechanical Engineering, University of Utah, UT, U.S.A.
2
School of Computing, University of Utah, UT, U.S.A.
Keywords:
Hospital Layout Planning, Fall Risk, Computerized Layout Planning, Simulated Annealing.
Abstract:
Despite years of research into patient falls in hospital rooms, falls and related injuries remain a serious concern
to patient safety. In this work, we formulate a gradient-free constrained optimization problem to generate and
reconfigure the hospital room interior layout to minimize the risk of falls. We define a cost function built on a
hospital room fall model that takes into account the supportive or hazardous effect of the patient’s surrounding
objects, as well as simulated patient trajectories inside the room. We define a constraint set that ensures the
functionality of the generated room layouts in addition to conforming to architectural guidelines. We solve
this problem efficiently using a variant of simulated annealing. We present results for two real-world hospital
room types and demonstrate a significant improvement of 18% on average in patient fall risk when compared
with a traditional hospital room layout and 41% when compared with randomly generated layouts.
1 INTRODUCTION
Patient falls in healthcare settings have a severe im-
pact on patient outcomes, resulting in increased mor-
bidity, length of stay, and reduced quality of life. Fur-
ther, unnecessary falls incur significant financial costs
to both patients and the healthcare system. Every year
in the US 700,000 to 1,000,000 people fall in hos-
pitals (Hughes, 2008). Studies have shown that close
to one-third of these falls are preventable (Cameron
et al., 2012).
Substantial research studying hospital falls and re-
lated fall injuries has been done, yet the range of
preventive and protective interventions is still some-
what limited. Current preventive interventions mostly
include solutions to notify staff when the patient
egresses, such as bed alarms and video monitoring,
with the intention that the staff can intervene with
the patient prior to a fall occurring (Alert, 2015; Cal-
lis, 2016). Safety measures have also been studied
to reduce injury severity when a fall occurs, such as
hip protectors and compliant flooring (Willgoss et al.,
2010). Yet fall rates continue to be unacceptably high
and are even increasing (Hsiao, 2016; Alert, 2015),
representing a serious threat to patient safety.
A variety of causes contribute to patient falls.
However, environmental hazards and accidents have
been identified as the most common causes of falls
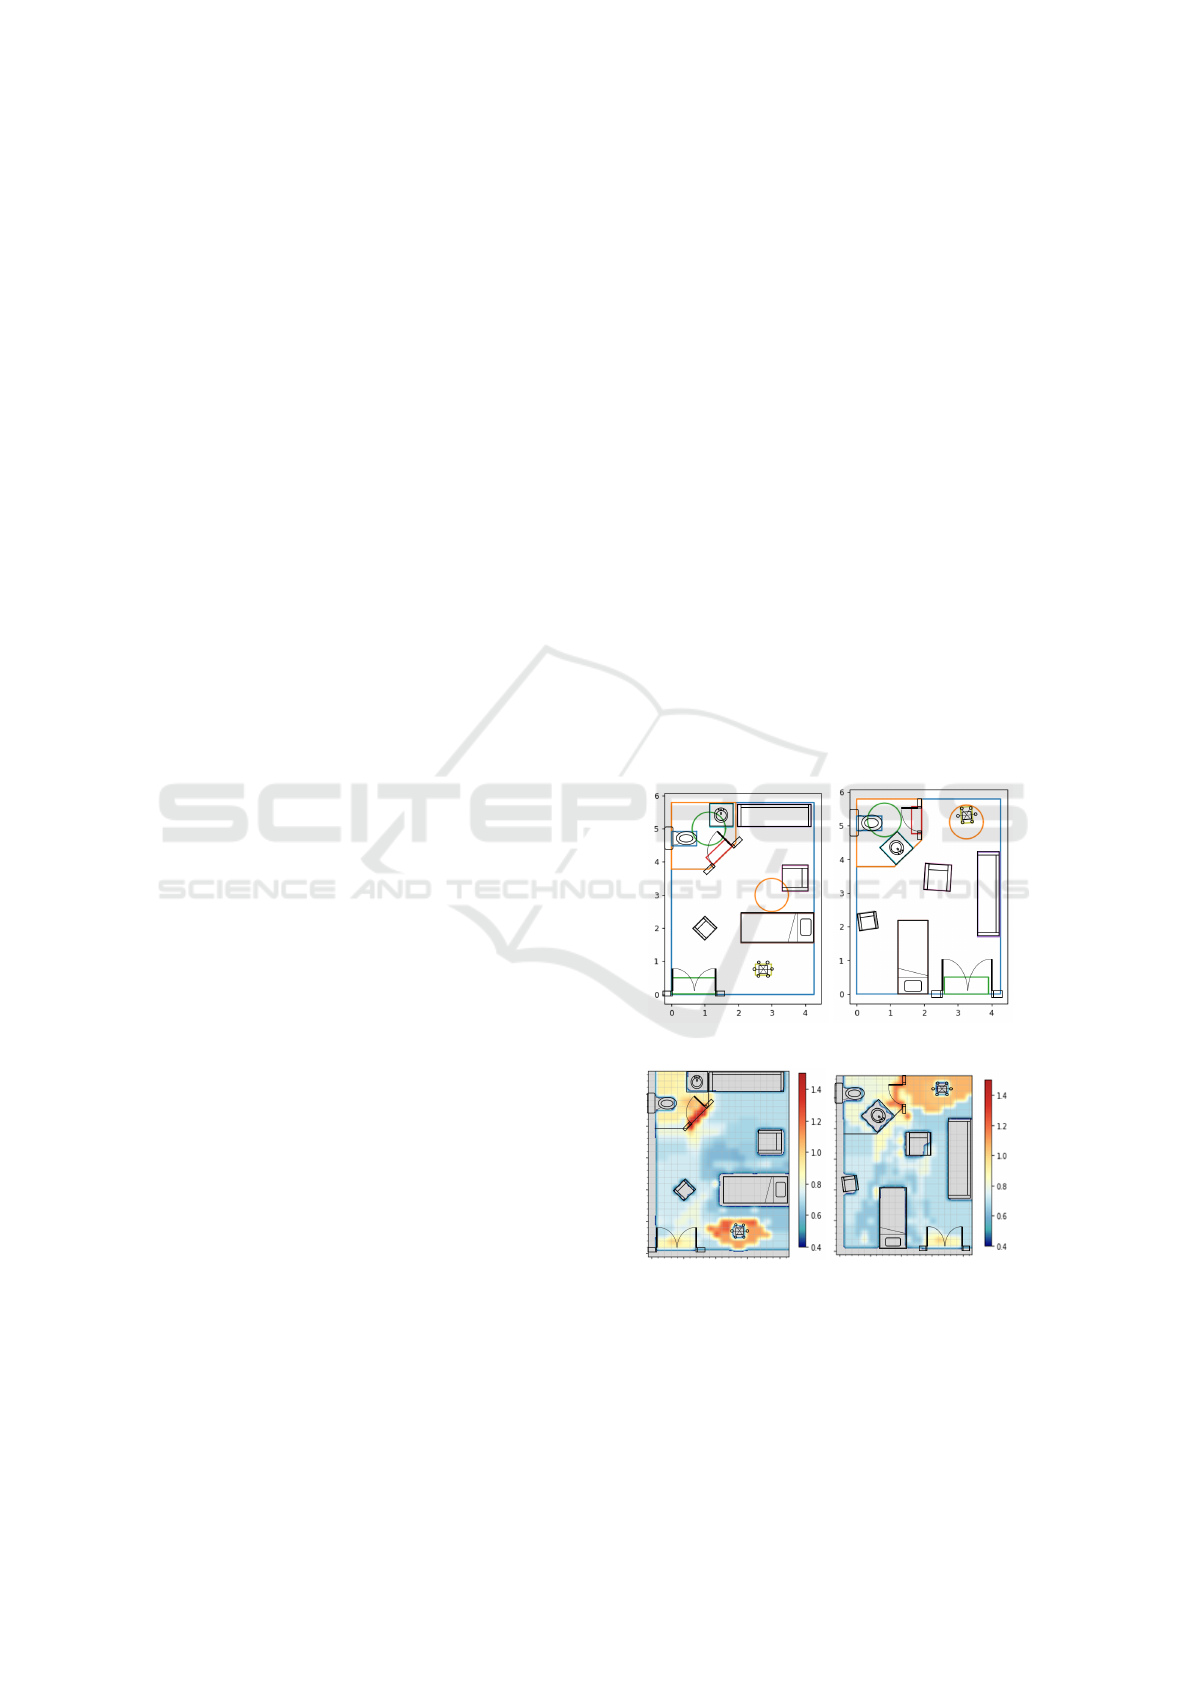
(a) Traditional layout (b) Optimized layout
(c) Risk of fall heatmap
for traditional layout
(d) Risk of fall heatmap
for optimized layout
Figure 1: Traditional and optimized room layout evalua-
tion with respect to fall risk. Figures (a) and (b) show the
schematic of the rooms and figures (c) and (d) show the
corresponding heat map of the risk of fall as evaluated by
the fall risk model.
36
Chaeibakhsh, S., Novin, R., Hermans, T., Merryweather, A. and Kuntz, A.
Optimizing Hospital Room Layout to Reduce the Risk of Patient Falls.
DOI: 10.5220/0010226300360048
In Proceedings of the 10th International Conference on Operations Research and Enterprise Systems (ICORES 2021), pages 36-48
ISBN: 978-989-758-485-5
Copyright
c
2021 by SCITEPRESS – Science and Technology Publications, Lda. All rights reserved

among the elderly (Commission et al., 2015). Re-
cently, a metric of patient fall risk during unassisted
ambulation in a hospital room was proposed that con-
siders the layout of the room (Novin et al., 2020). This
method estimates the fall risk of a room by consider-
ing room design factors including lighting, flooring
type, door operation (swinging or sliding), and sup-
porting objects (e.g., furniture, grab bars, bed rails,
etc) in the room.
However, the relationship between the fall risk and
the room layout as defined by the metric in (Novin
et al., 2020) is complex and non-intuitive, making
manually adjusting the layout to reduce the fall risk
infeasible.
In this work, we build upon this fall model and
employ gradient-free optimization to automatically
generate hospital room layouts that reduce the risk of
patient falls (see Fig. 1). Specifically, we adapt simu-
lated annealing to optimize features of multiple real-
world hospital rooms including the placement of ob-
jects such as the patient bed, sofa, patient chair, IV
pole, toilet and sink; the placement of lighting; and
the locations of the main door and bathroom door.
We employ real-world architectural design guide-
lines as constraints, such as specific minimum clear-
ance between sets of objects, which are representa-
tive of residential construction requirements to en-
sure room functionality (Ramsey, 2007; Neufert and
Neufert, 2012). Using these guidelines as constraints
enables the method to take steps toward designing
feasible rooms that reduce the risk of patient falls.
This paper represents the first work that optimizes
hospital room layouts to reduce the risk of patient
falls.
2 RELATED WORK
With patient falls being a serious issue in health care
settings, many solutions have been proposed in the
literature to reduce falls and post-fall injuries(Callis,
2016; Clarke et al., 2012; Mayo et al., 1994). Our
method is conceptually similar to computerized lay-
out planning. The focus of our method is on lever-
aging optimization to reduce the risk of fall in hos-
pital rooms by changing the layout of the furniture
and medical devices to create safer surroundings and
pathways for the patient. In this section, we discuss
the history of patient falls and fall prevention meth-
ods and discuss existing applications of computerized
layout planning in general and in health care.
2.1 Hospital Fall Prevention Strategies
Despite extensive efforts to prevent patient falls, falls
in acute care hospital rooms remain a serious is-
sue(Hsiao, 2016). Around one-third of hospital falls
result in injuries to the patient and over 84% of ad-
verse incidents in hospitals that lead to co-morbidity
and mortality are associated with falls(Choi et al.,
2011; Aranda-Gallardo et al., 2013). Most previous
research on hospital falls has focused on the effect of
intrinsic factors including medications, and less atten-
tion has been paid to extrinsic factors relating to the
hospital room itself and the patient’s physical envi-
ronment (Callis, 2016). Different preventive strategies
such as patient education (Clarke et al., 2012), phys-
ical restraints, alarms (Mayo et al., 1994; Tideiksaar
et al., 1993) and flooring (Donald et al., 2000) have
tried to address this serious issue. Still, hospital falls
continue to be the leading cause of injuries to the se-
nior population in health care facilities (Commission
et al., 2015).
The layout of furniture and medical equipment in
hospital rooms has been shown to have a significant
impact on the safety of patients (Hignett and Ma-
sud, 2006). Studies such as (Commission et al., 2015)
and (Hignett and Masud, 2006) highlight the sig-
nificance of patients’ physical surroundings in their
safety and suggest several environmental strategies,
such as ensuring adequate lighting and appropriate
flooring types, to reduce the risk of fall. In this work,
we build on this concept; the physical layout includ-
ing furniture and equipment in a hospital room can be
optimized to improve patient safety and decrease the
risk of falls. We accomplish this using an optimization
method in a manner conceptually similar to comput-
erized layout planning.
2.2 Computerized Layout Planning
Computerized layout planning refers to leveraging
computers in allocating space while a set of criteria
and constraints are met and/or some objectives are
optimized. The demand for computerized layout plan-
ning has been growing since the 1960’s when the first
ideas for rule-based computerized layout planning be-
gan to take shape (Liggett, 1985). Since then, much
work has been done on computerized layout plan-
ning, including a few commercialized products. Many
of the commercialized computerized layout planning
tools, such as Spacemaker (SpacemakerAI, 2016) and
Planner 5D (Planner5D, 2011), focus on automati-
cally planning the layout and space allocation for
the placement of buildings rather than interior lay-
out. These software packages use techniques in math-
Optimizing Hospital Room Layout to Reduce the Risk of Patient Falls
37

ematical modeling, artificial intelligence, and archi-
tectural urban development to assist architects in de-
signing multi-building residential sites and high level
planning. Some of these methods generate different
facility layouts based on predefined rules (Araghi
and Stouffs, 2015) while others use machine learning
methods to design general building layouts (Merrell
et al., 2011). However, so far the application of ma-
chine learning methods have been limited in efficacy
for large scale or detailed problems (Wu et al., 2018;
Jamali et al., 2020).
Beyond space allocation and layout planning,
where the concern is about the physical arrangement
of objects and resources that consume space, comput-
erized layout planning has also been applied to object
placement in interior design. In (Merrell et al., 2011),
an interactive layout planner is proposed which takes
an initial furniture arrangement and constraints and
suggests new furniture configurations to the user. Gal
et al. use a rule-based method to develop a frame-
work to generate object layouts by solving a con-
straint satisfaction problem (Gal et al., 2014). With
advances in AI, virtual reality, and augmented real-
ity, AI-based interior design tools are emerging. The
IKEA PLACE platform, developed by IKEA, virtu-
ally places the company’s products in an area scanned
via a cellphone camera (IKEA, 2019). Leaperr AI
software (Leaperr, 2018) combines deep learning and
image processing to suggest a design for the interior
of a room based on a preference questionnaire filled
out by the user. Planner 5D is another AI-powered app
that turns 2D blueprints into 3D and helps users visu-
alize their desired furniture layout (Planner5D, 2011).
The established AI-powered methods in general are
designed to help a user design and visualize a space,
but generally do so without any knowledge of design
rules, layout constraints, or optimization techniques.
Hospital department layout planning is one of the
more focused research areas in computerized layout
planning for health care facilities (Zuo et al., 2019;
Rismanchian and Lee, 2017; Lin et al., 2015). In hos-
pital department layout planning the location of hos-
pital departments are rearranged to improve metrics
such as patient travel time and relocation cost (Jamali
et al., 2020). However, a method to inform the furni-
ture layout in health care facilities to improve patient
safety has yet to be studied.
In this paper, we address the placement of furni-
ture, lighting, and doorways inside a hospital room
to reduce patient falls. The concept of satisfying con-
straints and optimizing the placement of objects ex-
ists in other application domains. Next we discuss two
categories of existing methods that have been used to
accomplish similar tasks in these domains: construc-
tive (rule based) methods and iterative improvement
(optimization-based) methods.
2.2.1 Constructive/Rule based Methods
Constructive or rule-based methods build a
constraint-satisfying solution by placing objects
one-by-one in an iterative decision process. Each
object that is placed in the room has its own features
that should be compatible with the previously placed
items and the features of the specific environment,
described as constraints. For example, a bed and a
sofa cannot be stacked, but a ceiling light fixture
can be located above a bed. Frequently, these re-
search questions are framed as constraint satisfaction
problems (Gh
´
edira, 2013), and employ backtracking
methods (Karumanchi, 2018) to solve problems with
many complex constraints.
In (Tutenel et al., 2009), the authors use a rule-
based method to automatically create scenes for sand-
box style video games. In (Merrell et al., 2011), an
interactive layout planner is proposed which takes
in an initial furniture arrangement and set of con-
straints, and suggests a new furniture configuration to
the user. These proposed layouts are based on archi-
tectural guidelines to ensure functionality as well as
aesthetic appeal. In (Gal et al., 2014) Gal uses a rule-
based method to develop a framework to generate ob-
ject layouts by solving a constraint satisfaction prob-
lem in placing objects in augmented reality. However,
these constructive models generally only produce a
feasible solution that satisfies a set of constraints, but
do not consider producing an optimal solution under
some cost function. In this paper, we adapt the con-
cept of a constraint satisfaction problem to generate
constraint-satisfying, feasible hospital rooms during
our optimization process.
2.2.2 Iterative Improvement Methods
Iterative improvement, or optimization-based meth-
ods start with an initial solution and improve upon
it over multiple iterations. The initial solution is ei-
ther generated randomly or can be introduced to
the system by the user. There are many types of
iterative improvement optimization methods (Yang,
2014). Many iterative methods do not necessarily
need gradient/derivative information, enabling them
to solve a larger class of complex and discontinuous
problems for which such gradient information may
not be available. Some iterative methods are inspired
by natural processes, such as simulated annealing and
genetic algorithms, and attempt to balance exploring
unknown regions of a parameter space and exploiting
ICORES 2021 - 10th International Conference on Operations Research and Enterprise Systems
38

existing knowledge in finding near-optimal solutions
(Yang, 2014).
Simulated annealing is a canonical probabilistic it-
erative improvement method that was first proposed
by Kirkpatrick, Gelett, and Vecchi in 1983 (Kirk-
patrick et al., 1983), further improved by
ˇ
Cern
`
y in
1985 (
ˇ
Cern
`
y, 1985), and has been the focus of much
study since (Bertsimas et al., 1993; Dowsland and
Thompson, 2012; Nikolaev and Jacobson, 2010). This
method, as indicated by the name, is conceptually
based on the natural process of solids cooling down.
When a solid cools, it reaches an equilibrium at each
temperature. Simulated annealing takes advantage of
this natural procedure to find the global optimum
of a cost function that has many local optima, and
does not depend on the quality of the initial solu-
tion (Van Laarhoven and Aarts, 1987; Szu and Hart-
ley, 1987; Aarts and Korst, 1988; Romeijn and Smith,
1994). In this method, the algorithm generates can-
didate solutions that are nearby the current solution.
The method accepts the candidate solution if it is bet-
ter than the current solution. If the candidate solu-
tion is worse, however, the algorithm may still accept
the candidate solution with some probability. This en-
ables the algorithm to explore sub-optimal regions of
the parameter space, helping the algorithm to escape
local optimums (Romeijn and Smith, 1994). This pro-
cess is repeated while time allows or until conver-
gence, producing near-optimal solutions (Aarts and
Korst, 1988; Romeijn and Smith, 1994).
Simulated annealing has been used for a vari-
ety of different layout planning problems (Serafini,
1994; McKendall Jr et al., 2006; S¸ahin, 2011; Aho-
nen et al., 2014; Palubeckis, 2015). In 2001, Bayka-
soglu et al. (Baykaso
˘
glu and Gindy, 2001) demon-
strated the applicability of simulated annealing in dy-
namic manufacturing facility layout planning. The al-
gorithm was further developed and used in more com-
plex static and dynamic layout planning problems
with multiple objective functions such as corridor al-
location(Ahonen et al., 2014), arranging manufactur-
ing facilities(McKendall Jr et al., 2006), and single-
row equidistant facility layout problems (Palubeckis,
2015).
Despite much research in automatic industrial and
commercial layout planning, optimizing the layout
of the interior of hospital rooms considering patient
safety has not yet been studied and is the subject of
this work.
3 METHOD
Our method optimizes the interior layout of a hospital
room to create a safer environment for the patient with
respect to risk of fall. To do so, we define a cost func-
tion built around the fall risk assessment model devel-
oped in (Novin et al., 2020). We minimize this cost
function using simulated annealing and leverage real-
world architectural design guidelines (Ramsey, 2007;
Neufert and Neufert, 2012) as constraints to ensure
room functionality.
3.1 Hospital Room Layout
A typical single-bed hospital room consists of two
sub-rooms, a main room, where the patient, visitor
and clinical zones are located, and a bathroom where
the toilet, shower and sink are located. The geometry
of the room boundaries are determined via architec-
tural considerations and are inputs to our method (See
Fig. 1 for the room geometry used in this paper).
For each of these sub-rooms, specific furniture
items must be placed, light sources included to il-
luminate the room, and doorways must connect the
bathroom to the main room and the main room to the
hallways. In this work, we optimize the placement of
the furniture, light sources, and doorways to lower the
risk of patient fall.
Borrowing notation from the constraint satisfac-
tion problem literature, we formalize the input to our
method as three sets: X = {x
0
,x
1
,...,x
n
}, a set of
n variable objects (e.g., furniture, lights sources, and
doors) for the room; D = {D
0
,D
1
,...,D
n
}, a set of
domains that are defined for each variable in X ; and
C , a set of constraints defined over the variables in
X , where each constraint may relate any subset of the
variables.
For each object x
i
in X , we parameterize its place-
ment in the hospital room as the configuration vector
d
d
d
i
∈ D
i
. We then parameterize the layout of the entire
hospital room as the vector
= [d
d
d
T
0
,d
d
d
T
1
,...,d
d
d
T
n
]
T
, the
concatenation of the configuration vectors for each of
the objects in X .
At a high level, the goal of the method is to deter-
mine a specific layout
of the hospital room that re-
spects each constraint in C , while minimizing a func-
tion that relates
to the risk of patient falls.
3.2 Quantifying Fall Risk
To evaluate a specific room layout we build on the
fall risk assessment model proposed in (Novin et al.,
2020) in which the overall fall risk distribution of a
room is calculated as a function of a set of factors
Optimizing Hospital Room Layout to Reduce the Risk of Patient Falls
39
extrinsic to the patient taken from previous studies of
hospital fall risk. This fall risk model considers both
static and dynamic factors affected by the room con-
figuration and provides two levels of fall risk eval-
uation: (1) A room baseline evaluation that is calcu-
lated solely from the static factors of: floor type, light-
ing condition, door operation, and the supporting or
hazardous effect of the surrounding objects (e.g. grab
bars, chair, medical stands, sofa, sink, toilet, and bed)
resulting in a risk distribution over the entire room;
and (2) Motion-based evaluation that considers pa-
tient ambulation defined by dynamic gait properties
such as the turning angle and the type of activity such
as sit-to-stand, walk, turn, and stand-to-sit.
The input to this risk model includes details about
the room such as floor surface type as well as the room
layout defining the lighting, locations and configura-
tions of all objects, and door placements. The output
is a risk distribution defined as a value for each el-
ement of a grid map discretizing the hospital room,
r(
).
In the baseline layer of the model, each grid has a
base value of 1. Then, the value is modified based on
the distance to the closest supporting object as well
as lighting, flooring, and door operation factors. For
the motion-based evaluation, the model uses a set of
pre-defined scenarios such as the patient’s transitions
from bed to toilet and then predicts sample trajecto-
ries between objects for each scenario. Each grid cell
through which the simulated trajectory passes is influ-
enced by the specific simulated activity, such as sit-to-
stand, and dynamic factors such as angular velocity
and turning angle.
As multiple trajectories are possible between two
target objects, the model generates and evaluates a
distribution of simulated patient trajectories. The dis-
tribution of the fall risk for the entire room is obtained
by combining the baseline and motion-based evalua-
tion risk profiles. To do so, the average of the baseline
fall risk factors and the fall risk of the points of the
trajectories/activities laying on each grid cell is calcu-
lated. The final output is a risk value for each grid cell.
This can be visualized as a heat map over the hospital
room layout showing the distribution of fall risk val-
ues (e.g., see Fig. 1). These values correspond to the
percentage of increase or decrease in the risk of fall
for each grid cell. Values greater than 1.0 (red cells)
mean that there is high fall risk, and values less than
1.0 (blue cells) show that the fall risk is decreased.
See (Novin et al., 2020) for more details on the spe-
cific framework and contributing factors.
In our work we optimize a cost function designed
for this set of fall risk values that weighs different as-
pects of the distribution, as there are multiple poten-
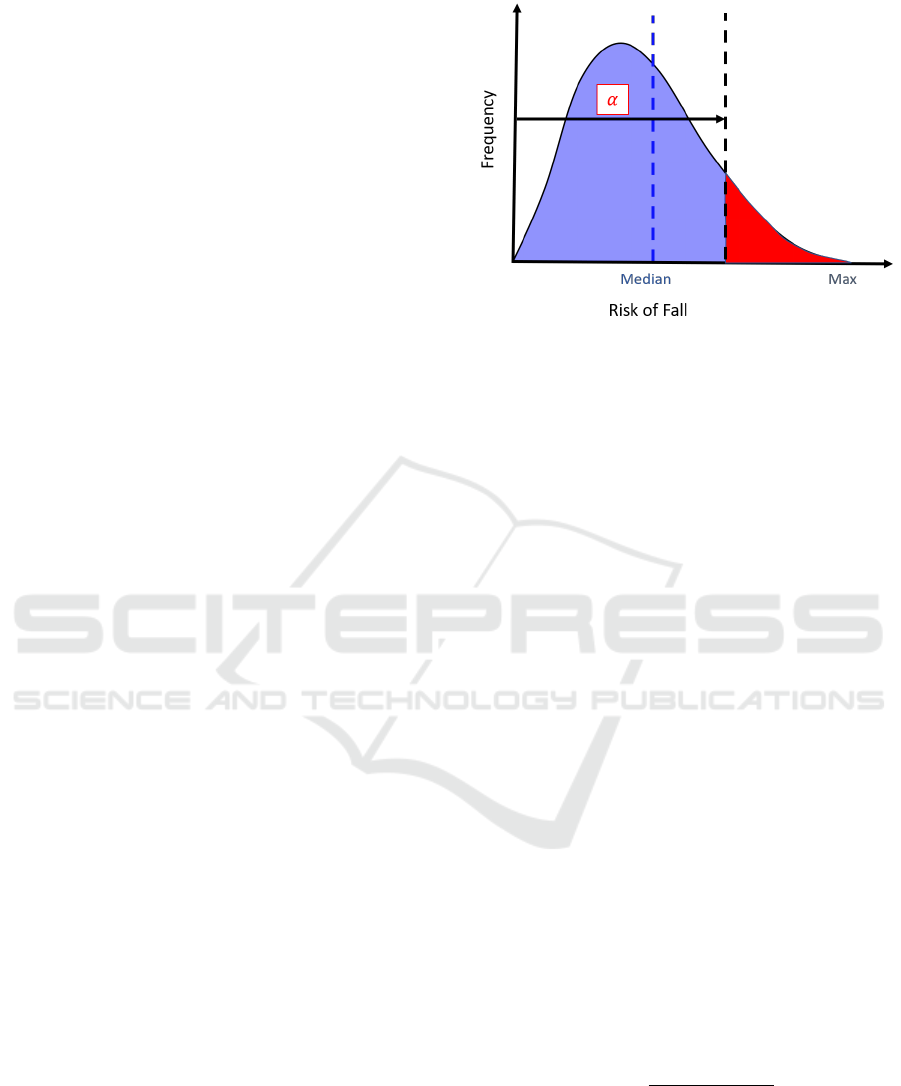
Figure 2: Cost function parameters of the fall risk distribu-
tion, showing the median, maximum, and the area under the
high-risk tail. Parameter α is the cut-off value for the area
under the curve and the red region shows the area consid-
ered by the cost function.
tial aspects of the distribution that are relevant. For
example, if we define the cost function as the maxi-
mum fall risk in the room, the optimizer may focus
on reducing the risk of fall of the single worst grid
cell while the fall risk of the rest of the room re-
mains unacceptably high. On the other hand, if we
define the fall risk as the mean or median fall risk
over all the grid cells of the room, the algorithm may
reduce the mean or median while a few grid cell val-
ues may remain extremely high. Further, it may be the
case that the width of the high-risk tail of the distri-
bution is an important factor in assessing the overall
risk of a room, as it represents a set of high-risk ar-
eas. Each of these considerations relates the fall risk
distribution to a different objective. Thus, we define
a weighted combination of the median and the maxi-
mum of the fall risk distribution, as well as a metric of
the area under the high-risk tail of the distribution as
an aggregate representation of fall risk. The specific
weighting of these considerations can then be set by
the user based on their specific, clinically-motivated
preferences. In this work we treat this weighting as
input to our method.
Specifically, we define the cost function f (
) as:
f (
) =ω
1
median(r(
)) +ω
2
max(r(
))
+ ω
3
α − mean(r(
))
std(r(
))
(1)
where α is a user specified cut-off parameter that de-
termines where in the distribution to begin consider-
ing the area under the tail, as seen in Fig. 2. The third
term in Eq. 1 represents the aggregation of the grid
cells with risk values higher than α. The concept of
considering the area under the curve tail is a familiar
ICORES 2021 - 10th International Conference on Operations Research and Enterprise Systems
40

concept in finance risk management and is known as
the conditional value-at-risk (Rockafellar and Urya-
sev, 2002). Our final cost function is then a function
of the median, mean, standard deviation, and maxi-
mum value of the fall risk distribution. Due to the dis-
cretization of the room and the random simulation of
patient movement in r(
), along with other factors,
f (
) is both highly non-linear and not differentiable.
This motivates our use of a gradient-free optimization
method when optimizing f (
).
3.3 Optimizing the Layout
In this work we leverage simulated annealing for op-
timizing f (
) as it is a well known stochastic iterative
optimization method for gradient and derivative free
cost functions such as f (
). At each iteration, a lay-
out nearby the current layout is generated at random
and its cost is evaluated. If it is an improvement over
the current layout it is accepted and becomes the cur-
rent layout for the next iteration. If it is worse, it may
still be accepted based on the Metropolis Probabil-
ity (Aarts and Korst, 1988; Van Laarhoven and Aarts,
1987; Metropolis et al., 1953):
P
Metropolis
= exp(
−∆c
κT
) (2)
where κ is the Boltzman constant and T is a “temper-
ature” value which decays over time according to a
cooling schedule and c stands for the cost value asso-
ciated with the layouts.
The temperature scheduling function we use in
our method is widely used and was first introduced by
Kirkpatrick et al. in 1983 (Kirkpatrick et al., 1983),
T
i
= kT
i−1
(3)
where T
i
is the temperature at cycle i and is based
upon the previous cycle’s temperature, T
i−1
, and k is
a constant factor (0 < k < 1) controlling the rate of
temperature decay (Faber et al., 2005).
The algorithm, detailed in Alg. 1, begins with
an initial layout. It then improves upon this layout
for a set number of cycles, where the temperature
is decreased according to Eq. 3 between each cycle.
Within each cycle, the algorithm generates candidate
layouts,
next
during a number of trials. In each trial,
the algorithm checks if the new candidate layout’s
cost value, c
next
is lower than the previously accepted
layout’s cost c
current
. If so, the system accepts the can-
didate layout for the next trial. However, if the cost
value of the candidate layout is higher than the pre-
viously accepted solution, the algorithm may still ac-
cept it depending on the acceptance probability de-
fined by Eq. 2, enabling the algorithm to avoid local
minima.
Algorithm 1: Simulated Annealing for Hospital Room Op-
timization.
1: Initialization:
2: T
0
← initial temperature
3: k ← temperature decreasing factor
4: κ ← Boltzman constant
5: σ
σ
σ
r
← vector of standard deviations
6: numCycle ← number of cycles
7: numTrial ← number of trials per cycle
8:
0
← initial room layout
9:
current
←
0
the current layout
10:
best
←
0
the best layout found
11: c
current
← f (
0
) cost of current layout
12: c
best
← f (
0
) cost of best layout found
13: for i = 1 to numCycle do
14: T
i
= kT
i−1
15: for j = 1 to numTrial do
16:
next
← NearbyFeasLayout(
current
,σ
σ
σ
r
)
17: c
next
← f (
next
)
18: P = exp(
c
next
−c
current
κT
i
)
19: r ← generate a random number in (0, 1)
20: if c
next
< c
current
or r < P then
21:
current
←
next
22: c
current
← c
next
23: if c
current
< c
best
then
24:
best
←
current
25: c
best
← c
current
26: end if
27: end if
28: end for
29: end for
30: return
best
,c
best
As the algorithm progresses this acceptance prob-
ability decreases.
In this way, the method generates better and better
layouts over time, iteratively improving the layouts
with respect to our cost function, returning the best
layout found at the conclusion of the method’s execu-
tion.
3.4 Generating Feasible Layouts
When generating both a random initial feasible room
layout (Alg. 1 line 8) and nearby feasible layouts
(Alg. 1 line 16, NearbyFeasLayout) during the ex-
ecution of the optimization, it is important that the
layouts are feasible, i.e., satisfy all of the constraints
in the constraint set C . In both cases, we employ a
random sampling with backtracking approach. Dur-
ing the generation of the initial room layout we sam-
ple uniformly at random from each variable’s domain.
When generating nearby layouts to an existing layout,
Optimizing Hospital Room Layout to Reduce the Risk of Patient Falls
41
we sample each variable’s configuration from a nor-
mal distribution centered around the existing layout’s
configuration and with standard deviation defined for
each variable (σ
σ
σ
r
in Alg. 1). To ensure the constraints
are satisfied during this process we leverage a back-
tracking search method (Karumanchi, 2018). Back-
tracking chooses values for one variable at a time,
checking for constraint satisfaction as variables are
assigned. The method re-samples when a variable as-
signment violates constraints, and backtracks to re-
assign previous variables when a variable has no le-
gal values left to assign, or when a maximum num-
ber of iterations are reached or a maximum time has
elapsed while attempting to assign that variable. In
this way, backtracking recursively returns to previ-
ously assigned values, changing their assignments to
satisfy the constraints.
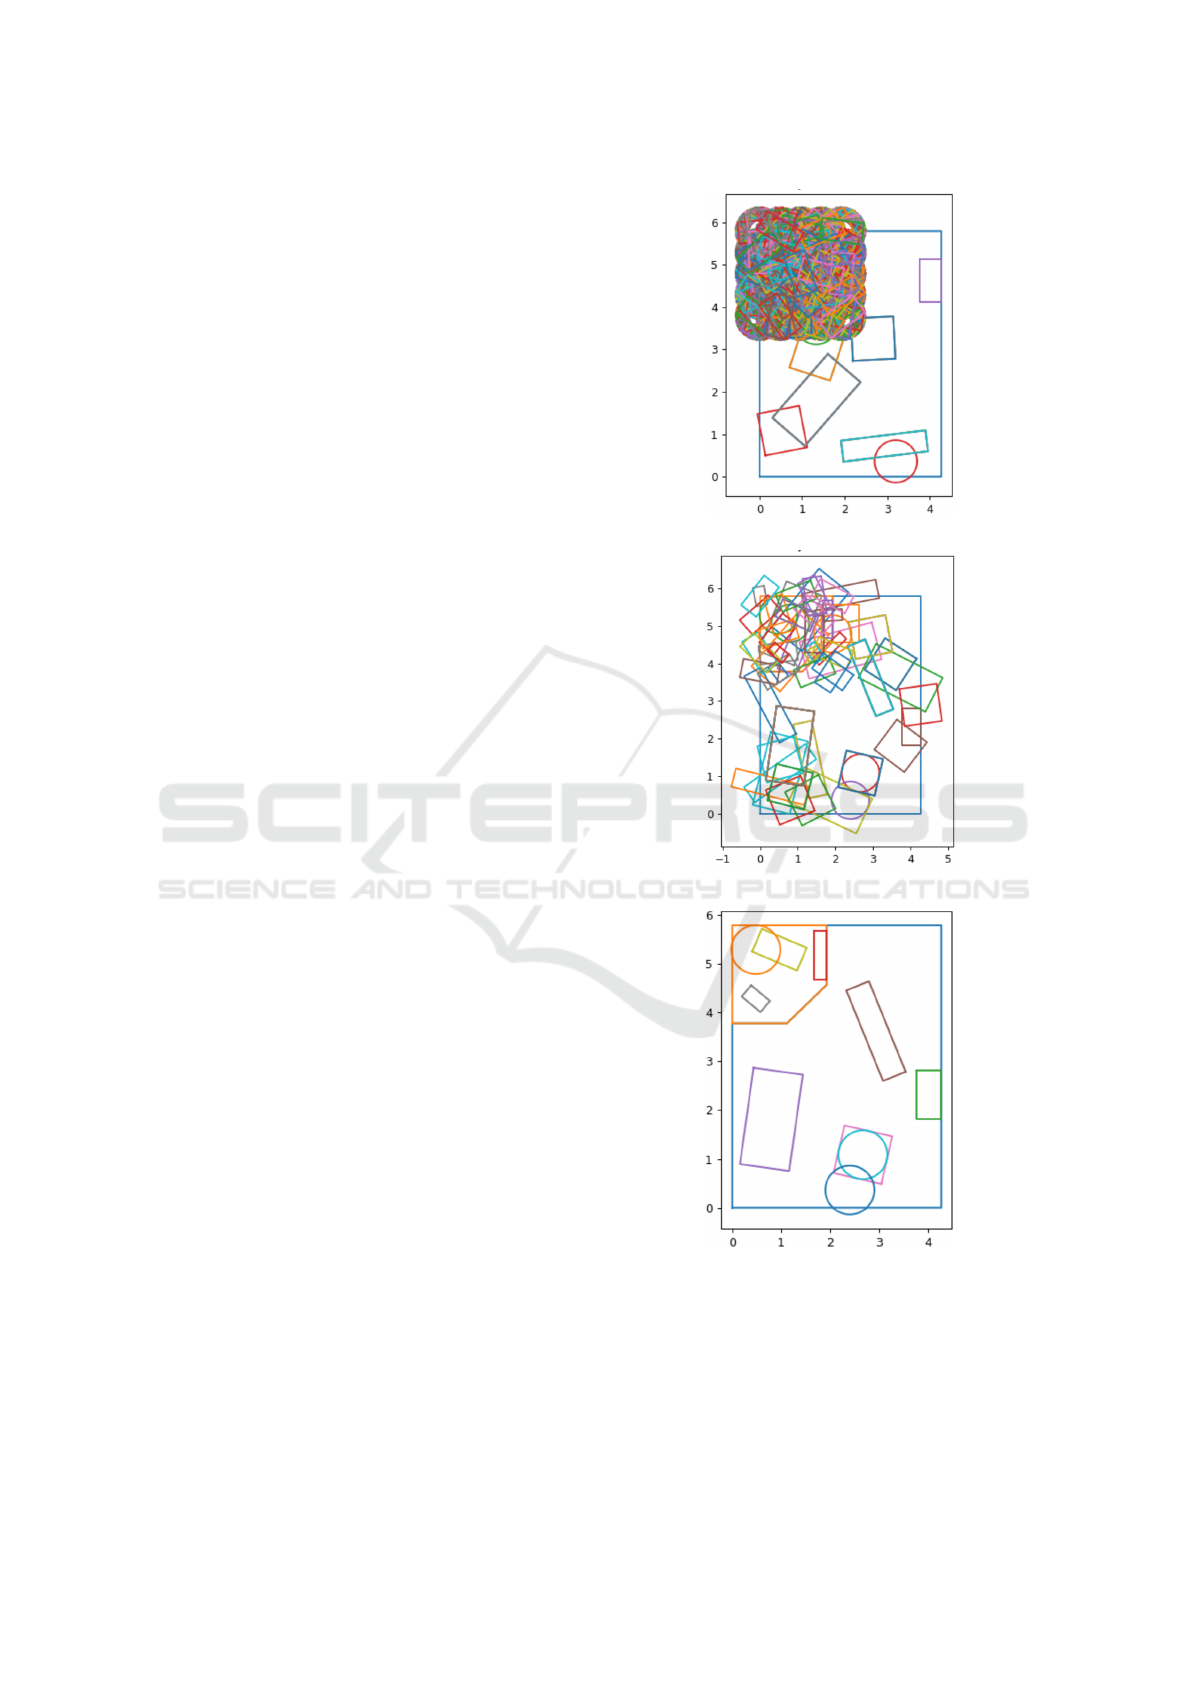
Figure 3 shows an example of backtracking dur-
ing the placement of an object in the hospital room.
In Fig. 3a, the algorithm attempts to place one of the
objects that is required to be in the bathroom, but be-
cause of the placement of the previous objects, it was
not able to do so. The method backtracks and con-
siders other placements for previously placed objects
(Fig 3b). Finally, it successfully places the objects
in the room while satisfying the constraints (Fig 3c).
Figure 4 depicts the overall flow of the backtracking
algorithm.
The constraints in C ensure that the hospital room
layouts generated by our method maintain functional-
ity based on architectural regulation. The constraints
depend on the objects to be placed within the room
and can be defined over a single object, such as re-
quiring certain types of furniture to be adjacent to a
wall and requiring a light to be placed in the bound-
aries of the room, or multiple objects such as ensuring
that there exists a minimum clearance on both sides
of a bed. Our method takes the constraint set as an
input and makes no assumptions about the properties
of the constraint functions, such as differentiability,
other than to require that the constraint functions re-
turn a boolean value indicating whether a specific lay-
out violates or satisfies the constraints. The specific
constraints we use in our experiments are described
in Sec. 4.
4 IMPLEMENTATION AND
EXPERIMENTAL RESULTS
To assess the performance of the proposed model, we
optimize the interior configuration of two common ty-
pologies of hospital rooms: inboard rooms and out-
board rooms. In the inboard architecture, the bath-
(a) Unsuccessful object placement
(b) Multiple object placement trials
(c) Final object placement
Figure 3: Object placement procedure. (a) Previously
placed objects prevent feasible placement of a subsequent
object. (b) Backtracking changes the placement of previ-
ously placed objects. (c) All objects are placed in a way that
satisfies the constraints.
ICORES 2021 - 10th International Conference on Operations Research and Enterprise Systems
42
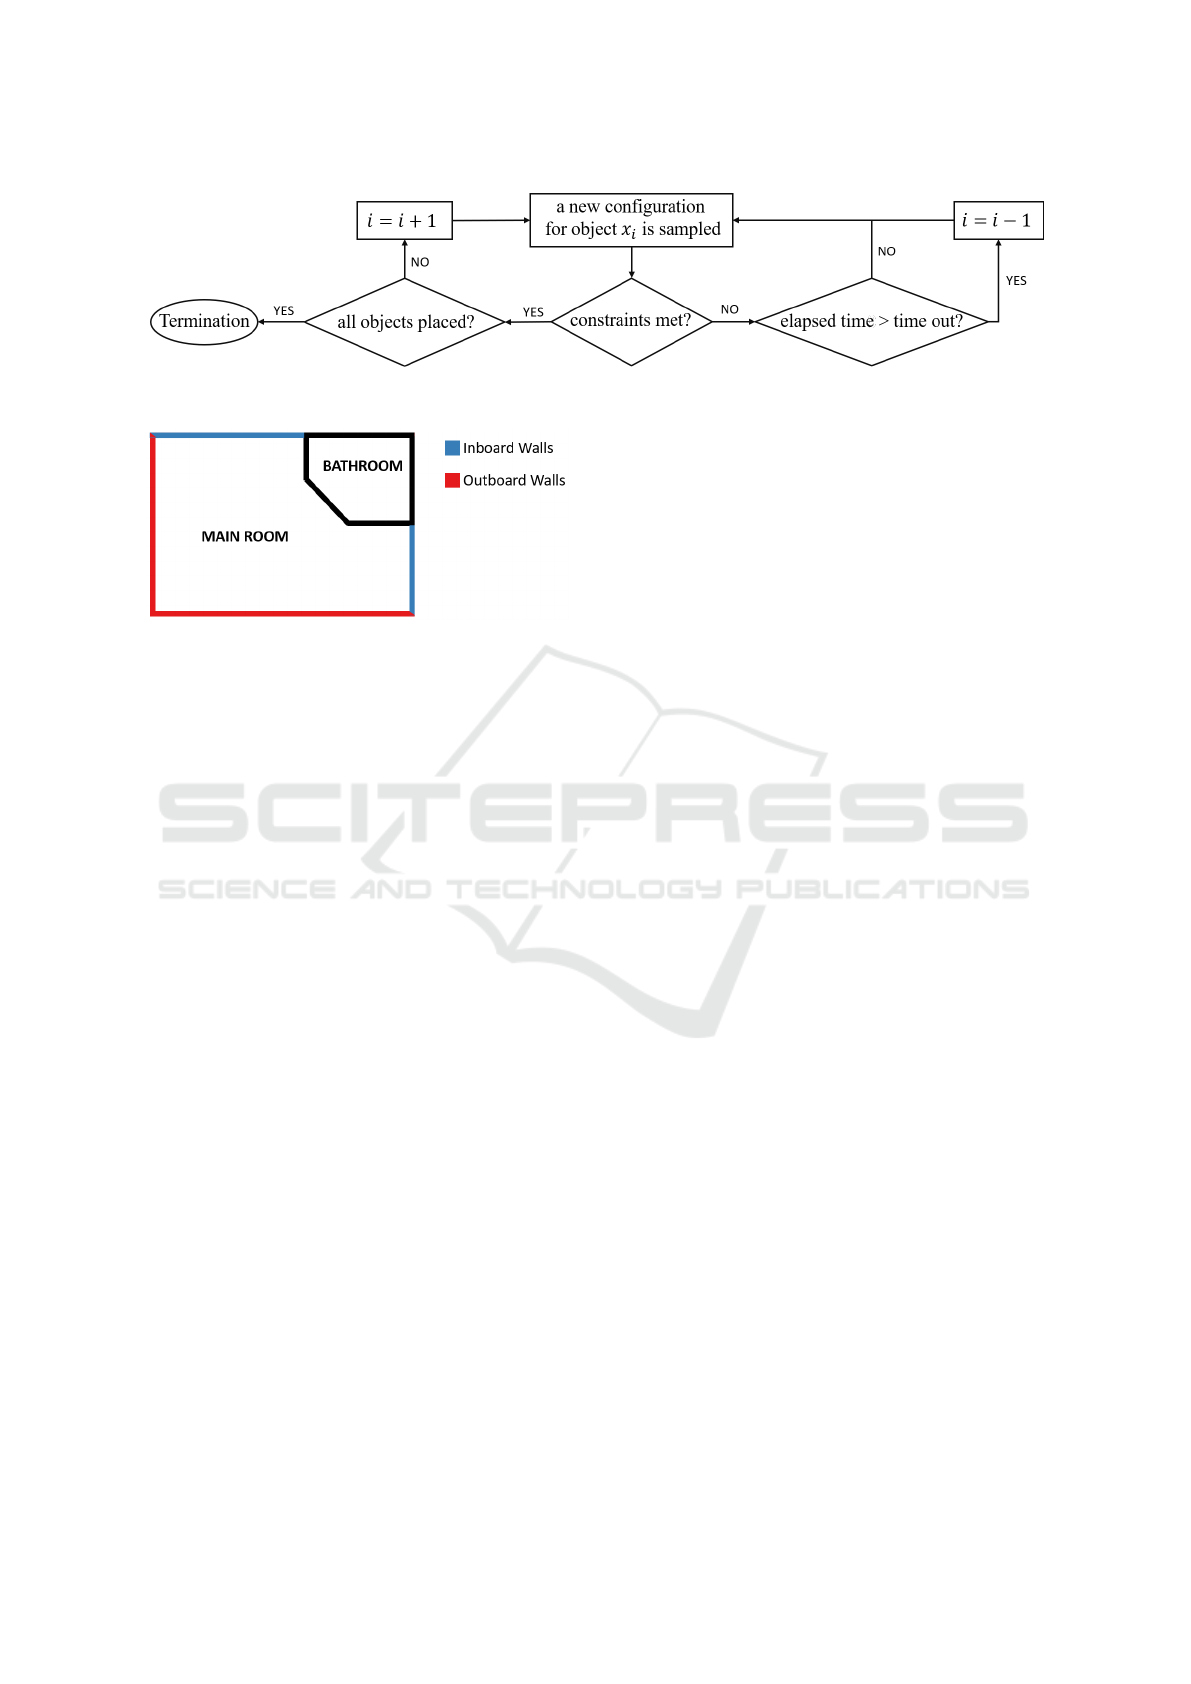
Figure 4: A flowchart of the backtracking method.
Figure 5: Schematic of the hospital room. Blue lines are
permissible hallway door placements for outboard rooms
and red lines show the permissible hallway door placement
walls for inboard rooms.
room is located near the entry of the room and next
to hallways. In the outboard room, the bathroom is
placed along the exterior wall of the room (see Fig. 5).
In this paper, we demonstrate the efficacy of our op-
timization method on a representative sample room
from each of these room types using dimensions and
shapes used in real hospitals.
4.1 Implementation Details
For both the inboard and outboard room experiments
we define X to include: furniture consisting of a sofa,
the patient bed, a patient chair, a visitor chair, a mo-
bile medical stand, a toilet, and a sink; a ceiling light
for both the main room and the bathroom; and a door
connecting the bathroom to the main room and the
main room to the hallway (see Fig. 5).
We make a distinction between the furniture ob-
jects that are required to be placed against the wall
for functionality (the patient bed, sofa, sink, and toi-
let) and the furniture objects that are allowed to be
placed freely throughout the inside of the room (the
patient chair, visitor chair, and mobile medical stand).
Each of the furniture objects that can be placed freely
inside the room have domains that include two po-
sition values, representing the x and y location, and
an orientation value, i.e., R
2
× (S)
1
. The lights have
domains that include the position values but not ori-
entation, R
2
. For both the furniture objects required to
be placed against the wall and the doors we implicitly
represent this using a domain defined by a single real
value associated with the object’s location along a pa-
rameterized representation of the walls unwrapped as
a line (See Fig. 6 for an example).
We define our constraints based on architec-
tural guidelines(Ramsey, 2007; Neufert and Neufert,
2012). We require certain objects to be placed in spe-
cific sub-rooms as well as clearance values around
certain types of objects. These are detailed in Table 1.
The clearance value constraints are designed to
ensure functional use by an average size adult, how-
ever we recognize that additional considerations such
as those defined by the American’s with Disabilities
Act (ADA) may have different requirements. Further,
we require a feasible layout to have one light in the
bathroom area and one light in the main room. We re-
quire the bathroom door to connect the bathroom and
main room and the main door to connect the main
room and the hallway. We also require that no ob-
jects’ geometries overlap in the x, y plane, with the
exception of the lights which are placed on the ceiling
and as such do not collide with objects placed on the
floor. Moreover, the algorithm places each object in
the correct sub-room (see Table 1). For example, the
bed must be placed in the main room. For objects that
can be positioned in either room, such as the cabinets
or sink, the user specifies in which room the object
should be placed.
The difference between the outboard and inboard
room typology manifests in the constraint associated
with the door connecting the patient living area to the
hallway. In an inboard room, this door must be placed
on one of the two walls shared by the bathroom, and
in an outboard room it must be placed on one of the
two walls not shared by the bathroom (see Fig. 5).
The trajectories that we use when calculating the
fall risk (see Sec. 3.2) are: ambulation from the bed to
the patient chair, from the bed to the toilet, and from
the bed to the main door. We set the parameters in
Eq. 1 with α chosen to be 95% of the max(r(
)) value
and ω
1
= ω
2
= ω
3
= 0.33.
The initial temperature value in our simulated an-
nealing is chosen to be 10, k is set to 0.8, κ is set
to 1, numCycles is set to 25, and numTrials is set to
30 based on a heuristic analysis of our cycles’ accep-
Optimizing Hospital Room Layout to Reduce the Risk of Patient Falls
43
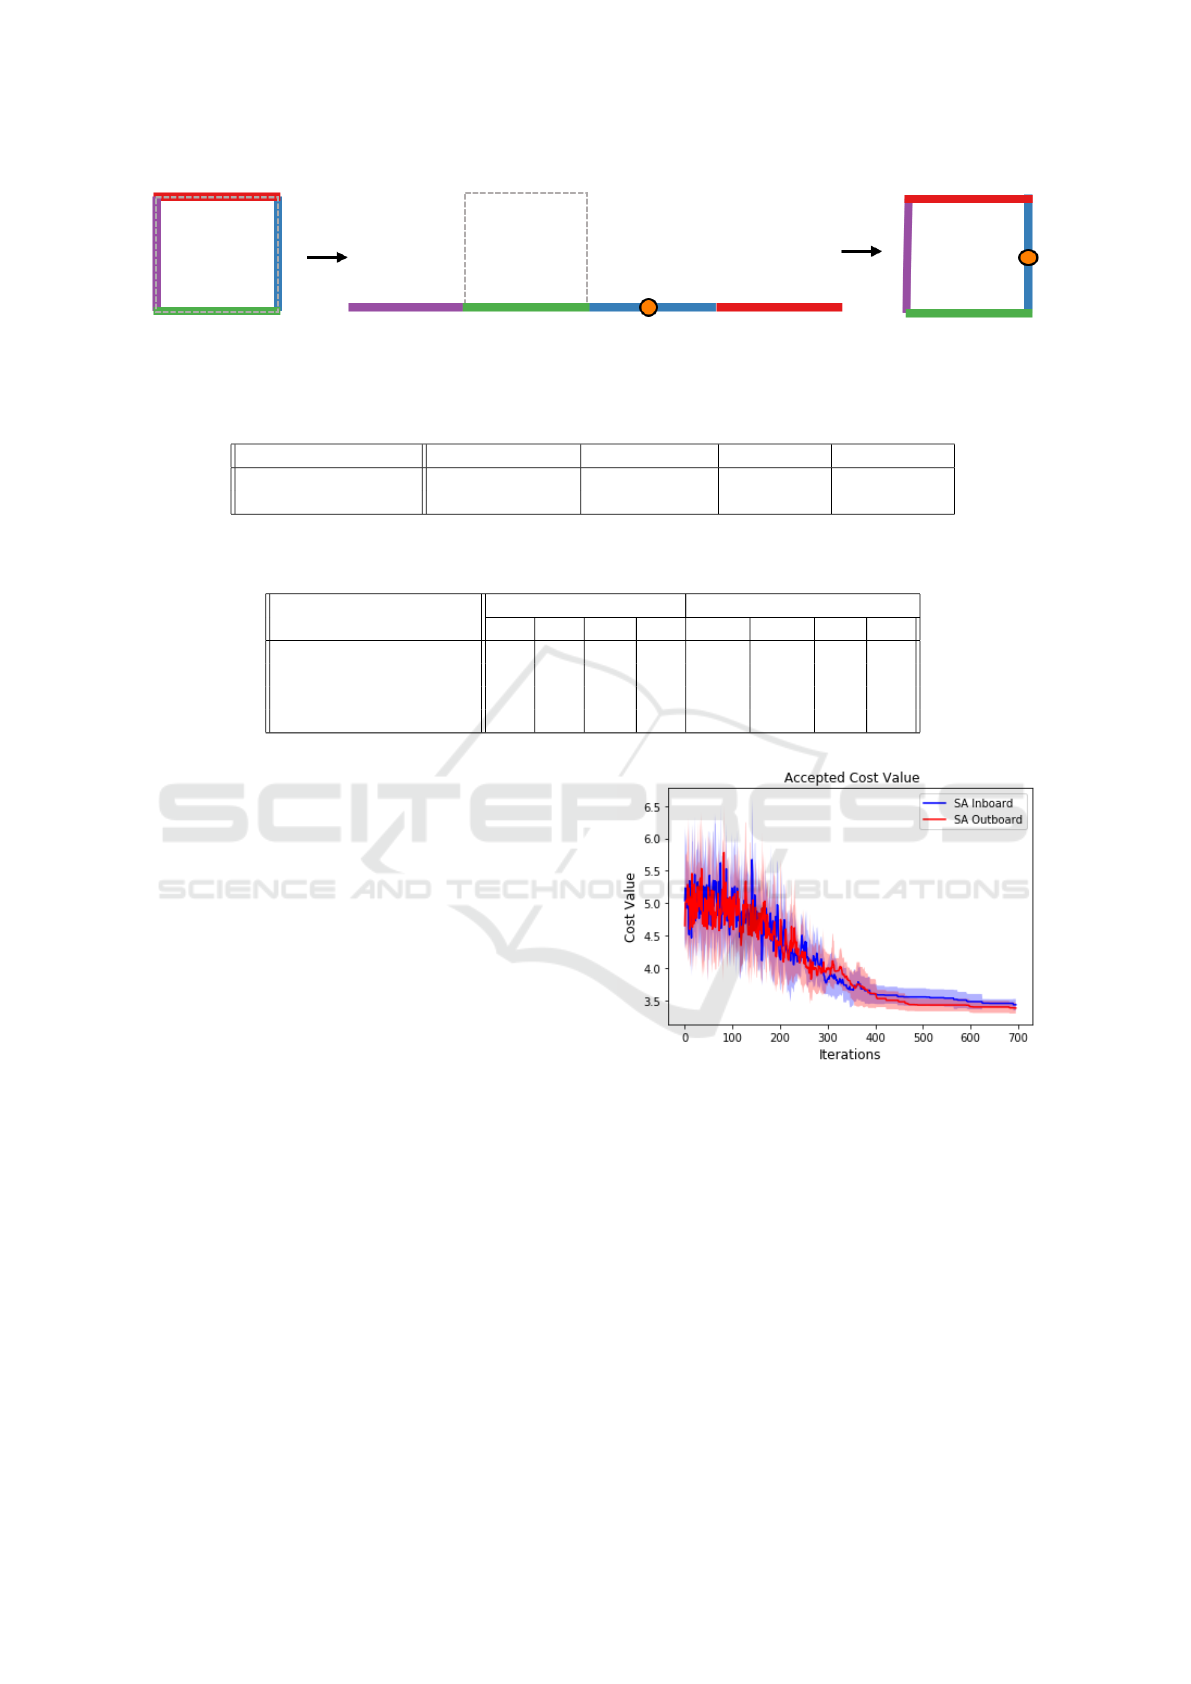
Figure 6: Sampling a point on the walls of the room for objects that are constrained to be against the walls. We unwrap the
walls of the room into a single line, sample a point on the line and then find the coordinates of the sampled point in the original
space with the walls in their original 2D geometry.
Table 1: Clearance constraints for objects placed in the rooms along with the rooms the object belongs to.
Object Bed Sofa & Chairs Toilet Sink
Clearance constraint 0.4m, both sides 0.35m, front 0.4m, front 0.35m, front
Sub-room constraint Main room Main room Bathroom Bathroom
Table 2: Values of σ
σ
σ
r
. Parameters σ
x
and σ
y
are the position of the object inside the room. σ
theta
stands for the orientation
values. Parameter σ
w
shows the standard deviation value for the objects that are attached to a wall.
Objects Main room Bathroom
σ
x
σ
y
σ
θ
σ
w
σ
x
σ
y
σ
θ
σ
w
Furniture (generic) 1m 1m 30
◦
- 0.5m 0.5m 30
◦
-
Furniture (against wall) - - - 5m - - - 1m
Lights 1m 1m - - 1m 1m - -
Doors - - - 4m - - - 2m
tance rates (as in (Szu and Hartley, 1987) and (Duque-
Ant
´
on, 1997)). The values in σ
σ
σ
r
depends on the spe-
cific object and their corresponding sub-room. Table 2
shows the set values for σ
σ
σ
r
. During initial and near-by
room generation, our timeout to initiate backtracking
is set at 5 seconds.
For both the inboard and outboard room typolo-
gies we use the room geometry shown in Figs 1, 9,
and 10.
5 RESULTS AND DISCUSSION
We studied the performance of our optimization al-
gorithm in reducing the risk of fall in two room ty-
pologies. We perform ten optimization runs for each
room typology. The average time required for each
optimization run was (2.4359 ± 0.8453) × 10
4
sec-
onds (≈ 7 hours). In Fig. 7 we plot the cost value
of the layout being considered at each iteration (each
trial of each cycle), i.e., c
current
, averaged over the ten
runs. As can be seen, the simulated annealing algo-
rithm rapidly explores the parameter space early in
the runs, escaping many local minima, however as the
run progresses the algorithm settles upon low cost lay-
outs.
In Fig. 8 we plot the cost value of the best lay-
out found up until that iteration in the optimization,
i.e., c
best
, averaged over the ten runs. The average
Figure 7: The cost value for the layout during the optimiza-
tion iterations for the inboard room type (blue) and the out-
board room type (red). The shaded regions show the corre-
sponding standard deviation of each cost value.
starting cost value for the randomly initialized in-
board rooms and outboard rooms were 5.04±0.4 and
4.67±0.65, respectively. After optimization, the low-
est cost value for the generated rooms for the inboard
type was 3.42 ± 0.08 and 3.36±0.07 for the outboard
type. This represents a reduction of 40% for the in-
board room and 42% for the outboard room. We also
evaluated the risk-of-fall-based cost value of a tradi-
tional hospital room layout, as depicted in Fig. 1a.
The cost value of the traditional layout was found
to be 4.1 ± 0.27. Compared with the traditional lay-
ICORES 2021 - 10th International Conference on Operations Research and Enterprise Systems
44

Figure 8: The cost value for the best layout found up to a
given iteration under our method for the inboard room type
(blue) and the outboard room type (red). We also plot the
value associated with the traditional layout for reference.
The shaded regions represent the corresponding standard
deviation.
out, our optimized layouts achieve a cost reduction of
18.05%. To evaluate the statistical difference between
the traditional room cost value, and the starting cost
values and the final cost values for the generated room
typologies, we applied the two sample Kolmogorov-
Smirnov test (K-S test), a statistical test designed to
determine if two continuous or discrete distributions
are significantly different (Chakravarti et al., 1967).
We examined the similarity between the distributions
in five cases: 1) inboard: the cost values of the ini-
tial randomized layouts vs the cost values of the final
layouts, 2) outboard: cost values of the initial random-
ized layouts vs cost values of the final layouts, 3) the
final cost values of the optimized inboard rooms vs
the final cost values of the optimized outboard rooms,
4) the final cost values of the optimized inboard rooms
vs the cost values of the traditional room, and 5) the fi-
nal cost values of the optimized outboard rooms vs the
cost values of the traditional room. In all five cases,
the null hypothesis was rejected at the 5% signifi-
cance level. For the initial vs final cost values for both
the inboard and outboard rooms, and the comparison
between the optimized inboard and outboard rooms
with the traditional room, the order of the asymptotic
p-value was 10
−5
with K-S score of 1. In rejecting
the null hypothesis for inboard vs outboard final cost
values, the p−value was computed as 0.0310 with a
K-S score of 0.6, which indicates more similarity than
between the initial and final layouts, but still signifi-
cantly different. In Figs. 9 and 10, we show repre-
sentative inboard and outboard room layouts, both be-
fore and after optimization, as well as their associated
fall risk score heatmaps. In Fig. 1 we show the same
for the traditional layout. One potentially interesting
(a) Initial room layout (b) Final room layout
(c) Initial risk heatmap (d) Final risk heatmap
Figure 9: Outboard room layout evaluation and optimiza-
tion with respect to fall risk. (a) and (b) show schematics
of the outboard rooms generated by the algorithm. (a) is an
instance of the initial room layout and (b) shows the op-
timized room layout for one of the runs. (c) and (d) show
the corresponding heat map of the risk of fall as evaluated
by the fall risk model. Higher values on the color-bars of
figures (c) and (d) indicate higher risk of falls.
trend is the lower cost values found when optimiz-
ing the outboard rooms compared with the inboard
rooms. Looking at Fig. 5, placing the hallway door
on one of the further walls to the bathroom will place
the door in between the bed and the bathroom. This
results in trajectories with fewer sharp turns, which
decreases the risk of falls as defined in the fall risk
model. This may also result from outboard walls be-
ing longer than the inboard walls for our room ge-
ometry, and hence, the algorithm has more options of
sampling points for door placement and potentially
more configuration options.
6 CONCLUSION AND FUTURE
WORK
In this work, we presented a method that built upon
a patient fall-risk model and presented a gradient-free
optimization method, based on simulated annealing,
to reduce the risk of patient falls in hospital rooms
by optimizing the configurations of objects inside the
room. We evaluated our method on two room ty-
Optimizing Hospital Room Layout to Reduce the Risk of Patient Falls
45

(a) Initial room layout
(b) Final room layout
(c) Initial risk heatmap
(d) Final risk heatmap
Figure 10: Inboard room layout evaluation and optimization
with respect to fall risk. (a) and (b) show schematics of the
inboard rooms generated by the algorithm. (a) is an instance
of the initial room layout and (b) shows the optimized room
layout for one of the runs. (c) and (d) show the correspond-
ing heat map of the risk of fall as evaluated by the fall risk
model. Higher values on the color-bars of figures (c) and (d)
indicate higher risk of falls.
pologies, inboard and outboard, with common hospi-
tal room objects utilized in both. The algorithm opti-
mized the layout of the rooms with respect to a cost
function that was defined based on the distribution of
the patient fall risk in the rooms, which considered
both static factors associated with the object place-
ments in the room as well as the kinematics and dy-
namics of simulated patient trajectories.
Our method leverages constraints based on object
functionality and architectural guidelines used for fa-
cility layout planning. We demonstrated results, aver-
aging ten runs for each room type, showing significant
improvement with respect to our patient fall-risk cost
metric compared to both random initial room layouts
and traditional hospital room layouts.
We chose simulated annealing as a canonical opti-
mization option for complex gradient-free problems
such as ours and intend the results to demonstrate
the feasibility of utilizing optimization in the problem
domain. However we recognize that many other op-
timization methods may be applicable and intend to
investigate the use of other methods such as genetic
algorithms, particle swarms, gray wolf optimizer, etc,
in the future. Further, we intend to investigate the use
of other metrics defined over the fall-risk distribution
beyond the weighted metric presented in this work.
We will incorporate expert feedback from hospital de-
signers, architects, and healthcare providers into the
optimization loop. This feedback will be used to en-
hance the fall risk model and optimization method to
improve our result and achieve a functional, safe room
layout.
We will also conduct human subject studies to
evaluate the result of optimized room layouts in re-
ducing the risk of patient falls in a simulated hospi-
tal room. While our method and the fall-risk model it
builds upon are specific to hospital room layouts, our
method may have applications in reducing falls in at-
risk populations outside of healthcare settings as well.
These other environments include assisted living, and
long-term care facilities, and homes of individuals at
high risk of falls.
We believe that this work takes significant steps
toward demonstrating the feasibility of optimizing the
layout of hospital rooms in order to reduce the risk of
patient falls and improve patient outcomes.
ACKNOWLEDGMENT
This project was supported by grant number
R18HS025606 from the Agency for Healthcare Re-
search and Quality (AHRQ). The content is solely the
responsibility of the authors and does not necessarily
represent the official views of the Agency for Health-
care Research and Quality.
REFERENCES
Aarts, E. and Korst, J. (1988). Simulated annealing and
boltzmann machines.
Ahonen, H., de Alvarenga, A. G., and Amaral, A. R. (2014).
Simulated annealing and tabu search approaches for
the corridor allocation problem. European Journal of
Operational Research, 232(1):221–233.
Alert, S. E. (2015). Preventing falls and fall-related injuries
in health care facilities. The Joint Commission, 55:1–
5.
Araghi, S. K. and Stouffs, R. (2015). Exploring cellular au-
tomata for high density residential building form gen-
eration. Automation in Construction, 49:152–162.
Aranda-Gallardo, M., Morales Asencio, J. M., Canca-
Sanchez, J. C., Mora-Banderas, A. M., Moya-Suarez,
A. B., and for preventing falls in Hospital Costa del
Sol, G. (2013). Instruments for assessing the risk of
falls in acute hospitalized patients: a systematic review
protocol. Journal of Advanced Nursing, 69(1):185–
193.
ICORES 2021 - 10th International Conference on Operations Research and Enterprise Systems
46

Baykaso
˘
glu, A. and Gindy, N. N. (2001). A simulated an-
nealing algorithm for dynamic layout problem. Com-
puters & Operations Research, 28(14):1403–1426.
Bertsimas, D., Tsitsiklis, J., et al. (1993). Simulated anneal-
ing. Statistical science, 8(1):10–15.
Callis, N. (2016). Falls prevention: Identification of predic-
tive fall risk factors. Applied nursing research, 29:53–
58.
Cameron, I. D., Gillespie, L. D., Robertson, M. C., Mur-
ray, G. R., Hill, K. D., Cumming, R. G., and Kerse, N.
(2012). Interventions for preventing falls in older peo-
ple in care facilities and hospitals. Cochrane database
of systematic reviews, (12).
ˇ
Cern
`
y, V. (1985). Thermodynamical approach to the trav-
eling salesman problem: An efficient simulation algo-
rithm. Journal of optimization theory and applica-
tions, 45(1):41–51.
Chakravarti, I. M., Laha, R. G., and Roy, J. (1967). Hand-
book of methods of applied statistics, volume 2. Wiley.
Choi, Y.-S., Lawler, E., Boenecke, C. A., Ponatoski, E. R.,
and Zimring, C. M. (2011). Developing a multi-
systemic fall prevention model, incorporating the
physical environment, the care process and technol-
ogy: a systematic review. Journal of advanced nurs-
ing, 67(12):2501–2524.
Clarke, H. D., Timm, V. L., Goldberg, B. R., and Hattrup,
S. J. (2012). Preoperative patient education reduces
in-hospital falls after total knee arthroplasty. Clinical
Orthopaedics and Related Research®, 470(1):244–
249.
Commission, J. et al. (2015). Preventing falls and fall-
related injuries in health care facilities. Sentinel Event
Alert, (55):1.
Donald, I., Pitt, K., Armstrong, E., and Shuttleworth, H.
(2000). Preventing falls on an elderly care rehabili-
tation ward. Clinical rehabilitation, 14(2):178–185.
Dowsland, K. A. and Thompson, J. (2012). Simulated
annealing. Handbook of natural computing, pages
1623–1655.
Duque-Ant
´
on, M. (1997). Constructing efficient simulated
annealing algorithms. Discrete Applied Mathematics,
77(2):139–159.
Faber, R., Jockenh
¨
ovel, T., and Tsatsaronis, G. (2005). Dy-
namic optimization with simulated annealing. Com-
puters & chemical engineering, 29(2):273–290.
Gal, R., Shapira, L., Ofek, E., and Kohli, P. (2014). Flare:
Fast layout for augmented reality applications. In
2014 IEEE International Symposium on Mixed and
Augmented Reality (ISMAR), pages 207–212. IEEE.
Gh
´
edira, K. (2013). Constraint satisfaction problems: csp
formalisms and techniques. John Wiley & Sons.
Hignett, S. and Masud, T. (2006). A review of environ-
mental hazards associated with in-patient falls. Er-
gonomics, 49(5-6):605–616.
Hsiao, H. (2016). Fall Prevention and Protection: Princi-
ples, Guidelines, and Practices. CRC Press.
Hughes, R. (2008). Patient safety and quality: An evidence-
based handbook for nurses, volume 3. Agency for
Healthcare Research and Quality Rockville, MD.
IKEA (2019). Ikea apps - ikea. https://www.ikea.com/
us/en/customer-service/mobile-apps/. (Accessed on
09/14/2020).
Jamali, N., Leung, R. K., and Verderber, S. (2020). A review
of computerized hospital layout modelling techniques
and their ethical implications. Frontiers of Architec-
tural Research.
Karumanchi, N. (2018). Algorithm Design Techniques: Re-
cursion, Backtracking, Greedy, Divide and Conquer,
and Dynamic Programming. CareerMonk Publica-
tions.
Kirkpatrick, S., Gelatt, C. D., and Vecchi, M. P. (1983).
Optimization by simulated annealing. Science,
220(4598):671–680.
Leaperr (2018). Autonomous ai interior design system.
https://www.builtworld.com/db/company/leaperrai.
(Accessed on 09/16/2020).
Liggett, R. S. (1985). Optimal spatial arrangement as a
quadratic assignment problem. In Design Optimiza-
tion, pages 1–40. Elsevier.
Lin, Q.-L., Liu, H.-C., Wang, D.-J., and Liu, L. (2015). In-
tegrating systematic layout planning with fuzzy con-
straint theory to design and optimize the facility lay-
out for operating theatre in hospitals. Journal of Intel-
ligent Manufacturing, 26(1):87–95.
Mayo, N. E., Gloutney, L., and Levy, A. R. (1994). A
randomized trial of identification bracelets to pre-
vent falls among patients in a rehabilitation hospi-
tal. Archives of physical medicine and rehabilitation,
75(12):1302–1308.
McKendall Jr, A. R., Shang, J., and Kuppusamy, S. (2006).
Simulated annealing heuristics for the dynamic facil-
ity layout problem. Computers & operations research,
33(8):2431–2444.
Merrell, P., Schkufza, E., Li, Z., Agrawala, M., and Koltun,
V. (2011). Interactive furniture layout using interior
design guidelines. ACM transactions on graphics
(TOG), 30(4):1–10.
Metropolis, N., Rosenbluth, A. W., Rosenbluth, M. N.,
Teller, A. H., and Teller, E. (1953). Equation of state
calculations by fast computing machines. The journal
of chemical physics, 21(6):1087–1092.
Neufert, E. and Neufert, P. (2012). Architects’ data. John
Wiley & Sons.
Nikolaev, A. G. and Jacobson, S. H. (2010). Simulated an-
nealing. In Handbook of metaheuristics, pages 1–39.
Springer.
Novin, R. S., Taylor, E., Hermans, T., and Merryweather, A.
(2020). Development of a novel computational model
for evaluating fall risk in patient room design. HERD:
Health Environments Research & Design Journal.
Palubeckis, G. (2015). Fast simulated annealing for single-
row equidistant facility layout. Applied Mathematics
and Computation, 263:287–301.
Planner5D (2011). Free 3d home planner — design a house
online: Planner5d. https://planner5d.com/. (Accessed
on 09/14/2020).
Ramsey, C. G. (2007). Architectural graphic standards.
John Wiley & Sons.
Optimizing Hospital Room Layout to Reduce the Risk of Patient Falls
47

Rismanchian, F. and Lee, Y. H. (2017). Process mining–
based method of designing and optimizing the lay-
outs of emergency departments in hospitals. HERD:
Health Environments Research & Design Journal,
10(4):105–120.
Rockafellar, R. T. and Uryasev, S. (2002). Conditional
value-at-risk for general loss distributions. Journal of
banking & finance, 26(7):1443–1471.
Romeijn, H. E. and Smith, R. L. (1994). Simulated anneal-
ing for constrained global optimization. Journal of
Global Optimization, 5(2):101–126.
S¸ ahin, R. (2011). A simulated annealing algorithm for solv-
ing the bi-objective facility layout problem. Expert
Systems with Applications, 38(4):4460–4465.
Serafini, P. (1994). Simulated annealing for multi objective
optimization problems. In Multiple criteria decision
making, pages 283–292. Springer.
SpacemakerAI (2016). Spacemaker: a cloud-based ai soft-
ware. https://www.spacemakerai.com/. (Accessed on
09/14/2020).
Szu, H. and Hartley, R. (1987). Fast simulated annealing.
Physics letters A, 122(3-4):157–162.
Tideiksaar, R., Feiner, C. F., and Maby, J. (1993). Falls pre-
vention: the efficacy of a bed alarm system in an acute-
care setting. The Mount Sinai Journal of Medicine,
New York, 60(6):522–527.
Tutenel, T., Bidarra, R., Smelik, R. M., and De Kraker, K. J.
(2009). Rule-based layout solving and its application
to procedural interior generation. In CASA Workshop
on 3D Advanced Media In Gaming And Simulation.
Van Laarhoven, P. J. and Aarts, E. H. (1987). Simulated
annealing. In Simulated annealing: Theory and appli-
cations, pages 7–15. Springer.
Willgoss, T. G., Yohannes, A. M., and Mitchell, D. (2010).
Review of risk factors and preventative strategies for
fall-related injuries in people with intellectual disabil-
ities. Journal of clinical nursing, 19(15-16):2100–
2109.
Wu, W., Fan, L., Liu, L., and Wonka, P. (2018). Miqp-
based layout design for building interiors. In Com-
puter Graphics Forum, volume 37, pages 511–521.
Wiley Online Library.
Yang, X.-S. (2014). Nature-inspired optimization algo-
rithms. Elsevier.
Zuo, X., Li, B., Huang, X., Zhou, M., Cheng, C., Zhao, X.,
and Liu, Z. (2019). Optimizing hospital emergency
department layout via multiobjective tabu search.
IEEE Transactions on Automation Science and Engi-
neering, 16(3):1137–1147.
ICORES 2021 - 10th International Conference on Operations Research and Enterprise Systems
48
